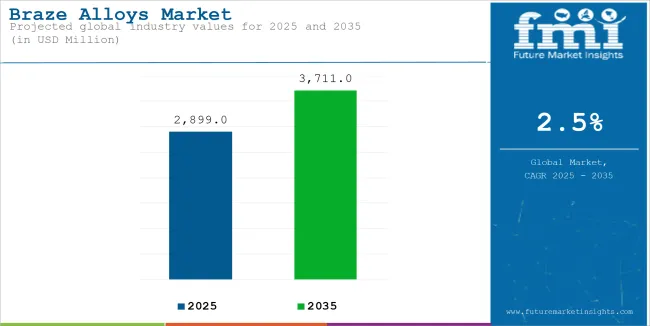
The global braze alloys market is estimated to reach USD 2,899.0 million in 2025 and expand to approximately USD 3,711.0 million by 2035, reflecting a CAGR of 2.5% during the forecast period. Demand is being supported by applications across aerospace, automotive, electronics, and energy industries, where strong metallurgical bonding and thermal stability are essential.
Braze alloys are being used in environments requiring reliable mechanical integrity at elevated temperatures and resistance to oxidation and corrosion. In the aerospace sector, these materials are being applied in jet engine components, turbine blades, and hydraulic systems. Brazed joints are ensuring the structural integrity of components exposed to thermal cycling and high-pressure operations.
In automotive manufacturing, braze alloys are being utilized in exhaust assemblies, heat exchangers, and electric vehicle battery systems. The shift toward electrified powertrains is creating a consistent need for materials with high conductivity and thermal resilience in compact battery modules and thermal management components.
Microelectronics and semiconductor packaging are contributing to growing demand for precision brazing solutions. Braze alloys are being integrated into circuit boards, power modules, and heat sinks, where strong joints and thermal transfer are critical. The rise of 5G infrastructure and AI-driven hardware is increasing the use of miniaturized, high-performance electronic components, further accelerating demand.
Regulatory actions restricting hazardous substances are driving the transition to lead-free and nickel-free brazing alloys. Alloy developers are investing in compositions that meet compliance with RoHS and REACH directives, while still delivering high bond strength and fatigue resistance. Research efforts are targeting improved flow characteristics, reduced processing temperatures, and enhanced oxidation resistance.
In energy applications, braze alloys are being adopted in solar thermal systems, fuel cell stacks, and heat exchangers in renewable energy plants. Requirements for corrosion resistance and electrical conductivity are driving material selection in these applications.
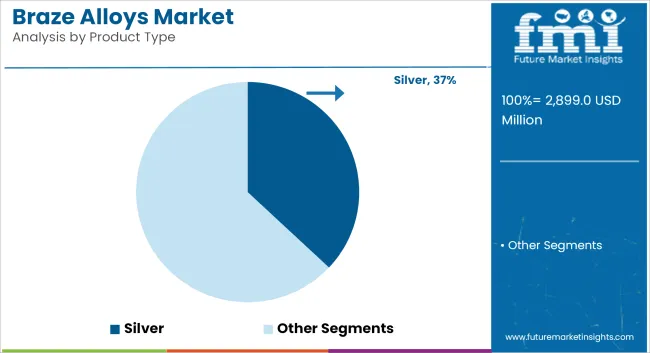
Silver-based braze alloys are estimated to account for approximately 37% of the global braze alloy market share in 2025 and are projected to grow at a CAGR of 2.6% through 2035. These alloys are extensively used in high-reliability joints for HVAC systems, electrical connectors, medical devices, and precision engineering applications.
Silver brazing offers a lower melting point and stronger mechanical properties compared to other materials, which is especially valuable in applications requiring minimal thermal distortion. Despite their higher cost, silver-based alloys remain the preferred choice in industries demanding high joint strength, electrical conductivity, and oxidation resistance under operational stress.
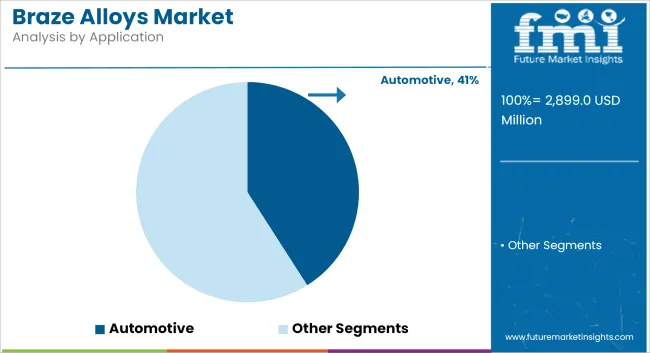
The automotive segment is projected to hold approximately 41% of the global braze alloy market share in 2025 and is expected to grow at a CAGR of 2.7% through 2035. Braze alloys are widely used in joining aluminum, stainless steel, and copper components that require leak-tight, high-temperature-resistant bonding. Applications include air conditioning systems, fuel injection assemblies, radiators, and turbocharger modules.
The continued shift toward lightweighting, vehicle electrification, and improved thermal management systems is driving the need for advanced brazing materials in automotive manufacturing. As OEMs and Tier 1 suppliers pursue reliability and production efficiency, the automotive sector remains the largest and most consistent end-use segment for braze alloys worldwide.
Fluctuating Raw Material Prices
The fluctuating prices of raw materials, particularly silver, nickel, and gold, stand as the biggest hindrance in the flourishing of the brazing alloys industry. These elements are pivotal in such operations despite their erratic prices determined by global demand, geopolitical tensions, and supply chain disruptions.
Cost changes can result in production costs being affected as well as profit margins, which consequently, makes the work of manufacturers harder; thus, it is difficult to sustain the cost efficiency while ensuring the quality of the products. As a response to the volatility that is not just temporary, businesses are probing the ideas of strategic sourcing, long-term contracts, and price hedging as possible measures.
Nevertheless, these plans need to be carefully monitored and may require a huge amount of initial funds before they become profitable. The raw material price volatility which is so uncertain, takes the toll on the industries since they need superior brazing alloys in order to be reliable and perform efficiently, for instance, aerospace and electronics sectors. These industries need to keep inventing and improving their technology so as to reduce cost impacts, at the same time, sustaining product standards.
Environmental and Regulatory Compliance
The stringency of environmental laws has added a strong challenge in the brazing alloys sector, mainly with the presence of materials such as lead and cadmium that were traditionally used in the alloy formulation. As the world moves towards stricter environmental regulations introduced by the government globally, manufacturers come under pressure to look for alternative materials, which will be non-toxic for their brazing.
This divergence from the old material to new ones would involve hefty research and development costs, along with plant modifications and certifications in order to comply with both domestic and international standards. In addition, the complicated process of market regulations changing across different areas has led to the worry of the manufacturers who have to adapt to diverse legal frameworks. However, while the quest for the green alternative is driving technological advancements but still, it serves as a cost burden for the companies.
By the compliance with these changing regulations, not only a lot amount of the cash will be taken up but also continuous new advancement needs to be made to be ahead of the game in the progressively environmental friendly market.
Increasing Demand for Lead-Free and Sustainable Brazing Solutions
The rising demand for lead-free and non-toxic brazing alloys is an added advantage in the brazing alloys industry. The introduction of stricter regulations on the environment has motivated many industries to abandon even the most looked after lead-based substances that were used mainly for their strength, conductivity, and simplicity of use.
Lead has always had harmful effects on human health as well as the environment and this has led the governments to impose more restrictions and then to abolish its applications in various domains. The movement toward environmentally sustainable production practices has opened up avenues for the manufacturers to create innovations and factor in the creation of environmentally friendly alloys that have equal to or better performance in sectors such as electronics, automotive, and renewable energy.
Companies that would lead the charge in the making of these products will thus, become the pioneers in the green market, and at the same time, they will meet the requirements of the law and consumers' desire for environmentally friendly solutions. This edge will help these firms to outplay their competitors in a dynamic market; especially when the demand for technological advancements that are not polluting increases.
Growth in Electric Vehicles and Renewable Energy Applications
The switch to electric cars (EVs) and renewable energy on a global basis is a big growth chance for companies making brazing alloy. These branches modularly use space-age materials administration to boost their components fidelity, transmission, and thermal efficiency. For example, batteries, fuel cells, power electronics, and heat management systems are some of the key components that are made of high-performing materials.
In particular, within the renewable energy sector and electric vehicles, the manufacturing industry works in harsh conditions, therefore, they require new and special high-performance brazing materials that can work under high temperatures and immense difficulty, but maintain the standard.
As governments and businesses continue to push for more sustainable energy solutions, the demand for brazing alloys is expected to rise, especially in sectors like battery technology, fuel cell systems, and solar or wind power infrastructure.
Those manufacturers who are able to focus their attention on the particular aspects of the industries requiring; increased thermal conductivity, strength, and corrosion resistance, will be in a position to expand this business considerably.
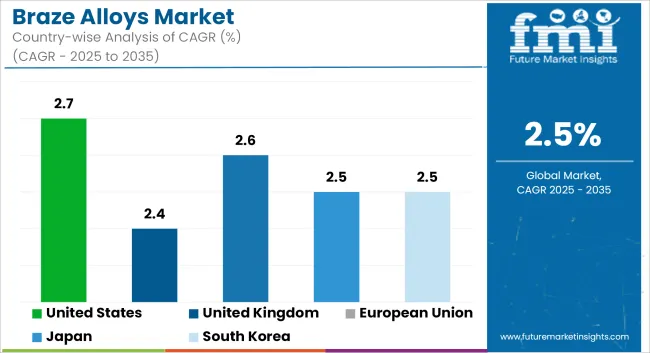
The United States braze alloys market has positive development mainly due to aerospace and automotive industries, which are the biggest consumers of these materials. The growing necessity of premium bonding solutions in jet engines, automotive exhaust systems, and heat exchangers is the major factor for the rise in the market.
On the other hand, the country is going through a phase of increased application of brazing technology in the HVAC sector for more efficient cooling systems. The dominance of famous manufacturers and the developments in the field of brazing technology also lead to the market expansion. In addition, government rules encouraging energy efficiency and discharge minimization in car and industrial applications are also the forces that shape market trends.
| Country | CAGR (2025 to 2035) |
|---|---|
| United States | 2.7% |
The UK braze alloys market has been growing steadily, which is mainly due to the increase in applications in the aerospace, electronics, and renewable energy sectors. The market is growing owing to the technical requirement for precision brazing in the advanced manufacturing processes mainly of aircraft turbine components and also the electronic circuit boards.
On top of this, the emphasis of the country on renewable energy is the reason for the increased use of braze in solar panels and heat exchangers. The push towards high-strength, no-lead, and environment-friendly braze alloys has been a directive also to the reshaping of the sector.
| Country | CAGR (2025 to 2035) |
|---|---|
| United Kingdom | 2.4% |
The EU market for braze alloys is on the rise, with a firm growth trend, owing to the ever-increasing need in the aerospace, automotive, and HVAC sectors, among others. The very strict ecological standards that are aiming for energy efficiency and less waste through-ge of the new brazing techniques are the reasons for their promotion.
Besides, the progress made in the field of electric vehicles (EVs) as well as the rise of high-performance green energy projects are the factors that are boosting further demand for top-grade braze alloys. The presence of the main production facilities for the automotive sector as well as machinery oversees sector-produced in Germany, France, and Italy supports the increasing runs of the braze alloys market.
| Region | CAGR (2025 to 2035) |
|---|---|
| European Union | 2.6% |
Japan's braze alloys market is primarily propelled by its highly developed manufacturing sector, the dominant position in the electronics industry, and a considerable amount of precision brazing used in automotive and aerospace applications. The country is also a leader in the field of robotics and industrial automation, which is the main factor that is fuelling the demand for super-performance brazing solutions.
In addition, the country is focused on environmentally-friendly manufacturing and lead-free soldering materials, which are the main reasons that spur the development of braze alloys. The sector is further consolidated by the growing need for electric vehicles and hybrid technologies.
| Country | CAGR (2025 to 2035) |
|---|---|
| Japan | 2.5% |
The braze alloys market in South Korea is showing a notable growth trajectory primarily because of the nation's solid industrial base in electronics, automotive, and industrial equipment manufacturing. As the country is focusing on cutting-edge technologies such as 5G networks and electric vehicles, the requirement for precision brazing solutions is escalating.
Also, the increase in semiconductor fabrication and investment in renewable energy ventures is accelerating the application of braze alloys. Besides, the firms backing for sustainable manufacturing and energy-efficient processes are the other reasons why the market is flourishing.
| Country | CAGR (2025 to 2035) |
|---|---|
| South Korea | 2.5% |
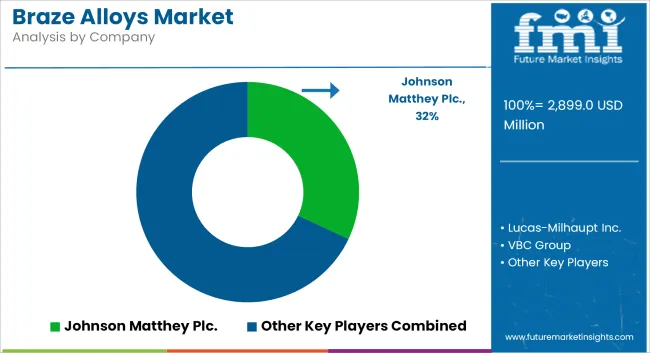
The brazing alloy market is evolving with producers focusing on enhancing supply chain efficiency and product performance to meet increasing demand in critical applications. Key players are optimizing production processes and refining their product portfolios to offer solutions tailored for high-reliability industries, such as aerospace, medical devices, and power electronics.
Companies are investing in advanced alloys, including titanium- and zirconium-based formulations, designed to provide superior wetting and bond strength, enabling complex assemblies in extreme environments. The focus on shortening lead times, improving material availability, and offering precision-driven solutions is helping companies better respond to customer needs.
In terms of Product Type, the industry is divided into Copper, Gold, Silver, Aluminum, Other Product Types
In terms of material type, the industry is divided into Automotive, Electronics, Aerospace, Others
The report covers key regions, including North America, Latin America, Western Europe, Eastern Europe, East Asia, South Asia, and the Middle East and Africa (MEA).
The Braze Alloys Market is estimated to reach USD 2,899.0 million by the end of 2025.
The market is projected to exhibit a CAGR of 2.5% over the assessment period.
By the end of 2035, the market is expected to reach a value of USD 3,711.0 million.
Major companies operating in the aviation fuel additives market include Johnson Matthey, OC Oerlikon Management AG (Oerlikon Metco), Sulzer Ltd.


Full Research Suite comprises of:
Market outlook & trends analysis
Interviews & case studies
Strategic recommendations
Vendor profiles & capabilities analysis
5-year forecasts
8 regions and 60+ country-level data splits
Market segment data splits
12 months of continuous data updates
DELIVERED AS:
PDF EXCEL ONLINE
Brazed Plate Heat Exchangers Market Size and Share Forecast Outlook 2025 to 2035
Halloysite Market Size and Share Forecast Outlook 2025 to 2035
Superalloys Market Size and Share Forecast Outlook 2025 to 2035
Metal Alloys Market Size and Share Forecast Outlook 2025 to 2035
Aluminum Alloys Market Size and Share Forecast Outlook 2025 to 2035
Automotive Alloys Market Size and Share Forecast Outlook 2025 to 2035
High Temperature Alloys Market Growth - Trends & Forecast 2025 to 2035

Thank you!
You will receive an email from our Business Development Manager. Please be sure to check your SPAM/JUNK folder too.
Chat With
MaRIA