Bronopol Market Outlook (2025 to 2035)

The Bronopol Market is estimated to be valued at USD 1.3 billion in 2025 and is projected to reach USD 2.1 billion by 2035, registering a compound annual growth rate (CAGR) of 5.1% over the forecast period.
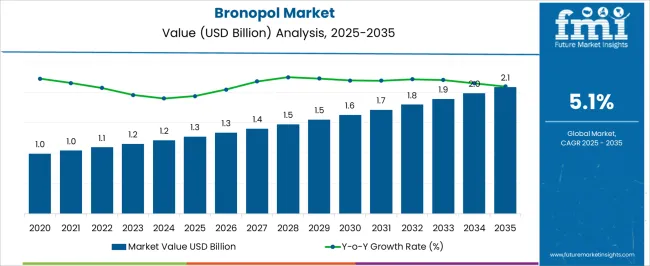
Quick Stats for Bronopol Market

  • Bronopol Market Industry Value (2025): USD 1.3 billion
  • Bronopol Market Forecast Value (2035): USD 2.1 billion
  • Bronopol Market Forecast CAGR: 5.1%
  • Leading Segment in Bronopol Market in 2025: Liquid (55.0%)
  • Key Growth Region in Bronopol Market: North America, Asia-Pacific, Europe
  • Top Key Players in Bronopol Market: BASF, DOW Chemicals, Shanghai Rich Chemicals, Sharon Laboratories, Fujian Shaowu, Gayathri Chemicals, Sai Supreme Chemicals, Mani Agro Chemicals, Ramdev Chemicals, Symbolic Pharma, Weifang Haihua Yuanda Fine Chemicals, BQ Technology (HK) Company, Wuhan Fortuna Chemical

Bronopol Market Market Value Analysis

Metric Value
Bronopol Market Estimated Value in (2025 E) USD 1.3 billion
Bronopol Market Forecast Value in (2035 F) USD 2.1 billion
Forecast CAGR (2025 to 2035) 5.1%

Rationale for Segmental Growth in the Bronopol Market

The Bronopol market is experiencing steady growth driven by increasing demand for effective antimicrobial agents across various industrial applications. The compound's broad-spectrum biocidal properties and stability in aqueous solutions have positioned it as a preferred choice for microbial control, especially in water treatment and personal care sectors.

Growing regulatory emphasis on product safety and environmental compliance has further propelled its adoption, encouraging manufacturers to innovate formulations that enhance efficacy while minimizing toxicity. Future market expansion is expected to be supported by rising industrial water treatment requirements, stricter hygiene standards, and growing awareness of microbial contamination risks.

Technological advancements in formulation and delivery methods alongside strategic collaborations within the chemical industry are enabling more targeted and sustainable use of Bronopol, creating new opportunities for penetration in emerging markets and end use segments.

Segmental Analysis

The market is segmented by Form, Type, and Application and region. By Form, the market is divided into Liquid and Solid. In terms of Type, the market is classified into Biocides and Disinfectants, Coagulants and Flocculants, PH Adjusters and Stabilizers, Inhibitors, Defoaming Agents, and Others. Based on Application, the market is segmented into Water Treatment, Oil and Gas, Paper & Pulp, Paints, Coatings, and Adhesives, Personal Care & Cosmetics, Cleaning Agents, and Others. Regionally, the market is classified into North America, Latin America, Western Europe, Eastern Europe, Balkan & Baltic Countries, Russia & Belarus, Central Asia, East Asia, South Asia & Pacific, and the Middle East & Africa.
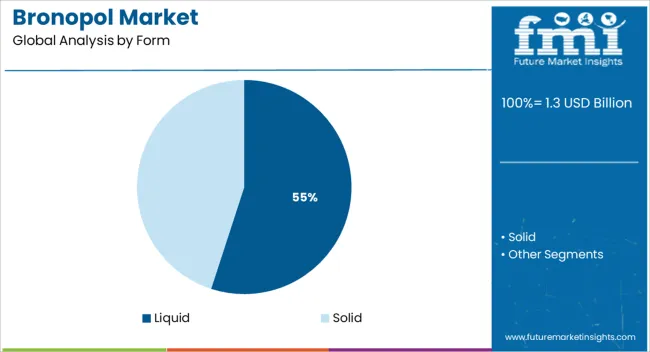
Insights into the Liquid Form Segment

Bronopol Market Analysis By Form

When segmented by form, the liquid segment is anticipated to capture 55.0% of the total market revenue in 2025, establishing it as the leading form. Its dominance is attributed to the ease of handling and uniform dispersion properties offered by liquid formulations, which enable effective microbial control across diverse applications.

The versatility of the liquid form allows for seamless integration into existing treatment systems and manufacturing processes, reducing operational complexity. Additionally, manufacturers benefit from cost efficiencies and reduced processing times when utilizing liquid Bronopol.

The stability and solubility of Bronopol in liquid form enhance its performance, making it the preferred choice for large scale water treatment and biocidal applications. These factors combined have solidified the liquid segment’s leadership in the Bronopol market.
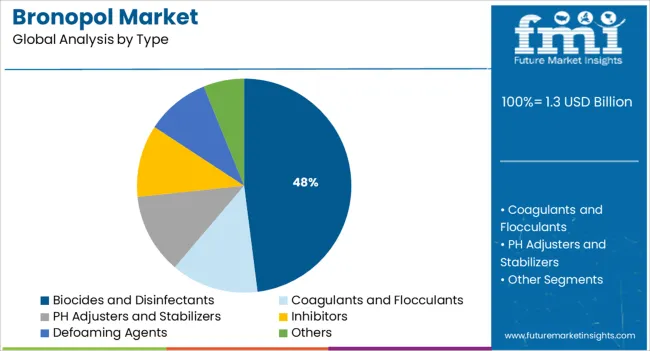
Insights into the Biocides and Disinfectants Type Segment

Bronopol Market Analysis By Type

Segmented by type, biocides and disinfectants account for 48.0% of the market revenue share in 2025, positioning this as the leading type segment. This prominence is driven by the compound’s effectiveness against a broad spectrum of microorganisms, making it a critical component in disinfectant formulations.

Industrial sectors demanding stringent microbial control, such as pharmaceuticals, personal care, and manufacturing, have increasingly adopted Bronopol-based biocides. The segment’s growth is also supported by heightened regulatory focus on product safety and the need for reliable disinfection solutions to prevent contamination.

Enhanced formulation techniques have improved product stability and user safety, encouraging wider acceptance in both industrial and institutional applications. The biocides and disinfectants type segment continues to lead due to its integral role in maintaining hygiene and safety standards across multiple industries.
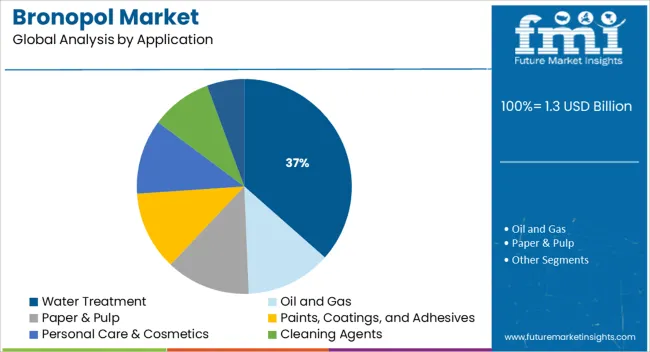
Insights into the Water Treatment Application Segment

Bronopol Market Analysis By Application

In terms of application, the water treatment segment is expected to hold 36.5% of the market revenue in 2025, ranking it as the top application segment. The segment’s leadership has been influenced by increasing industrial and municipal water treatment needs aimed at controlling microbial growth and biofilm formation.

Bronopol’s chemical stability and low toxicity profile make it an effective choice for treating cooling towers, pulp and paper mills, and wastewater systems. Regulatory requirements for safer and more sustainable water treatment chemicals have accelerated the adoption of Bronopol in this sector.

Operational advantages such as ease of dosing, compatibility with other treatment chemicals, and rapid antimicrobial action have further strengthened its position. These factors collectively drive the water treatment segment’s dominance in the Bronopol market.

Historical (2017 to 2021) Vs. Forecast (2025 to 2035) Market Outlook

Over the period of time covered by the study (2020 to 2024), Bronopol is witnessed great interest from researchers and professionals of various disciplines for various high-value applications. The market for Bronopol was recorded to grow at a phenomenal CAGR of 4.3% between 2020 and 2024, mostly due to the rising demand for various applications such as fertilizer, glass manufacturing, fashion jewelry, and others.

Whereas, as per the latest survey conducted by FMI, the Bronopol market is expected to progress at a CAGR of 5.1% between 2025 and 2035. Bronopol is available in solid and liquid forms. As a result, end users are provided with a variety of options to deal with bacterial issues during production.

Major manufacturers usually set up bromine compound production facilities in-house or near third-party bromine production plants to reduce production costs, as transportation and handling costs are minimized, and by-product inorganic bromine can be used for other industrial uses.

Bronopol's suppliers focus on research and development activities to meet the customized requirements of end users to perform various operations. Leading players have been following growth strategies of product innovations, collaborations, and acquisitions to expand their global presence in this market. Given the critical nature of the product's applications, demand is likely to rise steadily over the next few years.

Market Dynamics

Bronopol is proven to be beneficial for the water treatment

The global increase in demand for potable water is a key factor driving the market growth. Bronopol is widely used in several water treatment plants to meet this growing demand as it kills various types of bacteria present in the water and makes it suitable for drinking.

As water is an integral part of industrial and residential activities, it further boosts product demand. In addition, industrial water systems are potential environments for bacterial growth, and bronopol helps prevent contamination from corrosion and slime in industrial water circulation equipment.

In addition, rising water consumption across the globe due to the increasing population has resulted in increased demand for bronopol due to its application in wastewater treatment systems. Increased health awareness among end users regarding pathogens and bacterial growth has increased in recent years, which in turn is expected to positively impact the global demand for bronopol.

Growing Applications of Bronopol in Various Industries

Growing emphasis on improving the production processes and workplace hygiene conditions will be one of the major drivers driving the demand for bronopol in the industrial sector. Moreover, the demand for bronopol in cleaning products is expected to remain high for the treatment of healthcare-associated infections in the healthcare sector.

Paints and coatings applications of bronopol are also expected to present growth opportunities owing to increasing demand for coatings in new construction and building maintenance applications.

In the oil and gas sector, rising hydraulic fracturing techniques used to drill shale gas formations to prevent corrosion and production problems that may be caused by bacterial contamination will support growth.

Despite the increasing use of bronopol in various industries, some concerns about availability and safety are expected to recede in the coming years. The ongoing global economic slowdown is one of the major restraints for the bronopol industry in developed markets such as Europe and North America. Bronopol demand is likely to be impacted by rising raw material prices and complex compliance structures in the coming years.

Category-wise Insights

What is Bronopol Market Outlook by Form?

The solid segment is expected to dominate the global bronopol market in 2025 and is expected to continue this dominance during the forecast period. This is attributed to its use as a microbicide/microbiota in oil field systems, air washer systems, air conditioning/humidifying systems, cooling water systems, papermills, absorbent clays, metal working fluids, printing inks, paints, adhesives, and consumer/institutional products.

What is Bronopol Market Outlook by Type?

The coagulants and flocculants segment is expected to grow rapidly in the global bronopol market over the forecast period owing to increasing demand from water treatment plants to kill bacteria and pathogens from the water.

What is Bronopol Market Outlook by Application?

The growing demand for potable water across the globe is the key factor driving the growth of the market. Bronopol is widely used in different water treatment plants to meet this ever-growing demand as it kills various types of bacteria present in the water and makes it drinkable. Since water forms an indispensable part of industrial and residential activities, it further contributes to the demand for products.

Additionally, industrial water systems are a potential environment for bacterial growth and bronopol helps prevent contamination through corrosion and sludge in industrial water recirculation systems.

Additionally, growing health awareness among consumers regarding diseases caused by waterborne pathogens and bacterial growth is catalyzing the growth of the market. Additionally, growing businesses in the oil and gas industry where bronopol is used to prevent corrosion due to bacterial contamination in hydraulic fracturing equipment are driving demand for the product.
Region-wise insights

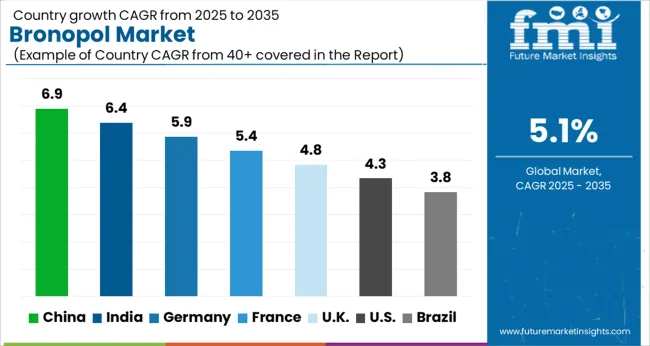
Bronopol Market Cagr Analysis By Country

How is North America faring in the global Bronopol market?

North America is expected to witness moderate growth in the market. This is driven by new product innovations catering to the specific needs of end-user processes, which is expected to positively impact the demand for bronopol in the region.

What are the future prospects for the Bronopol market in the Asia Pacific region?

The market is expected to expand at the fastest rate in the Asia Pacific region owing to the growing coatings industry required by new infrastructure in emerging economies such as India, Vietnam, Thailand, and Indonesia. Rising consumer inclination towards eco-friendly and sustainable products, significant growth of various applications, such as paints and coatings, water treatment, etc., and the increasing presence of Bronopol manufacturing companies along with various government stringent regulations are some of the prominent factors driving the demand for Bronopol in the region.
Competitive Landscape

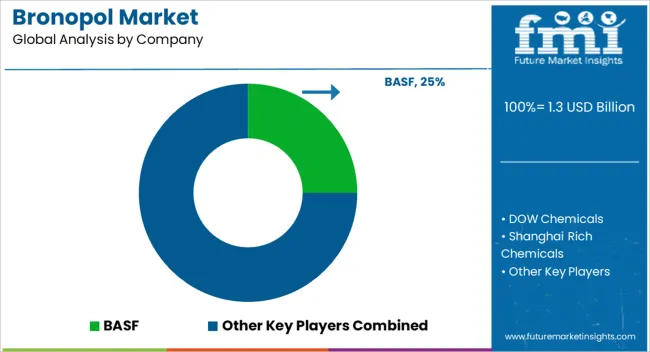
Bronopol Market Analysis By Company

The major Bronopol market players are focusing on expanding their capabilities and resources to meet the growing demand for Bronopol in various applications. Additionally, prominent players are adopting collaboration and joint venture strategies to increase their reach and resources.

Several major players are also launching new products to meet the growing demand for innovative products in various end industries.

Various assessments and findings presented in the study helps identify prevailing opportunities and new areas in key and emerging regions. The study takes a closer look at developments in the manufacturing industry and the important trends that will underpin new applications.

Scope of the Report

Attribute Details
Growth Rate CAGR of 5.1% from 2025 to 2035
Base Year for Estimation 2025
Historical Data 2020 to 2025
Forecast Period 2025 to 2035
Quantitative Units Revenue in USD Billion, Volume in Tons, and CAGR from 2025 to 2035
Report Coverage Revenue Forecast, Volume Forecast, Company Ranking, Competitive Landscape, Growth Factors, Trends, and Pricing Analysis
Segments Covered Form, Type, Application, Region
Regions Covered North America; Latin America; Europe; East Asia; South Asia Pacific; Middle East and Africa (MEA)
Key Countries Covered USA, Canada, Mexico, Brazil, Germany, The UK, France, Italy, Spain, Russia, BENELUX, China, Japan, South Korea, India, ASEAN Countries, Australia, New Zealand, GCC Countries, Turkey, Northern Africa, South Africa
Key Companies Profiled BASF; DOW Chemicals; Shanghai Rich Chemicals; Sharon Laboratories; Fujian Shaowu; Gayathri Chemicals; Sai Supreme Chemicals; Mani Agro Chemicals; Ramdev Chemicals; Symbolic Pharma; Weifang Haihua Yuanda Fine Chemicals; BQ Technology (HK) Company; Wuhan Fortuna Chemical; Mani Agro Chemicals; Other Key Players
Customization & Pricing Available upon Request

Market Segmentation

By Form:

  • Solid
  • Liquid

By Type:

  • Coagulants and Flocculants
  • Biocides and Disinfectants
  • PH Adjusters and Stabilizers
  • Inhibitors
  • Defoaming Agents
  • Others

By Application:

  • Water Treatment
  • Oil and Gas
  • Paper & Pulp
  • Paints, Coatings, and Adhesives
  • Personal Care & Cosmetics
  • Cleaning Agents
  • Others

By Region:

  • North America
  • Latin America
  • Europe
  • South Asia Pacific
  • East Asia
  • Middle East & Africa (MEA)

Table of Content

  1. Executive Summary
    • Global Market Outlook
    • Demand to side Trends
    • Supply to side Trends
    • Technology Roadmap Analysis
    • Analysis and Recommendations
  2. Market Overview
    • Market Coverage / Taxonomy
    • Market Definition / Scope / Limitations
  3. Market Background
    • Market Dynamics
      • Drivers
      • Restraints
      • Opportunity
      • Trends
    • Scenario Forecast
      • Demand in Optimistic Scenario
      • Demand in Likely Scenario
      • Demand in Conservative Scenario
    • Opportunity Map Analysis
    • Product Life Cycle Analysis
    • Supply Chain Analysis
    • Investment Feasibility Matrix
    • Value Chain Analysis
    • PESTLE and Porter’s Analysis
    • Regulatory Landscape
    • Regional Parent Market Outlook
    • Production and Consumption Statistics
    • Import and Export Statistics
  4. Global Market Analysis 2020 to 2024 and Forecast, 2025 to 2035
    • Historical Market Size Value (USD Million) Analysis, 2020 to 2024
    • Current and Future Market Size Value (USD Million) Projections, 2025 to 2035
      • Y to o to Y Growth Trend Analysis
      • Absolute $ Opportunity Analysis
  5. Global Market Pricing Analysis 2020 to 2024 and Forecast 2025 to 2035
  6. Global Market Analysis 2020 to 2024 and Forecast 2025 to 2035, By Product Type
    • Introduction / Key Findings
    • Historical Market Size Value (USD Million) Analysis By Product Type , 2020 to 2024
    • Current and Future Market Size Value (USD Million) Analysis and Forecast By Product Type , 2025 to 2035
      • Skid Steer Loaders
      • Compact Track Loaders
      • Wheeled Compact Loaders
      • Mini Wheel Loaders
      • Others
    • Y to o to Y Growth Trend Analysis By Product Type , 2020 to 2024
    • Absolute $ Opportunity Analysis By Product Type , 2025 to 2035
  7. Global Market Analysis 2020 to 2024 and Forecast 2025 to 2035, By Application
    • Introduction / Key Findings
    • Historical Market Size Value (USD Million) Analysis By Application, 2020 to 2024
    • Current and Future Market Size Value (USD Million) Analysis and Forecast By Application, 2025 to 2035
      • Construction (Building, Infrastructure, Road Construction)
      • Agriculture & Forestry (Dairy Farms, Material Handling, Land Clearing)
      • Utilities (Municipal Services, Waste Management)
      • Landscaping & Groundscare (Professional Landscaping, Golf Courses)
      • Others (Snow Removal, Mining Support, Industrial Facilities)
    • Y to o to Y Growth Trend Analysis By Application, 2020 to 2024
    • Absolute $ Opportunity Analysis By Application, 2025 to 2035
  8. Global Market Analysis 2020 to 2024 and Forecast 2025 to 2035, By Region
    • Introduction
    • Historical Market Size Value (USD Million) Analysis By Region, 2020 to 2024
    • Current Market Size Value (USD Million) Analysis and Forecast By Region, 2025 to 2035
      • North America
      • Latin America
      • Western Europe
      • Eastern Europe
      • East Asia
      • South Asia and Pacific
      • Middle East & Africa
    • Market Attractiveness Analysis By Region
  9. North America Market Analysis 2020 to 2024 and Forecast 2025 to 2035, By Country
    • Historical Market Size Value (USD Million) Trend Analysis By Market Taxonomy, 2020 to 2024
    • Market Size Value (USD Million) Forecast By Market Taxonomy, 2025 to 2035
      • By Country
        • USA
        • Canada
        • Mexico
      • By Product Type
      • By Application
    • Market Attractiveness Analysis
      • By Country
      • By Product Type
      • By Application
    • Key Takeaways
  10. Latin America Market Analysis 2020 to 2024 and Forecast 2025 to 2035, By Country
    • Historical Market Size Value (USD Million) Trend Analysis By Market Taxonomy, 2020 to 2024
    • Market Size Value (USD Million) Forecast By Market Taxonomy, 2025 to 2035
      • By Country
        • Brazil
        • Chile
        • Rest of Latin America
      • By Product Type
      • By Application
    • Market Attractiveness Analysis
      • By Country
      • By Product Type
      • By Application
    • Key Takeaways
  11. Western Europe Market Analysis 2020 to 2024 and Forecast 2025 to 2035, By Country
    • Historical Market Size Value (USD Million) Trend Analysis By Market Taxonomy, 2020 to 2024
    • Market Size Value (USD Million) Forecast By Market Taxonomy, 2025 to 2035
      • By Country
        • Germany
        • UK
        • Italy
        • Spain
        • France
        • Nordic
        • BENELUX
        • Rest of Western Europe
      • By Product Type
      • By Application
    • Market Attractiveness Analysis
      • By Country
      • By Product Type
      • By Application
    • Key Takeaways
  12. Eastern Europe Market Analysis 2020 to 2024 and Forecast 2025 to 2035, By Country
    • Historical Market Size Value (USD Million) Trend Analysis By Market Taxonomy, 2020 to 2024
    • Market Size Value (USD Million) Forecast By Market Taxonomy, 2025 to 2035
      • By Country
        • Russia
        • Poland
        • Hungary
        • Balkan & Baltic
        • Rest of Eastern Europe
      • By Product Type
      • By Application
    • Market Attractiveness Analysis
      • By Country
      • By Product Type
      • By Application
    • Key Takeaways
  13. East Asia Market Analysis 2020 to 2024 and Forecast 2025 to 2035, By Country
    • Historical Market Size Value (USD Million) Trend Analysis By Market Taxonomy, 2020 to 2024
    • Market Size Value (USD Million) Forecast By Market Taxonomy, 2025 to 2035
      • By Country
        • China
        • Japan
        • South Korea
      • By Product Type
      • By Application
    • Market Attractiveness Analysis
      • By Country
      • By Product Type
      • By Application
    • Key Takeaways
  14. South Asia and Pacific Market Analysis 2020 to 2024 and Forecast 2025 to 2035, By Country
    • Historical Market Size Value (USD Million) Trend Analysis By Market Taxonomy, 2020 to 2024
    • Market Size Value (USD Million) Forecast By Market Taxonomy, 2025 to 2035
      • By Country
        • India
        • ASEAN
        • Australia & New Zealand
        • Rest of South Asia and Pacific
      • By Product Type
      • By Application
    • Market Attractiveness Analysis
      • By Country
      • By Product Type
      • By Application
    • Key Takeaways
  15. Middle East & Africa Market Analysis 2020 to 2024 and Forecast 2025 to 2035, By Country
    • Historical Market Size Value (USD Million) Trend Analysis By Market Taxonomy, 2020 to 2024
    • Market Size Value (USD Million) Forecast By Market Taxonomy, 2025 to 2035
      • By Country
        • Kingdom of Saudi Arabia
        • Other GCC Countries
        • Turkiye
        • South Africa
        • Other African Union
        • Rest of Middle East & Africa
      • By Product Type
      • By Application
    • Market Attractiveness Analysis
      • By Country
      • By Product Type
      • By Application
    • Key Takeaways
  16. Key Countries Market Analysis
    • USA
      • Pricing Analysis
      • Market Share Analysis, 2024
        • By Product Type
        • By Application
    • Canada
      • Pricing Analysis
      • Market Share Analysis, 2024
        • By Product Type
        • By Application
    • Mexico
      • Pricing Analysis
      • Market Share Analysis, 2024
        • By Product Type
        • By Application
    • Brazil
      • Pricing Analysis
      • Market Share Analysis, 2024
        • By Product Type
        • By Application
    • Chile
      • Pricing Analysis
      • Market Share Analysis, 2024
        • By Product Type
        • By Application
    • Germany
      • Pricing Analysis
      • Market Share Analysis, 2024
        • By Product Type
        • By Application
    • UK
      • Pricing Analysis
      • Market Share Analysis, 2024
        • By Product Type
        • By Application
    • Italy
      • Pricing Analysis
      • Market Share Analysis, 2024
        • By Product Type
        • By Application
    • Spain
      • Pricing Analysis
      • Market Share Analysis, 2024
        • By Product Type
        • By Application
    • France
      • Pricing Analysis
      • Market Share Analysis, 2024
        • By Product Type
        • By Application
    • India
      • Pricing Analysis
      • Market Share Analysis, 2024
        • By Product Type
        • By Application
    • ASEAN
      • Pricing Analysis
      • Market Share Analysis, 2024
        • By Product Type
        • By Application
    • Australia & New Zealand
      • Pricing Analysis
      • Market Share Analysis, 2024
        • By Product Type
        • By Application
    • China
      • Pricing Analysis
      • Market Share Analysis, 2024
        • By Product Type
        • By Application
    • Japan
      • Pricing Analysis
      • Market Share Analysis, 2024
        • By Product Type
        • By Application
    • South Korea
      • Pricing Analysis
      • Market Share Analysis, 2024
        • By Product Type
        • By Application
    • Russia
      • Pricing Analysis
      • Market Share Analysis, 2024
        • By Product Type
        • By Application
    • Poland
      • Pricing Analysis
      • Market Share Analysis, 2024
        • By Product Type
        • By Application
    • Hungary
      • Pricing Analysis
      • Market Share Analysis, 2024
        • By Product Type
        • By Application
    • Kingdom of Saudi Arabia
      • Pricing Analysis
      • Market Share Analysis, 2024
        • By Product Type
        • By Application
    • Turkiye
      • Pricing Analysis
      • Market Share Analysis, 2024
        • By Product Type
        • By Application
    • South Africa
      • Pricing Analysis
      • Market Share Analysis, 2024
        • By Product Type
        • By Application
  17. Market Structure Analysis
    • Competition Dashboard
    • Competition Benchmarking
    • Market Share Analysis of Top Players
      • By Regional
      • By Product Type
      • By Application
  18. Competition Analysis
    • Competition Deep Dive
      • Caterpillar Inc.
        • Overview
        • Product Portfolio
        • Profitability by Market Segments (Product/Age /Sales Channel/Region)
        • Sales Footprint
        • Strategy Overview
          • Marketing Strategy
          • Product Strategy
          • Channel Strategy
      • Deere & Company
      • CNH Industrial N.V.
      • Kubota Corporation
      • Wacker Neuson SE
      • Bobcat Company (Doosan)
      • JCB
      • Volvo Construction Equipment
      • Komatsu Ltd.
      • Liebherr Group
      • Takeuchi Manufacturing
      • ASV Holdings Inc.
  19. Assumptions & Acronyms Used
  20. Research Methodology

List of Tables

  • Table 1: Global Market Value (USD Million) Forecast by Region, 2020 to 2035
  • Table 2: Global Market Value (USD Million) Forecast by Product Type , 2020 to 2035
  • Table 3: Global Market Value (USD Million) Forecast by Application, 2020 to 2035
  • Table 4: North America Market Value (USD Million) Forecast by Country, 2020 to 2035
  • Table 5: North America Market Value (USD Million) Forecast by Product Type , 2020 to 2035
  • Table 6: North America Market Value (USD Million) Forecast by Application, 2020 to 2035
  • Table 7: Latin America Market Value (USD Million) Forecast by Country, 2020 to 2035
  • Table 8: Latin America Market Value (USD Million) Forecast by Product Type , 2020 to 2035
  • Table 9: Latin America Market Value (USD Million) Forecast by Application, 2020 to 2035
  • Table 10: Western Europe Market Value (USD Million) Forecast by Country, 2020 to 2035
  • Table 11: Western Europe Market Value (USD Million) Forecast by Product Type , 2020 to 2035
  • Table 12: Western Europe Market Value (USD Million) Forecast by Application, 2020 to 2035
  • Table 13: Eastern Europe Market Value (USD Million) Forecast by Country, 2020 to 2035
  • Table 14: Eastern Europe Market Value (USD Million) Forecast by Product Type , 2020 to 2035
  • Table 15: Eastern Europe Market Value (USD Million) Forecast by Application, 2020 to 2035
  • Table 16: East Asia Market Value (USD Million) Forecast by Country, 2020 to 2035
  • Table 17: East Asia Market Value (USD Million) Forecast by Product Type , 2020 to 2035
  • Table 18: East Asia Market Value (USD Million) Forecast by Application, 2020 to 2035
  • Table 19: South Asia and Pacific Market Value (USD Million) Forecast by Country, 2020 to 2035
  • Table 20: South Asia and Pacific Market Value (USD Million) Forecast by Product Type , 2020 to 2035
  • Table 21: South Asia and Pacific Market Value (USD Million) Forecast by Application, 2020 to 2035
  • Table 22: Middle East & Africa Market Value (USD Million) Forecast by Country, 2020 to 2035
  • Table 23: Middle East & Africa Market Value (USD Million) Forecast by Product Type , 2020 to 2035
  • Table 24: Middle East & Africa Market Value (USD Million) Forecast by Application, 2020 to 2035

List of Figures

  • Figure 1: Global Market Pricing Analysis
  • Figure 2: Global Market Value (USD Million) Forecast 2020-2035
  • Figure 3: Global Market Value Share and BPS Analysis by Product Type , 2025 and 2035
  • Figure 4: Global Market Y to o to Y Growth Comparison by Product Type , 2025-2035
  • Figure 5: Global Market Attractiveness Analysis by Product Type
  • Figure 6: Global Market Value Share and BPS Analysis by Application, 2025 and 2035
  • Figure 7: Global Market Y to o to Y Growth Comparison by Application, 2025-2035
  • Figure 8: Global Market Attractiveness Analysis by Application
  • Figure 9: Global Market Value (USD Million) Share and BPS Analysis by Region, 2025 and 2035
  • Figure 10: Global Market Y to o to Y Growth Comparison by Region, 2025-2035
  • Figure 11: Global Market Attractiveness Analysis by Region
  • Figure 12: North America Market Incremental Dollar Opportunity, 2025-2035
  • Figure 13: Latin America Market Incremental Dollar Opportunity, 2025-2035
  • Figure 14: Western Europe Market Incremental Dollar Opportunity, 2025-2035
  • Figure 15: Eastern Europe Market Incremental Dollar Opportunity, 2025-2035
  • Figure 16: East Asia Market Incremental Dollar Opportunity, 2025-2035
  • Figure 17: South Asia and Pacific Market Incremental Dollar Opportunity, 2025-2035
  • Figure 18: Middle East & Africa Market Incremental Dollar Opportunity, 2025-2035
  • Figure 19: North America Market Value Share and BPS Analysis by Country, 2025 and 2035
  • Figure 20: North America Market Value Share and BPS Analysis by Product Type , 2025 and 2035
  • Figure 21: North America Market Y to o to Y Growth Comparison by Product Type , 2025-2035
  • Figure 22: North America Market Attractiveness Analysis by Product Type
  • Figure 23: North America Market Value Share and BPS Analysis by Application, 2025 and 2035
  • Figure 24: North America Market Y to o to Y Growth Comparison by Application, 2025-2035
  • Figure 25: North America Market Attractiveness Analysis by Application
  • Figure 26: Latin America Market Value Share and BPS Analysis by Country, 2025 and 2035
  • Figure 27: Latin America Market Value Share and BPS Analysis by Product Type , 2025 and 2035
  • Figure 28: Latin America Market Y to o to Y Growth Comparison by Product Type , 2025-2035
  • Figure 29: Latin America Market Attractiveness Analysis by Product Type
  • Figure 30: Latin America Market Value Share and BPS Analysis by Application, 2025 and 2035
  • Figure 31: Latin America Market Y to o to Y Growth Comparison by Application, 2025-2035
  • Figure 32: Latin America Market Attractiveness Analysis by Application
  • Figure 33: Western Europe Market Value Share and BPS Analysis by Country, 2025 and 2035
  • Figure 34: Western Europe Market Value Share and BPS Analysis by Product Type , 2025 and 2035
  • Figure 35: Western Europe Market Y to o to Y Growth Comparison by Product Type , 2025-2035
  • Figure 36: Western Europe Market Attractiveness Analysis by Product Type
  • Figure 37: Western Europe Market Value Share and BPS Analysis by Application, 2025 and 2035
  • Figure 38: Western Europe Market Y to o to Y Growth Comparison by Application, 2025-2035
  • Figure 39: Western Europe Market Attractiveness Analysis by Application
  • Figure 40: Eastern Europe Market Value Share and BPS Analysis by Country, 2025 and 2035
  • Figure 41: Eastern Europe Market Value Share and BPS Analysis by Product Type , 2025 and 2035
  • Figure 42: Eastern Europe Market Y to o to Y Growth Comparison by Product Type , 2025-2035
  • Figure 43: Eastern Europe Market Attractiveness Analysis by Product Type
  • Figure 44: Eastern Europe Market Value Share and BPS Analysis by Application, 2025 and 2035
  • Figure 45: Eastern Europe Market Y to o to Y Growth Comparison by Application, 2025-2035
  • Figure 46: Eastern Europe Market Attractiveness Analysis by Application
  • Figure 47: East Asia Market Value Share and BPS Analysis by Country, 2025 and 2035
  • Figure 48: East Asia Market Value Share and BPS Analysis by Product Type , 2025 and 2035
  • Figure 49: East Asia Market Y to o to Y Growth Comparison by Product Type , 2025-2035
  • Figure 50: East Asia Market Attractiveness Analysis by Product Type
  • Figure 51: East Asia Market Value Share and BPS Analysis by Application, 2025 and 2035
  • Figure 52: East Asia Market Y to o to Y Growth Comparison by Application, 2025-2035
  • Figure 53: East Asia Market Attractiveness Analysis by Application
  • Figure 54: South Asia and Pacific Market Value Share and BPS Analysis by Country, 2025 and 2035
  • Figure 55: South Asia and Pacific Market Value Share and BPS Analysis by Product Type , 2025 and 2035
  • Figure 56: South Asia and Pacific Market Y to o to Y Growth Comparison by Product Type , 2025-2035
  • Figure 57: South Asia and Pacific Market Attractiveness Analysis by Product Type
  • Figure 58: South Asia and Pacific Market Value Share and BPS Analysis by Application, 2025 and 2035
  • Figure 59: South Asia and Pacific Market Y to o to Y Growth Comparison by Application, 2025-2035
  • Figure 60: South Asia and Pacific Market Attractiveness Analysis by Application
  • Figure 61: Middle East & Africa Market Value Share and BPS Analysis by Country, 2025 and 2035
  • Figure 62: Middle East & Africa Market Value Share and BPS Analysis by Product Type , 2025 and 2035
  • Figure 63: Middle East & Africa Market Y to o to Y Growth Comparison by Product Type , 2025-2035
  • Figure 64: Middle East & Africa Market Attractiveness Analysis by Product Type
  • Figure 65: Middle East & Africa Market Value Share and BPS Analysis by Application, 2025 and 2035
  • Figure 66: Middle East & Africa Market Y to o to Y Growth Comparison by Application, 2025-2035
  • Figure 67: Middle East & Africa Market Attractiveness Analysis by Application
  • Figure 68: Global Market - Tier Structure Analysis
  • Figure 69: Global Market - Company Share Analysis

Frequently Asked Questions

How big is the bronopol market in 2025?

The global bronopol market is estimated to be valued at USD 1.3 billion in 2025.

What will be the size of bronopol market in 2035?

The market size for the bronopol market is projected to reach USD 2.1 billion by 2035.

How much will be the bronopol market growth between 2025 and 2035?

The bronopol market is expected to grow at a 5.1% CAGR between 2025 and 2035.

What are the key product types in the bronopol market?

The key product types in bronopol market are liquid and solid.

Which type segment to contribute significant share in the bronopol market in 2025?

In terms of type, biocides and disinfectants segment to command 48.0% share in the bronopol market in 2025.

Future Market Insights

Bronopol Market

Chat With MaRIA

Chat With

MaRIA

Hi There, I am MaRIA, Your Market Research Intelligence Assistant. How may I help you?