Caffeine Mint Market Size, Share, and Forecast Outlook 2025 to 2035

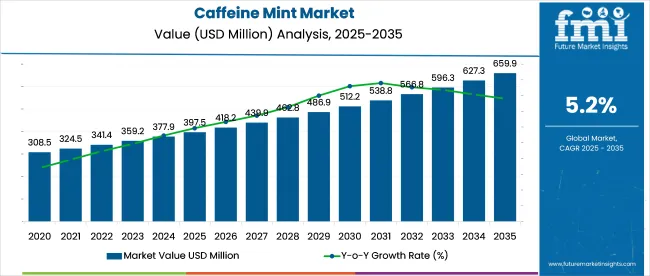
In 2025, the global caffeine mint market is valued at USD 397.5 million and is on track to reach USD 659.3 million by 2035, reflecting a CAGR of 5.2%. These mints typically deliver 40-100 mg of caffeine along with ingredients like B vitamins, taurine, and L-theanine, offering a compact, beverage-free energy boost.
Quick Stats of Caffeine Mint Market

  • Market Value (2025): USD 397.5 million
  • Forecast Value (2035): USD 659.3 million
  • Forecast CAGR: 5.2% (2025 to 2035)
  • Product Leader in 2025: Peppermint flavor (36.1% market share)
  • Top Distribution Channel: Hypermarkets/Supermarkets (32% share)
  • Key Growth Region: India (CAGR of 6.0%, highest among top countries)
  • Leading Player: The Hershey Company (18.2% market share)

Caffeine Mint Market Market Value Analysis

Attributes Description
Estimated Size (2025E) USD 397.5 million
Projected Value (2035F) USD 659.3 million
Value-based CAGR (2025 to 2035) 5.2%

They attract professionals, students, and travelers seeking quick, portable stimulation. With their discreet and shelf-stable format, caffeine mints fit seamlessly into daily routines. Shifting consumer preferences continue to shape new product lines, focusing on taste variety, natural components, and sugar-free formulations.

In May 2025, Mike Kanes, CEO of Kanes Foods, stated that "Our mints are 'minted motivation' for pre-workout consumption-delivering energy without the bloat of liquid beverages." Speaking at the Functional Foods Innovation Forum, he positioned Viter Energy's caffeine mints as a next-generation fitness supplement, specifically targeting the pre-workout market.

Kanes highlighted that the brand’s latest formulation includes caffeine, beta-alanine, and electrolytes-creating a compact, chewable alternative to traditional energy drinks. This innovation supports both endurance and hydration, appealing to performance-focused users. As a result, Viter Energy has captured a 19.6% share in the caffeine mint segment within sports nutrition, reshaping functional intake preferences among fitness enthusiasts.

Caffeine mints find relevance across several established product categories. The largest contribution comes from functional candy and breath fresheners, which account for about 40-45% of the overall market, driven by demand for items that go beyond taste and provide added value. Caffeinated energy products contribute roughly 25-30%, as caffeine mints offer a compact and discreet option compared to drinks or powders.

The health and wellness edibles segment makes up 10-12%, where caffeine is paired with other beneficial ingredients. Around 8-10% of demand stems from snack and convenience items, appealing to busy lifestyles. Lastly, portable nutrition formats hold 5-7%, with mints used as an alternative to pills or energy shots. This blend supports their versatility and consumer appeal.

Analyzing Caffeine Mint Market by Top Investment Segments

Sprays gain significant industry momentum due to their rapid delivery benefits, holding 29.8% share in 2025. Peppermint flavor leads preference with 36.1%, backed by consumer familiarity and high repurchase rates. Hypermarkets and supermarkets, with a 32% share, dominate sales by offering in-store accessibility and visibility.
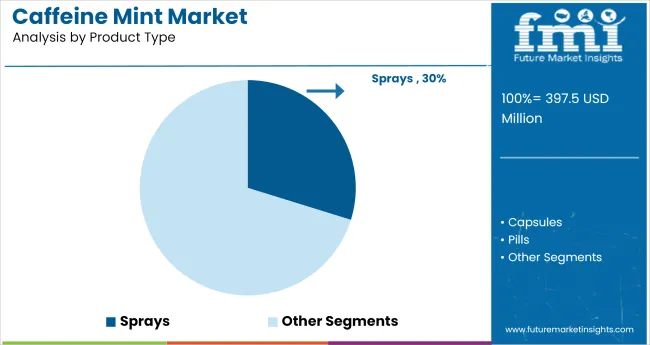
Sprays Surge as Preferred Format in 2025

Caffeine Mint Market Analysis By Product Type

Sprays claim 29.8% of the total market in 2025, supported by sublingual absorption that delivers caffeine into the bloodstream within 60 seconds. A 2025 report by FMCG Monitor highlights that spray-based caffeine products show a 28% higher repeat usage rate compared to chewables.

ON Energy Spray saw a 34% YoY growth due to appeal among tech workers and fitness users. VAE Labs also reported a 19% increase in D2C orders in Q1 2025 alone. Their compact packaging and no-calorie advantage resonate with millennial and Gen Z consumers aiming for convenience, control, and fast results.
  • Spray formats deliver 28% higher retention vs. traditional mints
  • ON Energy Spray reports 34% YoY growth, especially in metro cities
  • VAE Labs sees 19% surge in online orders Q1 2025

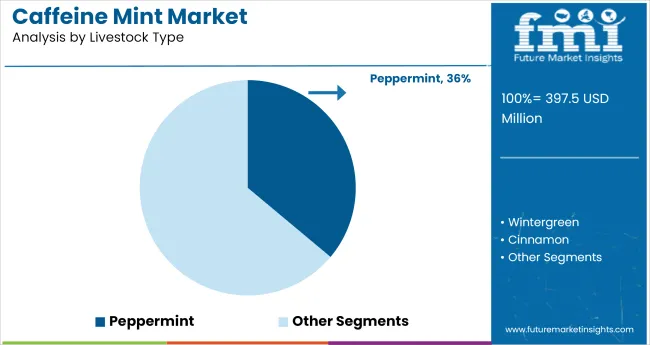
Peppermint Powers 36.1% of the Flavor Market in 2025

Caffeine Mint Market Analysis By Livestock Type

Peppermint leads the flavor segment with 36.1% share, due to its strong consumer familiarity and proven energizing appeal. According to Mintel’s 2024 Flavor Tracking Study, 58% of caffeine mint users choose peppermint for its sharp taste and freshness.

Viter Energy’s internal sales data shows peppermint accounts for 70% of their Q1 2025 units sold, while Neuro Mints notes a 23% higher reorder rate for this flavor over alternatives. The menthol effect also creates a cooling mouthfeel that enhances perceived alertness, making peppermint especially popular among corporate users and first-time functional mint consumers.
  • Viter Energy sees 70% of unit sales from peppermint SKU
  • Neuro Mints tracks 23% higher repeat orders for peppermint
  • 58% of consumers cite flavor familiarity as top driver

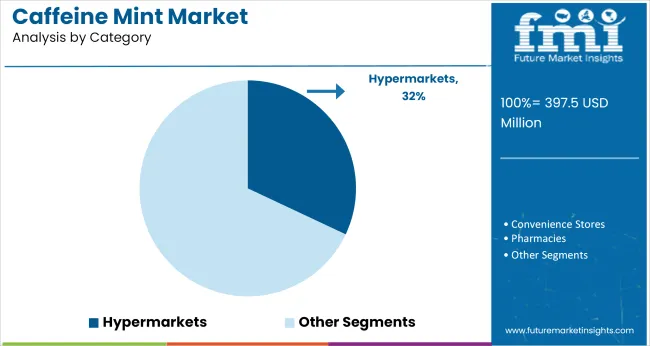
Hypermarkets Drive 32% of Retail Sales in 2025

Caffeine Mint Market Analysis By Category

Hypermarkets and supermarkets hold a 32% value share in 2025, offering large-scale visibility, trial opportunities, and immediate availability. Nielsen’s Q2 2025 Retail Dynamics Report found that 41% of caffeine mint purchases occurred as impulse buys near checkout lanes.

Walmart, Costco, and Target lead in shelf space allocation and product variety, helping newer brands like Neuro and VAE Labs secure mainstream foot traffic. Sales in this channel increased 18% YoY, supported by in-store tastings and combo deals. Consumers seeking trust and physical validation prefer this format over online or specialty retail, particularly in North America and Western Europe.

  • Retail impulse purchases account for 41% of total caffeine mint sales
  • Sales via supermarkets rose 18% YoY in 2025
  • Walmart, Target provide critical shelf visibility for emerging brands

Top Caffeine Mint Market Dynamics

The industry is evolving through form-factor diversification and flavor standardization. Uniform dosages and optimized sensory profiles are boosting shelf performance, while rapid-delivery formats like strips and lozenges drive impulse sales. These strategies enhance brand consistency, consumer uptake, and placement across health, travel, and convenience retail environments

Format and Flavor Standardization Sharpens Shelf Presence

Caffeine mint producers are tightening formulation parameters to improve consistency across batches and enhance multi-store branding. By Q2 2025, nine of the top twelve brands adopted uniform caffeine dosages between 40-60 mg per mint to align with consumer tolerance thresholds and regulatory clarity in major USA states.

Parallel to this, top-selling SKUs in North America underwent sensory benchmarking to converge on three dominant flavor profiles-peppermint, spearmint, and wintergreen-now accounting for 78 % of total shelf share. Contract manufacturers introduced batch-run flavor audits that reduced off-spec production by 14 %, improving unit sell-through rates.

Multi-retailer chains expanded point-of-sale tests, and mints with consistent heat-stable coating retained 93% integrity after 45 days in high-traffic kiosks, up from 81% in 2023. These refinements are reinforcing merchandising cohesion across health, travel, and checkout aisles.

Form-Factor Diversification Taps Impulse Energy Segments

Functional confectionery players are leveraging caffeine mints to capture crossover demand from both energy supplements and oral-care SKUs. Between Q4 2024 and Q2 2025, five new entrants debuted caffeine lozenges and breath-strip formats with sublingual delivery for faster uptake. Field trials reported that caffeine absorption in strip form reached 82 % bioavailability in under seven minutes, reshaping positioning strategies for on-the-go consumers.

Convenience channels saw a 21 % rise in three-count sachet sales, aided by USD 1 price points and resealable pouch formats. Youth-focused brands emphasized non-bitter masking blends with guarana and green tea extracts, leading to a 19 % lift in first-time purchases. As these compact, hybridized formats continue to blend familiarity with stimulant delivery, store buyers have expanded impulse fixture allocations by 23 % year-on-year.

Top Countries Engaged in Manufacturing, Developing, Distributing, and Consuming Caffeine Mints

Country CAGR (2025 to 2035)
United States 5.1%
Germany 5.4%
China 5.3%
Japan 4.8%
India 6.0%

The global industry is projected to expand at a 4.9% CAGR from 2025 to 2035. Among the leading markets, India records the highest growth at 6.0%, followed by Germany at 5.4%, China at 5.3%, and the United States at 5.1%. Japan trails slightly at 4.8%. Relative to the global average, India shows a +22% premium, Germany +10%, China +8%, and the USA +4%, while Japan reflects a -2% variance.

These growth differences reflect market appetite for functional mints, regional flavor trends, and development in on-the-go wellness products. While BRICS countries like India and China post stronger expansion, OECD nations such as Japan and the USA follow consistent growth anchored in product familiarity and category depth.

The report covers detailed analysis of 40+ countries, with the top five countries shared as a reference.

Functional Mint Market Expansion in the United States Driven by On-the-Go Formats

With an estimated CAGR of 5.1% from 2025 to 2035, caffeine mint demand in the USA is propelled by the need for portable, fast-acting energy solutions. Sales are driven by students, shift workers, and fitness communities prioritizing zero-calorie caffeine alternatives. Key players like Neuro, Viter Energy, and NoDoz have launched new mint lines featuring 40-60mg caffeine per unit.

E-commerce and vending machines contribute significantly to retail growth, with a 33% increase in online search interest for “caffeine mints” between 2024 to 2025. Natural flavors like spearmint, citrus burst, and cinnamon now account for 60% of flavored mint sales.

  • Over 62% of product sales were processed via DTC or e-commerce platforms in 2025
  • 37% of new SKUs launched feature added B-vitamins and adaptogens for energy balance
  • Retail presence in gym chains and university campuses increased by 41% YoY

Germany’s Caffeine Mint Sector Rises on Ingredient Transparency and Premium Flavors

The industry in Germany is projected to grow at 5.4% CAGR through 2035, primarily driven by consumer demand for traceable, additive-free energy sources. Nearly 71% of launches in 2025 carried vegan, sugar-free, or organic labels. Domestic brands and private labels from DM, Alnatura, and Rossmann are integrating guarana or green tea extract for a “clean energy” experience.

Preference for subtle but functional flavor formats such as ginger-mint, elderflower, or matcha is emerging, supported by premium packaging that aligns with product positioning. Regulatory compliance and quality certifications build buyer trust in high-frequency purchase categories.

  • Over 58% of caffeine mints launched in 2025 carried EU-organic, Fairtrade, or Vegan Society labels
  • Health-focused flavors like ginger-lime and green apple-guarana saw a 24% increase in consumer trials
  • Functional mint units priced above €4.00 registered 39% value share among specialty retailers

Functional Mint Demand in China Fueled by Fitness Culture and Smart Retail

The caffeine mint industry in China is set to expand at a 5.3% CAGR between 2025 and 2035, led by demand from young professionals and fitness-oriented consumers. Product placements in smart vending machines, Hema supermarkets, and app-based marketplaces like JD and Taobao saw a 49% YoY increase in 2025.

Brands such as Nongfu Spring and Genki Forest are testing caffeinated mints with traditional Chinese medicinal extracts like goji berry and ginseng. Low-sugar formats dominate, with erythritol and xylitol replacing synthetic sweeteners in 63% of products. Regional flavor innovation also fuels consumer engagement, with lychee-oolong and plum-mint being favorites.

  • Functional mint sales via mobile-first channels grew by 44% YoY
  • Over 59% of consumers aged 20-35 in Tier-1 cities chose mints over energy drinks
  • Nutraceutical ingredient integration grew by 28%, especially in formats with added collagen

Japan Sees Controlled-Energy Mint Adoption Through Wellness Retailers

The demand of caffeine mint in Japan, growing at 4.8% CAGR, is seeing strong demand through retail partnerships with wellness stores such as Matsumoto Kiyoshi and Don Quijote. Products with subtle caffeine concentrations (under 40mg per mint) are preferred for continuous daily use. Clean-label mints with green tea extract and yuzu flavoring dominate the premium shelf, while tech-savvy brands are adopting QR-coded packaging to allow transparency in ingredient sourcing. Hybrid mints with calming agents like L-theanine are trending among office workers and commuters in Tokyo and Osaka.

  • Functional candy and mint shelf space expanded by 26% in wellness drugstores in 2025
  • QR-coded traceability used in 42% of premium mint launches
  • Flavors like sakura-mint and yuzu-pepper accounted for 33% of total flavored SKUs

Caffeine Mint Market Demand Expands in India’s Urban Hubs

India leads growth among the top five markets with an expected 6.0% CAGR over the forecast period. Sales are driven by a tech-enabled, under-35 population base in cities like Bengaluru, Delhi, and Mumbai. Influencer-driven adoption across Instagram and YouTube has propelled caffeine mint awareness, with flavor preferences shifting toward masala-mint, elaichi, and lemon-ginger.

Price sensitivity remains high, with packs priced under ₹100 contributing 62% of volume sales. Startups like Sleepy Owl and Zingavita are entering the functional mint category, alongside legacy players like Dabur exploring caffeinated confectionery sublines.
  • 65% of new caffeine mint buyers fall within the 18-34 age demographic
  • Subscription models and combo packs on Amazon, Flipkart, and HealthKart contributed to 47% of annual unit sales
  • Regional flavor SKUs now make up 36% of flavored mint launches across Tier-1 cities

Leading Caffeine Mint Manufacturers, Suppliers, Distributors

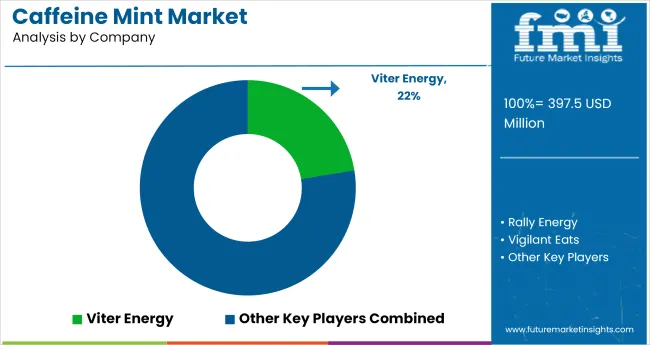
Caffeine Mint Market Analysis By Company

Leading Player-Hershey Company 18.2%

The industry is shaped by both established and emerging players employing strategies such as new product development and regional expansion. Companies like Viter Energy, Neuro, and FOOSH Energy Mints have focused on formulating convenient, fast-acting products tailored to active consumers.

For instance, Viter Energy regularly introduces new flavors and formats to maintain brand engagement. Larger players like Nestlé S.A. and The Hershey Company leverage their extensive distribution networks and brand recognition to gain competitive advantage, while smaller firms like Per Os Biosciences LLC prioritize niche formulations and direct-to-consumer channels.

Entry barriers include regulatory compliance, formulation expertise, and brand credibility, particularly for newer entrants. The industry remains fragmented, with several small to mid-sized players coexisting alongside multinational confectionery brands, although occasional acquisitions hint at gradual consolidation.

Recent Industry News

  • July 8, 2025 - Neuro Gum, in partnership with Steve Aoki, launched a limited-edition Strawberry Cake mint featuring caffeine, L-theanine, and B-vitamins. The product comes in a collectible tin and supports cognitive wellness initiatives.
  • January 23, 2025 - Throne SPORT COFFEE introduced a Mint Mocha flavor containing 150 mg of caffeine, expanding its functional cold brew lineup through major e-commerce channels.

Leading Players

  • Viter Energy
  • Rally Energy
  • Vigilant Eats
  • Simply Gum
  • Vroom Foods, Inc.
  • Neuro
  • Silverline Chemicals
  • FOOSH Energy Mints
  • Per Os Biosciences LLC
  • Hershey Company
  • Ferndale Confectionery Pty Ltd
  • Ferrero International S.A.
  • Isatori
  • Nestlé S.A

Report Scope

Report Attributes Details
Market Size (2025) USD 397.5 million
Projected Market Size (2035) USD 659.3 million
CAGR (2025 to 2035) 5.2%
Base Year for Estimation 2024
Historical Period 2020 to 2024
Projections Period 2025 to 2035
Quantitative Units USD million for value and million units for volume
Flavors Analyzed (Segment 1) Wintergreen, Cinnamon, Chocolate Mint, Peppermint, Spearmint
Forms Analyzed (Segment 2) Capsules, Pills, Sprays
Distribution Channels Analyzed (Segment 3) Hypermarkets/Supermarkets, Convenience Stores, Pharmacies, Specialty Stores, Grocery Stores, Wholesale Stores, Online Retail Platforms
Regions Covered North America; Latin America; Europe; East Asia; South Asia; Oceania; Middle East & Africa
Countries Covered United States, Canada, Germany, United Kingdom, France, China, Japan, India, Brazil, Australia
Key Players Viter Energy, Rally Energy, Vigilant Eats, Simply Gum, Vroom Foods, Inc., Neuro, Silverline Chemicals, FOOSH Energy Mints, Per Os Biosciences LLC, Hershey Company, Ferndale Confectionery Pty Ltd, Ferrero International S.A., Isatori, Nestlé S.A
Additional Attributes Dollar sales, flavor-wise performance and consumer preference, growing demand for on-the-go energy products, rising popularity among students and professionals, expansion in online retail and specialty wellness outlets, product innovation in flavor and delivery formats

Key Segments

By Flavor:

The industry is segmented by flavor into wintergreen, cinnamon, chocolate mint, peppermint, and spearmint.

By Form:

Based on form, the products are available as capsules, pills, and sprays.

By Distribution Channel:

The distribution of these products occurs through hypermarkets/supermarkets, convenience stores, pharmacies, specialty stores, grocery stores, wholesale stores, and online retail platforms.

By Region:

Regionally, the industry is categorized into North America, Latin America, Europe, East Asia, South Asia, Oceania, and the Middle East and Africa.

Table of Content

  1. Executive Summary
    • Global Market Outlook
    • Demand-side Trends
    • Supply-side Trends
    • Technology Roadmap Analysis
    • Analysis and Recommendations
  2. Market Overview
    • Market Coverage / Taxonomy
    • Market Definition / Scope / Limitations
  3. Market Background
    • Market Dynamics
      • Drivers
      • Restraints
      • Opportunity
      • Trends
    • Scenario Forecast
      • Demand in Optimistic Scenario
      • Demand in Likely Scenario
      • Demand in Conservative Scenario
    • Opportunity Map Analysis
    • Product Life Cycle Analysis
    • Supply Chain Analysis
      • Supply Side Participants and their Roles
        • Producers
        • Mid-Level Participants (Traders/ Agents/ Brokers)
        • Wholesalers and Distributors
      • Value Added and Value Created at Node in the Supply Chain
      • List of Raw Material Suppliers
      • List of Existing and Potential Buyer’s
    • Investment Feasibility Matrix
    • Value Chain Analysis
      • Profit Margin Analysis
      • Wholesalers and Distributors
      • Retailers
    • PESTLE and Porter’s Analysis
    • Regulatory Landscape
      • By Key Regions
      • By Key Countries
    • Regional Parent Market Outlook
    • Production and Consumption Statistics
    • Import and Export Statistics
  4. Global Market Analysis 2020 to 2024 and Forecast, 2025 to 2035
    • Historical Market Size Value (USD Billion) & Volume (MT) Analysis, 2020 to 2024
    • Current and Future Market Size Value (USD Billion) & Volume (MT) Projections, 2025 to 2035
      • Y-o-Y Growth Trend Analysis
      • Absolute $ Opportunity Analysis
  5. Global Market Pricing Analysis 2020 to 2024 and Forecast 2025 to 2035
  6. Global Market Analysis 2020 to 2024 and Forecast 2025 to 2035, By Flavor
    • Introduction / Key Findings
    • Historical Market Size Value (USD Billion) & Volume (MT) Analysis By Flavor, 2020 to 2024
    • Current and Future Market Size Value (USD Billion) & Volume (MT) Analysis and Forecast By Flavor, 2025 to 2035
      • Wintergreen
      • Cinnamon
      • Chocolate Mint
      • Peppermint
      • Spearmint
    • Y-o-Y Growth Trend Analysis By Flavor, 2020 to 2024
    • Absolute $ Opportunity Analysis By Flavor, 2025 to 2035
  7. Global Market Analysis 2020 to 2024 and Forecast 2025 to 2035, By Form
    • Introduction / Key Findings
    • Historical Market Size Value (USD Billion) & Volume (MT) Analysis By Form, 2020 to 2024
    • Current and Future Market Size Value (USD Billion) & Volume (MT) Analysis and Forecast By Form, 2025 to 2035
      • Capsules
      • Pills
      • Sprays
    • Y-o-Y Growth Trend Analysis By Form, 2020 to 2024
    • Absolute $ Opportunity Analysis By Form, 2025 to 2035
  8. Global Market Analysis 2020 to 2024 and Forecast 2025 to 2035, By Distribution Channel
    • Introduction / Key Findings
    • Historical Market Size Value (USD Billion) & Volume (MT) Analysis By Distribution Channel, 2020 to 2024
    • Current and Future Market Size Value (USD Billion) & Volume (MT) Analysis and Forecast By Distribution Channel, 2025 to 2035
      • Hypermarkets/Supermarkets
      • Convenience Stores
      • Pharmacies
      • Specialty Stores
      • Grocery Stores
      • Wholesale Stores
      • Online Retail Platforms
    • Y-o-Y Growth Trend Analysis By Distribution Channel, 2020 to 2024
    • Absolute $ Opportunity Analysis By Distribution Channel, 2025 to 2035
  9. Global Market Analysis 2020 to 2024 and Forecast 2025 to 2035, By Region
    • Introduction
    • Historical Market Size Value (USD Billion) & Volume (MT) Analysis By Region, 2020 to 2024
    • Current Market Size Value (USD Billion) & Volume (MT) Analysis and Forecast By Region, 2025 to 2035
      • North America
      • Latin America
      • Western Europe
      • Eastern Europe
      • East Asia
      • South Asia & Pacific
      • Middle East and Africa
    • Market Attractiveness Analysis By Region
  10. North America Market Analysis 2020 to 2024 and Forecast 2025 to 2035, By Country
    • Historical Market Size Value (USD Billion) & Volume (MT) Trend Analysis By Market Taxonomy, 2020 to 2024
    • Market Size Value (USD Billion) & Volume (MT) Forecast By Market Taxonomy, 2025 to 2035
      • By Country
        • USA
        • Canada
        • Mexico
      • By Flavor
      • By Form
      • By Distribution Channel
    • Market Attractiveness Analysis
      • By Country
      • By Flavor
      • By Form
      • By Distribution Channel
    • Key Takeaways
  11. Latin America Market Analysis 2020 to 2024 and Forecast 2025 to 2035, By Country
    • Historical Market Size Value (USD Billion) & Volume (MT) Trend Analysis By Market Taxonomy, 2020 to 2024
    • Market Size Value (USD Billion) & Volume (MT) Forecast By Market Taxonomy, 2025 to 2035
      • By Country
        • Brazil
        • Argentina
        • Rest of LATAM
      • By Flavor
      • By Form
      • By Distribution Channel
    • Market Attractiveness Analysis
      • By Country
      • By Flavor
      • By Form
      • By Distribution Channel
    • Key Takeaways
  12. Western Europe Market Analysis 2020 to 2024 and Forecast 2025 to 2035, By Country
    • Historical Market Size Value (USD Billion) & Volume (MT) Trend Analysis By Market Taxonomy, 2020 to 2024
    • Market Size Value (USD Billion) & Volume (MT) Forecast By Market Taxonomy, 2025 to 2035
      • By Country
        • Germany
        • Italy
        • France
        • UK
        • Spain
        • BENELUX
        • Nordic
        • Rest of W.Europe
      • By Flavor
      • By Form
      • By Distribution Channel
    • Market Attractiveness Analysis
      • By Country
      • By Flavor
      • By Form
      • By Distribution Channel
    • Key Takeaways
  13. Eastern Europe Market Analysis 2020 to 2024 and Forecast 2025 to 2035, By Country
    • Historical Market Size Value (USD Billion) & Volume (MT) Trend Analysis By Market Taxonomy, 2020 to 2024
    • Market Size Value (USD Billion) & Volume (MT) Forecast By Market Taxonomy, 2025 to 2035
      • By Country
        • Russia
        • Hungary
        • Poland
        • Balkan & Baltics
        • Rest of E. Europe
      • By Flavor
      • By Form
      • By Distribution Channel
    • Market Attractiveness Analysis
      • By Country
      • By Flavor
      • By Form
      • By Distribution Channel
    • Key Takeaways
  14. East Asia Market Analysis 2020 to 2024 and Forecast 2025 to 2035, By Country
    • Historical Market Size Value (USD Billion) & Volume (MT) Trend Analysis By Market Taxonomy, 2020 to 2024
    • Market Size Value (USD Billion) & Volume (MT) Forecast By Market Taxonomy, 2025 to 2035
      • By Country
        • China
        • Japan
        • South Korea
      • By Flavor
      • By Form
      • By Distribution Channel
    • Market Attractiveness Analysis
      • By Country
      • By Flavor
      • By Form
      • By Distribution Channel
    • Key Takeaways
  15. South Asia & Pacific Market Analysis 2020 to 2024 and Forecast 2025 to 2035, By Country
    • Historical Market Size Value (USD Billion) & Volume (MT) Trend Analysis By Market Taxonomy, 2020 to 2024
    • Market Size Value (USD Billion) & Volume (MT) Forecast By Market Taxonomy, 2025 to 2035
      • By Country
        • India
        • Australia & New Zealand
        • ASEAN
        • Rest of SAP
      • By Flavor
      • By Form
      • By Distribution Channel
    • Market Attractiveness Analysis
      • By Country
      • By Flavor
      • By Form
      • By Distribution Channel
    • Key Takeaways
  16. Middle East and Africa Market Analysis 2020 to 2024 and Forecast 2025 to 2035, By Country
    • Historical Market Size Value (USD Billion) & Volume (MT) Trend Analysis By Market Taxonomy, 2020 to 2024
    • Market Size Value (USD Billion) & Volume (MT) Forecast By Market Taxonomy, 2025 to 2035
      • By Country
        • GCC Countries
        • Northern Africa
        • South Africa
        • Turkiye
        • Rest of MEA
      • By Flavor
      • By Form
      • By Distribution Channel
    • Market Attractiveness Analysis
      • By Country
      • By Flavor
      • By Form
      • By Distribution Channel
    • Key Takeaways
  17. Key Countries Market Analysis
    • USA
      • Pricing Analysis
      • Market Share Analysis, 2024
        • By Flavor
        • By Form
        • By Distribution Channel
    • Canada
      • Pricing Analysis
      • Market Share Analysis, 2024
        • By Flavor
        • By Form
        • By Distribution Channel
    • Brazil
      • Pricing Analysis
      • Market Share Analysis, 2024
        • By Flavor
        • By Form
        • By Distribution Channel
    • Mexico
      • Pricing Analysis
      • Market Share Analysis, 2024
        • By Flavor
        • By Form
        • By Distribution Channel
    • Argentina
      • Pricing Analysis
      • Market Share Analysis, 2024
        • By Flavor
        • By Form
        • By Distribution Channel
  18. Market Structure Analysis
    • Competition Dashboard
    • Competition Benchmarking
    • Market Share Analysis of Top Players
      • By Regional
      • By Flavor
      • By Form
      • By Distribution Channel
  19. Competition Analysis
    • Competition Deep Dive
      • Viter Energy
        • Overview
        • Product Portfolio
        • Profitability by Market Segments (Product/Age /Sales Channel/Region)
        • Sales Footprint
        • Strategy Overview
          • Marketing Strategy
          • Product Strategy
          • Channel Strategy
      • Rally Energy
        • Overview
        • Product Portfolio
        • Profitability by Market Segments (Product/Age /Sales Channel/Region)
        • Sales Footprint
        • Strategy Overview
          • Marketing Strategy
          • Product Strategy
          • Channel Strategy
      • Vigilant Eats
        • Overview
        • Product Portfolio
        • Profitability by Market Segments (Product/Age /Sales Channel/Region)
        • Sales Footprint
        • Strategy Overview
          • Marketing Strategy
          • Product Strategy
          • Channel Strategy
      • Simply Gum
        • Overview
        • Product Portfolio
        • Profitability by Market Segments (Product/Age /Sales Channel/Region)
        • Sales Footprint
        • Strategy Overview
          • Marketing Strategy
          • Product Strategy
          • Channel Strategy
      • Vroom Foods, Inc.
        • Overview
        • Product Portfolio
        • Profitability by Market Segments (Product/Age /Sales Channel/Region)
        • Sales Footprint
        • Strategy Overview
          • Marketing Strategy
          • Product Strategy
          • Channel Strategy
      • Neuro
        • Overview
        • Product Portfolio
        • Profitability by Market Segments (Product/Age /Sales Channel/Region)
        • Sales Footprint
        • Strategy Overview
          • Marketing Strategy
          • Product Strategy
          • Channel Strategy
      • Silverline Chemicals
        • Overview
        • Product Portfolio
        • Profitability by Market Segments (Product/Age /Sales Channel/Region)
        • Sales Footprint
        • Strategy Overview
          • Marketing Strategy
          • Product Strategy
          • Channel Strategy
      • FOOSH Energy Mints
        • Overview
        • Product Portfolio
        • Profitability by Market Segments (Product/Age /Sales Channel/Region)
        • Sales Footprint
        • Strategy Overview
          • Marketing Strategy
          • Product Strategy
          • Channel Strategy
      • Per Os Biosciences LLC
        • Overview
        • Product Portfolio
        • Profitability by Market Segments (Product/Age /Sales Channel/Region)
        • Sales Footprint
        • Strategy Overview
          • Marketing Strategy
          • Product Strategy
          • Channel Strategy
      • Hershey Company
        • Overview
        • Product Portfolio
        • Profitability by Market Segments (Product/Age /Sales Channel/Region)
        • Sales Footprint
        • Strategy Overview
          • Marketing Strategy
          • Product Strategy
          • Channel Strategy
      • Ferndale Confectionery Pty Ltd
        • Overview
        • Product Portfolio
        • Profitability by Market Segments (Product/Age /Sales Channel/Region)
        • Sales Footprint
        • Strategy Overview
          • Marketing Strategy
          • Product Strategy
          • Channel Strategy
      • Ferrero International S.A.
        • Overview
        • Product Portfolio
        • Profitability by Market Segments (Product/Age /Sales Channel/Region)
        • Sales Footprint
        • Strategy Overview
          • Marketing Strategy
          • Product Strategy
          • Channel Strategy
  20. Assumptions & Acronyms Used
  21. Research Methodology

List of Tables

  • Table 1: Global Market Value (USD Billion) Forecast by Region, 2020-2035
  • Table 2: Global Market Volume (MT) Forecast by Region, 2020-2035
  • Table 3: Global Market Value (USD Billion) Forecast by Flavor, 2020-2035
  • Table 4: Global Market Volume (MT) Forecast by Flavor, 2020-2035
  • Table 5: Global Market Value (USD Billion) Forecast by Form, 2020-2035
  • Table 6: Global Market Volume (MT) Forecast by Form, 2020-2035
  • Table 7: Global Market Value (USD Billion) Forecast by Distribution Channel, 2020-2035
  • Table 8: Global Market Volume (MT) Forecast by Distribution Channel, 2020-2035
  • Table 9: North America Market Value (USD Billion) Forecast by Country, 2020-2035
  • Table 10: North America Market Volume (MT) Forecast by Country, 2020-2035
  • Table 11: North America Market Value (USD Billion) Forecast by Flavor, 2020-2035
  • Table 12: North America Market Volume (MT) Forecast by Flavor, 2020-2035
  • Table 13: North America Market Value (USD Billion) Forecast by Form, 2020-2035
  • Table 14: North America Market Volume (MT) Forecast by Form, 2020-2035
  • Table 15: North America Market Value (USD Billion) Forecast by Distribution Channel, 2020-2035
  • Table 16: North America Market Volume (MT) Forecast by Distribution Channel, 2020-2035
  • Table 17: Latin America Market Value (USD Billion) Forecast by Country, 2020-2035
  • Table 18: Latin America Market Volume (MT) Forecast by Country, 2020-2035
  • Table 19: Latin America Market Value (USD Billion) Forecast by Flavor, 2020-2035
  • Table 20: Latin America Market Volume (MT) Forecast by Flavor, 2020-2035
  • Table 21: Latin America Market Value (USD Billion) Forecast by Form, 2020-2035
  • Table 22: Latin America Market Volume (MT) Forecast by Form, 2020-2035
  • Table 23: Latin America Market Value (USD Billion) Forecast by Distribution Channel, 2020-2035
  • Table 24: Latin America Market Volume (MT) Forecast by Distribution Channel, 2020-2035
  • Table 25: Western Europe Market Value (USD Billion) Forecast by Country, 2020-2035
  • Table 26: Western Europe Market Volume (MT) Forecast by Country, 2020-2035
  • Table 27: Western Europe Market Value (USD Billion) Forecast by Flavor, 2020-2035
  • Table 28: Western Europe Market Volume (MT) Forecast by Flavor, 2020-2035
  • Table 29: Western Europe Market Value (USD Billion) Forecast by Form, 2020-2035
  • Table 30: Western Europe Market Volume (MT) Forecast by Form, 2020-2035
  • Table 31: Western Europe Market Value (USD Billion) Forecast by Distribution Channel, 2020-2035
  • Table 32: Western Europe Market Volume (MT) Forecast by Distribution Channel, 2020-2035
  • Table 33: Eastern Europe Market Value (USD Billion) Forecast by Country, 2020-2035
  • Table 34: Eastern Europe Market Volume (MT) Forecast by Country, 2020-2035
  • Table 35: Eastern Europe Market Value (USD Billion) Forecast by Flavor, 2020-2035
  • Table 36: Eastern Europe Market Volume (MT) Forecast by Flavor, 2020-2035
  • Table 37: Eastern Europe Market Value (USD Billion) Forecast by Form, 2020-2035
  • Table 38: Eastern Europe Market Volume (MT) Forecast by Form, 2020-2035
  • Table 39: Eastern Europe Market Value (USD Billion) Forecast by Distribution Channel, 2020-2035
  • Table 40: Eastern Europe Market Volume (MT) Forecast by Distribution Channel, 2020-2035
  • Table 41: East Asia Market Value (USD Billion) Forecast by Country, 2020-2035
  • Table 42: East Asia Market Volume (MT) Forecast by Country, 2020-2035
  • Table 43: East Asia Market Value (USD Billion) Forecast by Flavor, 2020-2035
  • Table 44: East Asia Market Volume (MT) Forecast by Flavor, 2020-2035
  • Table 45: East Asia Market Value (USD Billion) Forecast by Form, 2020-2035
  • Table 46: East Asia Market Volume (MT) Forecast by Form, 2020-2035
  • Table 47: East Asia Market Value (USD Billion) Forecast by Distribution Channel, 2020-2035
  • Table 48: East Asia Market Volume (MT) Forecast by Distribution Channel, 2020-2035
  • Table 49: South Asia & Pacific Market Value (USD Billion) Forecast by Country, 2020-2035
  • Table 50: South Asia & Pacific Market Volume (MT) Forecast by Country, 2020-2035
  • Table 51: South Asia & Pacific Market Value (USD Billion) Forecast by Flavor, 2020-2035
  • Table 52: South Asia & Pacific Market Volume (MT) Forecast by Flavor, 2020-2035
  • Table 53: South Asia & Pacific Market Value (USD Billion) Forecast by Form, 2020-2035
  • Table 54: South Asia & Pacific Market Volume (MT) Forecast by Form, 2020-2035
  • Table 55: South Asia & Pacific Market Value (USD Billion) Forecast by Distribution Channel, 2020-2035
  • Table 56: South Asia & Pacific Market Volume (MT) Forecast by Distribution Channel, 2020-2035
  • Table 57: Middle East and Africa Market Value (USD Billion) Forecast by Country, 2020-2035
  • Table 58: Middle East and Africa Market Volume (MT) Forecast by Country, 2020-2035
  • Table 59: Middle East and Africa Market Value (USD Billion) Forecast by Flavor, 2020-2035
  • Table 60: Middle East and Africa Market Volume (MT) Forecast by Flavor, 2020-2035
  • Table 61: Middle East and Africa Market Value (USD Billion) Forecast by Form, 2020-2035
  • Table 62: Middle East and Africa Market Volume (MT) Forecast by Form, 2020-2035
  • Table 63: Middle East and Africa Market Value (USD Billion) Forecast by Distribution Channel, 2020-2035
  • Table 64: Middle East and Africa Market Volume (MT) Forecast by Distribution Channel, 2020-2035

List of Figures

  • Figure 1: Global Market Volume (MT) Forecast 2020-2035
  • Figure 2: Global Market Pricing Analysis
  • Figure 3: Global Market Value (USD Billion) Forecast 2020-2035
  • Figure 4: Global Market Value Share and BPS Analysis by Flavor, 2025 and 2035
  • Figure 5: Global Market Y-o-Y Growth Comparison by Flavor, 2025-2035
  • Figure 6: Global Market Attractiveness Analysis by Flavor
  • Figure 7: Global Market Value Share and BPS Analysis by Form, 2025 and 2035
  • Figure 8: Global Market Y-o-Y Growth Comparison by Form, 2025-2035
  • Figure 9: Global Market Attractiveness Analysis by Form
  • Figure 10: Global Market Value Share and BPS Analysis by Distribution Channel, 2025 and 2035
  • Figure 11: Global Market Y-o-Y Growth Comparison by Distribution Channel, 2025-2035
  • Figure 12: Global Market Attractiveness Analysis by Distribution Channel
  • Figure 13: Global Market Value (USD Billion) Share and BPS Analysis by Region, 2025 and 2035
  • Figure 14: Global Market Y-o-Y Growth Comparison by Region, 2025-2035
  • Figure 15: Global Market Attractiveness Analysis by Region
  • Figure 16: North America Market Incremental $ Opportunity, 2025-2035
  • Figure 17: Latin America Market Incremental $ Opportunity, 2025-2035
  • Figure 18: Western Europe Market Incremental $ Opportunity, 2025-2035
  • Figure 19: Eastern Europe Market Incremental $ Opportunity, 2025-2035
  • Figure 20: East Asia Market Incremental $ Opportunity, 2025-2035
  • Figure 21: South Asia & Pacific Market Incremental $ Opportunity, 2025-2035
  • Figure 22: Middle East and Africa Market Incremental $ Opportunity, 2025-2035
  • Figure 23: North America Market Value Share and BPS Analysis by Country, 2025 and 2035
  • Figure 24: North America Market Value Share and BPS Analysis by Flavor, 2025 and 2035
  • Figure 25: North America Market Y-o-Y Growth Comparison by Flavor, 2025-2035
  • Figure 26: North America Market Attractiveness Analysis by Flavor
  • Figure 27: North America Market Value Share and BPS Analysis by Form, 2025 and 2035
  • Figure 28: North America Market Y-o-Y Growth Comparison by Form, 2025-2035
  • Figure 29: North America Market Attractiveness Analysis by Form
  • Figure 30: North America Market Value Share and BPS Analysis by Distribution Channel, 2025 and 2035
  • Figure 31: North America Market Y-o-Y Growth Comparison by Distribution Channel, 2025-2035
  • Figure 32: North America Market Attractiveness Analysis by Distribution Channel
  • Figure 33: Latin America Market Value Share and BPS Analysis by Country, 2025 and 2035
  • Figure 34: Latin America Market Value Share and BPS Analysis by Flavor, 2025 and 2035
  • Figure 35: Latin America Market Y-o-Y Growth Comparison by Flavor, 2025-2035
  • Figure 36: Latin America Market Attractiveness Analysis by Flavor
  • Figure 37: Latin America Market Value Share and BPS Analysis by Form, 2025 and 2035
  • Figure 38: Latin America Market Y-o-Y Growth Comparison by Form, 2025-2035
  • Figure 39: Latin America Market Attractiveness Analysis by Form
  • Figure 40: Latin America Market Value Share and BPS Analysis by Distribution Channel, 2025 and 2035
  • Figure 41: Latin America Market Y-o-Y Growth Comparison by Distribution Channel, 2025-2035
  • Figure 42: Latin America Market Attractiveness Analysis by Distribution Channel
  • Figure 43: Western Europe Market Value Share and BPS Analysis by Country, 2025 and 2035
  • Figure 44: Western Europe Market Value Share and BPS Analysis by Flavor, 2025 and 2035
  • Figure 45: Western Europe Market Y-o-Y Growth Comparison by Flavor, 2025-2035
  • Figure 46: Western Europe Market Attractiveness Analysis by Flavor
  • Figure 47: Western Europe Market Value Share and BPS Analysis by Form, 2025 and 2035
  • Figure 48: Western Europe Market Y-o-Y Growth Comparison by Form, 2025-2035
  • Figure 49: Western Europe Market Attractiveness Analysis by Form
  • Figure 50: Western Europe Market Value Share and BPS Analysis by Distribution Channel, 2025 and 2035
  • Figure 51: Western Europe Market Y-o-Y Growth Comparison by Distribution Channel, 2025-2035
  • Figure 52: Western Europe Market Attractiveness Analysis by Distribution Channel
  • Figure 53: Eastern Europe Market Value Share and BPS Analysis by Country, 2025 and 2035
  • Figure 54: Eastern Europe Market Value Share and BPS Analysis by Flavor, 2025 and 2035
  • Figure 55: Eastern Europe Market Y-o-Y Growth Comparison by Flavor, 2025-2035
  • Figure 56: Eastern Europe Market Attractiveness Analysis by Flavor
  • Figure 57: Eastern Europe Market Value Share and BPS Analysis by Form, 2025 and 2035
  • Figure 58: Eastern Europe Market Y-o-Y Growth Comparison by Form, 2025-2035
  • Figure 59: Eastern Europe Market Attractiveness Analysis by Form
  • Figure 60: Eastern Europe Market Value Share and BPS Analysis by Distribution Channel, 2025 and 2035
  • Figure 61: Eastern Europe Market Y-o-Y Growth Comparison by Distribution Channel, 2025-2035
  • Figure 62: Eastern Europe Market Attractiveness Analysis by Distribution Channel
  • Figure 63: East Asia Market Value Share and BPS Analysis by Country, 2025 and 2035
  • Figure 64: East Asia Market Value Share and BPS Analysis by Flavor, 2025 and 2035
  • Figure 65: East Asia Market Y-o-Y Growth Comparison by Flavor, 2025-2035
  • Figure 66: East Asia Market Attractiveness Analysis by Flavor
  • Figure 67: East Asia Market Value Share and BPS Analysis by Form, 2025 and 2035
  • Figure 68: East Asia Market Y-o-Y Growth Comparison by Form, 2025-2035
  • Figure 69: East Asia Market Attractiveness Analysis by Form
  • Figure 70: East Asia Market Value Share and BPS Analysis by Distribution Channel, 2025 and 2035
  • Figure 71: East Asia Market Y-o-Y Growth Comparison by Distribution Channel, 2025-2035
  • Figure 72: East Asia Market Attractiveness Analysis by Distribution Channel
  • Figure 73: South Asia & Pacific Market Value Share and BPS Analysis by Country, 2025 and 2035
  • Figure 74: South Asia & Pacific Market Value Share and BPS Analysis by Flavor, 2025 and 2035
  • Figure 75: South Asia & Pacific Market Y-o-Y Growth Comparison by Flavor, 2025-2035
  • Figure 76: South Asia & Pacific Market Attractiveness Analysis by Flavor
  • Figure 77: South Asia & Pacific Market Value Share and BPS Analysis by Form, 2025 and 2035
  • Figure 78: South Asia & Pacific Market Y-o-Y Growth Comparison by Form, 2025-2035
  • Figure 79: South Asia & Pacific Market Attractiveness Analysis by Form
  • Figure 80: South Asia & Pacific Market Value Share and BPS Analysis by Distribution Channel, 2025 and 2035
  • Figure 81: South Asia & Pacific Market Y-o-Y Growth Comparison by Distribution Channel, 2025-2035
  • Figure 82: South Asia & Pacific Market Attractiveness Analysis by Distribution Channel
  • Figure 83: Middle East and Africa Market Value Share and BPS Analysis by Country, 2025 and 2035
  • Figure 84: Middle East and Africa Market Value Share and BPS Analysis by Flavor, 2025 and 2035
  • Figure 85: Middle East and Africa Market Y-o-Y Growth Comparison by Flavor, 2025-2035
  • Figure 86: Middle East and Africa Market Attractiveness Analysis by Flavor
  • Figure 87: Middle East and Africa Market Value Share and BPS Analysis by Form, 2025 and 2035
  • Figure 88: Middle East and Africa Market Y-o-Y Growth Comparison by Form, 2025-2035
  • Figure 89: Middle East and Africa Market Attractiveness Analysis by Form
  • Figure 90: Middle East and Africa Market Value Share and BPS Analysis by Distribution Channel, 2025 and 2035
  • Figure 91: Middle East and Africa Market Y-o-Y Growth Comparison by Distribution Channel, 2025-2035
  • Figure 92: Middle East and Africa Market Attractiveness Analysis by Distribution Channel
  • Figure 93: Global Market - Tier Structure Analysis
  • Figure 94: Global Market - Company Share Analysis

Frequently Asked Questions

What is the market value of the caffeine mint market in 2025?

The caffeine mint industry is valued at USD 397.5 million in 2025.

What is the projected value of the caffeine mint market in 2035 and its CAGR?

The industry is expected to reach USD 659.3 million by 2035, growing at a 5.2% CAGR.

What is the leading segment in the caffeine mint market?

Peppermint is the leading segment with a 36.1% market share in 2025.

Which country leads the caffeine mint market?

India leads the caffeine mint market with a 6.0% CAGR from 2025 to 2035.

Who is the leading company in the caffeine mint market?

The Hershey Company is the leading player with an 18.2% market share.

Explore Similar Insights

Future Market Insights

Caffeine Mint Market