
- Market Size (2026)
- USD 1900.0 Mn
- Forecast (2036)
- USD 3245.0 Mn
- CAGR (2026 to 2036)
- 5.5%
How big is the Nicotine Gums and Mints Market in 2026?
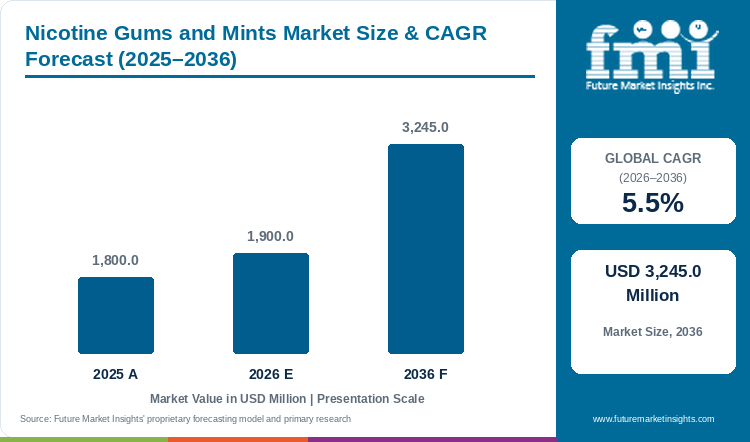
The Nicotine Gums and Mints Market is projected to reach USD 3,245 million by 2036, growing at a 5.5% CAGR from 2026 to 2036.
FMI estimates the market at USD 1,900 million in 2026. The market was valued at USD 1,800 million in 2025. Demand is tied to the number of smokers who try to quit. Pharmacies and drug stores lead distribution with 61.0% of 2026 revenue. Rules on over-the-counter access, particularly in India, are the main commercial risk. Quit attempts, not smoker counts, set the volume that nicotine gum can reach. India's 2016 to 2017 survey recorded 99.5 million smokers. Among smokers and recent quitters, 38.5% had tried to quit within a year. In the United States, 28.8 million adults smoked in 2022 and 53.3% of smokers and recent quitters tried to quit. Only 8.8% quit successfully that year. Substitutes narrow the usable pool in markets where vapes are legal. In England, over-the-counter nicotine replacement featured in 17.3% of quit attempts in 2023 to 2024, while vapes reached 40.2%.
Key Market Trends & Insights
- Brand ownership is changing. Kimberly-Clark completed its acquisition of Kenvue, owner of Nicorette, on 2 November 2026. Dr. Reddy's Laboratories had bought the Nicotinell portfolio outside the United States for an up-front GBP 458 million in 2024.
- Store brands are gaining share. Perrigo reported on 4 November 2026 that store brand nicotine replacement drove growth in its Healthy Lifestyle category.
- Digital support is being attached to gum. Cipla Health launched Nicotex Begin, a 12-week cessation app that combines behavioral therapy with nicotine replacement, in May 2025.
Regional Highlights
- In North America, store brands are gaining share in nicotine replacement. In the United States, 38.3% of adults who tried to quit used counseling or medication in 2022.
- In South Asia, regulation could decide growth. India's Drugs Technical Advisory Board recommended in February 2026 that over-the-counter sale cover only unflavoured 2 mg gum.
Nicotine Gums and Mints Market Size and Forecast
Table 1: Nicotine Gums and Mints Market Size and Forecast
| Market size and forecast | Value |
|---|---|
| Market size in 2025 | USD 1,800.0 million |
| Estimated market size in 2026 | USD 1,900.0 million |
| Projected market size by 2036 | USD 3,245.0 million |
| CAGR from 2026 to 2036 | 5.5% |
Source: Future Market Insights analysis of the nicotine gums and mints market, 2026.
Analyst Perspective
“Nicotine gums and mints are regulated medicines in most countries, so growth depends on how easily smokers can buy them. Pharmacy shelf space, price against store brands and rules on flavors and strengths shape revenue. Brand ownership is changing in several markets, so supply terms will matter during integration. Falling smoking rates in mature markets shift growth toward Asia, where over-the-counter rules are still being set.”
- Nandini Roy Choudhury, Principal Consultant, FMI
How is the Nicotine Gums and Mints Market segmented?
- By product type: Nicotine gum, Nicotine mints and lozenges.
- By strength: Below 3 mg, 3 mg and above.
- By flavor: Mint, Fruit, Original and classic, Others.
- By distribution channel: Pharmacies and drug stores, Supermarkets and hypermarkets, Convenience stores, Online retail, Others.
- By region: North America, Latin America, Europe, East Asia, South Asia, Oceania, Middle East and Africa.
Why does Nicotine gum lead by Product Type in the Nicotine Gums and Mints Market in 2026?
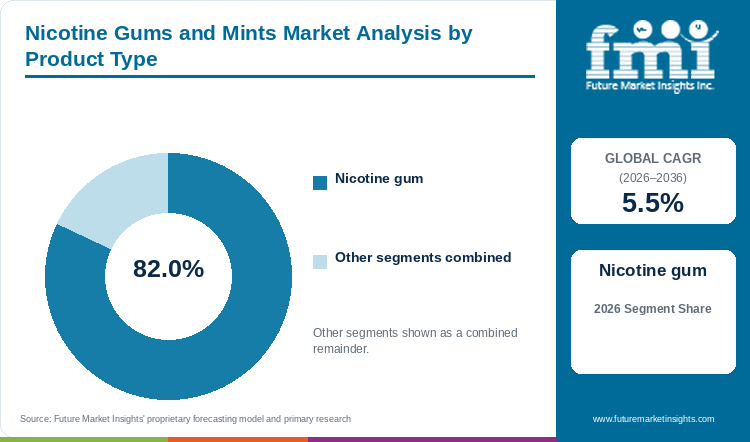
Nicotine gum is estimated to account for 82.0% of the Nicotine Gums and Mints Market by product type in 2026.
Nicotine gum is one of five nicotine replacement medicines approved by FDA. Nicotine mints and lozenges account for the remaining 18.0%, and regulators set tighter conditions on lozenges in some markets. In India, the advisory board recommended excluding the 2 mg lozenge from the Schedule K exemption.
Table 2: Product Type, 2026 Share
| Leading Share | 2026 market share |
|---|---|
| Nicotine gum | 82.0% |
| All Other Segments Combined Share | 18.0% |
Source: Future Market Insights analysis of the nicotine gums and mints market, 2026.
Why does Below 3 mg lead by Strength in the Nicotine Gums and Mints Market in 2026?
Below 3 mg strengths are estimated to account for 66.0% of the Nicotine Gums and Mints Market by strength in 2026.
Nicotine gum comes in 2 mg and 4 mg strengths. Smokers who have their first cigarette within 30 minutes of waking should consider starting with the 4 mg dose. India's recommended Schedule K amendment would keep only unflavoured 2 mg gum outside the sales-licence requirement. Strengths of 3 mg and above account for the remaining 34.0%.
Table 3: Strength, 2026 Share
| Leading Share | 2026 market share |
|---|---|
| Below 3 mg | 66.0% |
| All Other Segments Combined Share | 34.0% |
Source: Future Market Insights analysis of the nicotine gums and mints market, 2026.
Why does Mint lead by Flavor in the Nicotine Gums and Mints Market in 2026?
Mint is estimated to account for 45.0% of the Nicotine Gums and Mints Market by flavor in 2026.
CDC lists mint, cinnamon and cherry among the available flavors of nicotine gum. Fruit, original and other flavors share the remaining 55.0%. India's recommended Schedule K amendment would leave only unflavoured gum outside the sales-licence requirement, which could narrow flavor choice there.
Table 4: Flavor, 2026 Share
| Leading Share | 2026 market share |
|---|---|
| Mint | 45.0% |
| All Other Segments Combined Share | 55.0% |
Source: Future Market Insights analysis of the nicotine gums and mints market, 2026.
Why do Pharmacies and drug stores lead by Distribution Channel in the Nicotine Gums and Mints Market in 2026?
Pharmacies and drug stores are estimated to account for 61.0% of the Nicotine Gums and Mints Market by distribution channel in 2026.
In India, Cipla Health said in May 2025 that its products reach more than 600,000 of nearly 800,000 chemists. The board's February 2026 recommendation would limit the licence exemption to unflavoured 2 mg gum and exclude 2 mg lozenges. Supermarkets, convenience stores, online retail and other channels share the remaining 39.0%.
Table 5: Distribution Channel, 2026 Share
| Leading Share | 2026 market share |
|---|---|
| Pharmacies and drug stores | 61.0% |
| All Other Segments Combined Share | 39.0% |
Source: Future Market Insights analysis of the nicotine gums and mints market, 2026.
What are the key drivers, restraints and opportunities?
Driver
Smokers who want to quit. Over 60% of smokers in countries covered by the Global Adult Tobacco Survey intend to quit. WHO states that counselling and medication can more than double a tobacco user's chance of quitting successfully. That intent supports demand across smoking cessation products.
Brand and store brand competition. Nicorette outperformed its category across major markets in the second quarter of 2026. Store brand nicotine replacement products also kept gaining share in the third quarter.
Restraint
Tighter over-the-counter rules. India's Drugs Technical Advisory Board recommended in February 2026 that the sales-licence exemption cover only unflavoured 2 mg gum. In August 2026 it also recommended that no new nicotine formulation be approved, after applications for nicotine pouches. The government has not yet taken a final decision.
Competition from other nicotine products. FDA authorized the marketing of 20 ZYN nicotine pouches products in January 2025. In England, nicotine pouches featured in 3.1% of quit attempts in 2023 to 2024.
Opportunity
Wider licensing of established brands. Nicotinell is licensed to Hikma across the Middle East and North Africa from September 2026. Its owner reports a footprint in over 30 countries across Europe, Asia including Japan, and Latin America.
Behavioral support. CDC advises using nicotine gum as part of a program that includes coaching support. In England, websites and smartphone apps featured in 4.6% and 3.6% of quit attempts in 2023 to 2024.
Nicotine Gums and Mints Market by Country (2026 to 2036)
Table 6: Nicotine Gums and Mints Market Country Growth Forecast
| Country | CAGR, 2026 to 2036 |
|---|---|
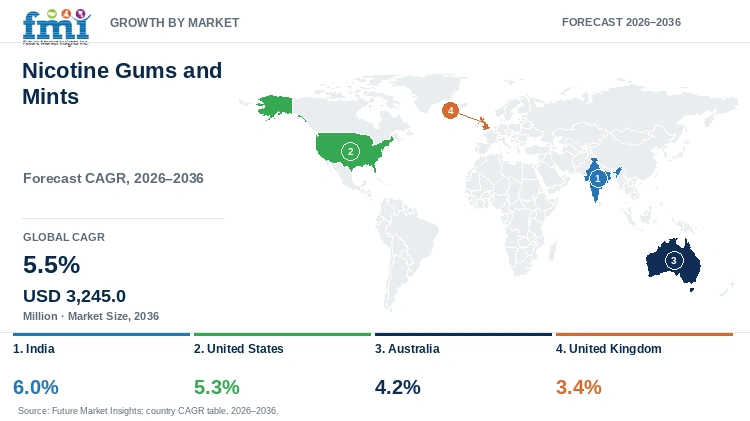
| India | 6.0% |
| United States | 5.3% |
| Australia | 4.2% |
| United Kingdom | 3.4% |
Source: Future Market Insights analysis of the nicotine gums and mints market, 2026.
India
India has a very large smoking and smokeless tobacco population. Entry 33 of Schedule K to the Drugs Rules, 1945 exempts nicotine gum and lozenges from the sales licence. The exemption covers products with up to 2 mg of nicotine. The advisory board's February 2026 recommendation would narrow that exemption. Strong demand and regulatory risk support a 6.0% CAGR for 2026 to 2036, the highest among the four profiled countries.
Pool size and a low price ceiling explain the lead. India's 2016 to 2017 survey, the latest round, recorded 99.5 million smokers and 199.4 million smokeless users. Bidis reach 7.7% of adults against 4.0% for cigarettes. A daily bidi smoker spends INR 284.1 a month against INR 1,192.5 for a cigarette smoker. Gum pricing therefore faces a lower ceiling than in markets built on cigarette smokers. Smokeless users are a second pool, with 33.2% of users and recent quitters making a quit attempt in the past year.
India differs from the other profiled countries on three points. Intent is high, since 55.4% of smokers are planning or thinking about quitting. Clinical prompting lags, because only 48.8% of smokers who visited a health provider were advised to quit. India also prohibits e-cigarettes under a 2019 law, so quitters have no vape route. If adopted, the amendment would keep only unflavoured 2 mg gum outside the licence requirement. Lozenges of 2 mg would need a sales licence.
United States
Nicorette is marketed in the United States by a licensee of the brand owner, not by the owner itself. Competition between brands and store brands supports a 5.3% CAGR for 2026 to 2036.
CDC reported 28.8 million adult smokers in 2022, and 53.3% of smokers and recent quitters tried to quit that year. About two thirds (67.7%) wanted to quit, but only 8.8% quit successfully. Adult smoking then fell from 11.6% in 2022 to 9.1% in the latest national survey release. Treatment use is thin, as 38.3% of quitters used counseling or medication and 18.4% used gum or lozenges. Gum and lozenges therefore reach about one in five quitters, close to the 19.6% using patches.
Access rules, not intent, set the pace. Only 20 state Medicaid programs offered full barrier-free cessation coverage in 2022. Treatment use among uninsured adults was 20.4%, against 38.3% across all who tried to quit. CDC also noted the discontinuation of the nicotine oral inhaler, which narrows the choice of nicotine forms. Menthol smokers try to quit more often (57.3% against 50.4%) yet use treatment less (35.2% against 41.5%). Substitution is a second constraint, since 6.7% of adults use e-cigarettes against 9.1% who smoke. Gum suppliers therefore depend on insurer coverage and retail access to turn quit attempts into sales.
Australia
Nicabate, the local brand in Australia, belongs to the Nicotinell portfolio that Dr. Reddy's bought from Haleon in 2024. Falling smoking rates support steady but modest growth of 4.2% a year for 2026 to 2036.
Retail volume, not subsidy, drives Australian gum sales. Subsidised supply was 7% of all nicotine replacement use in 2019, so most is bought over the counter. Gum was the most commonly sold over-the-counter format, with 194 million of 257.4 million units sold. Gum earned AUD 56 million of AUD 152 million in retail value, the same as patches. Patches made up 94% of subsidised nicotine replacement, although gum has been listed since February 2019.
The smoker pool is shrinking quickly. Daily smoking among adults fell to 5.8% in 2025, which means 500,000 fewer daily smokers than three years earlier. Among people aged 14 and over, daily smoking was 5.6%, down from 8.3% in 2022 to 2023. Past-year use of any nicotine product fell to 15.2%, and daily vaping has stabilised at 3.6%. Tobacco remains the leading cause of premature death in Australia, taking more than 24,000 lives each year. The government announced that from 24 July 2026 individuals can no longer import nicotine pouches, even with a prescription. That leaves licensed products, such as gum, as the lawful route for Australian quitters who want nicotine replacement.
United Kingdom
Adult smoking stood at 9.5% in England in 2025. Legislation raising the age of sale of tobacco takes effect progressively from 1 January 2027. People born in or after 2009 can then never be legally sold tobacco. A shrinking smoker base limits growth to 3.4% a year for 2026 to 2036, the lowest among the profiled countries.
Substitution, more than prevalence, caps UK growth. Vapes have been the most popular quit aid in England since 2013. Over-the-counter nicotine replacement averaged 24.5% of attempts across 2006 to 2024, against 17.3% in 2023 to 2024. Unaided attempts also limit the market, at 40.8% of attempts in 2023 to 2024.
Survey evidence for over-the-counter nicotine replacement is weaker than for the alternatives. Prescription nicotine replacement was associated with higher quit success (odds ratio 1.33, 95% confidence interval 1.12 to 1.58). Over-the-counter nicotine replacement was not (odds ratio 1.03, 95% confidence interval 0.93 to 1.15). The study is a cross-sectional survey of all over-the-counter forms, so it does not isolate gum. Among quitters who used nicotine replacement, 38.8% still used it at the survey date, against 84.8% for e-cigarettes. The Swap to Stop scheme added about 125,000 people using vapes to quit in its first year. Free vape starter kits therefore give retail gum a funded competitor for each English quit attempt.
Who are the notable companies in the Nicotine Gums and Mints Market?
Notable companies in the Nicotine Gums and Mints Market include Kenvue, Perrigo, Dr. Reddy's, Cipla and Rusan Pharma.
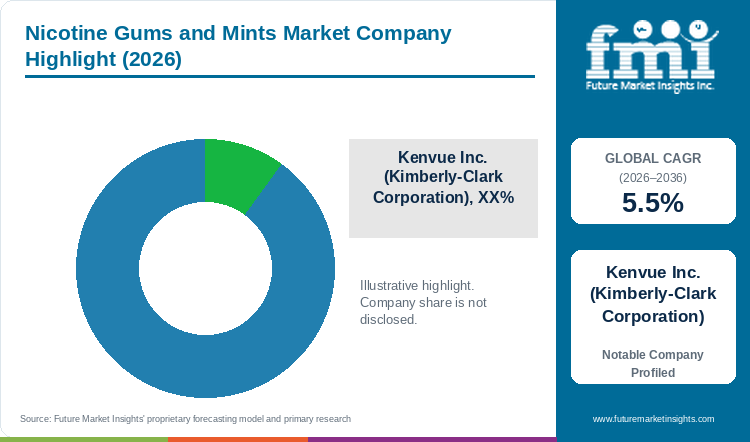
Brand rights by territory set who sells nicotine gum in each market. Kenvue owns Nicorette and markets it outside the United States, while Haleon markets it in the United States under license. Kimberly-Clark completed its acquisition of Kenvue on 2 November 2026 and plans approximately USD 2.1 billion of run-rate synergies. Nicorette outperformed its category across major markets in the second quarter of 2026.
Dr. Reddy's holds Nicotinell and related brands outside the United States. It bought them from Haleon on 30 September 2024 for an up-front GBP 458 million. The portfolio covers over 30 countries. It includes Nicabate in Australia, Thrive in Canada and Habitrol in New Zealand and Canada. In September 2026 it granted Hikma exclusive rights to register, market and distribute Nicotinell across the Middle East and North Africa.
Perrigo supplies store brand nicotine replacement products to retailers. Its third quarter 2026 results of 4 November 2026 cite continued share gains for those products. They also cite share gains across U.S. store brand over-the-counter products.
Cipla Health sells Nicotex gums, lozenges and patches in India. It launched the Nicotex Begin 12-week cessation app in May 2025. India's Drugs Technical Advisory Board recommended in February 2026 that only unflavoured 2 mg gum stay outside the sales-licence requirement. Distributors in India could face licensing requirements for other nicotine replacement products if the government adopts it.
Rusan Pharma sells 2baconil nicotine gum in 2 mg and 4 mg strengths. It competes with Cipla Health in the Indian market for nicotine replacement products.
Key Developments in the Nicotine Gums and Mints Market
- In November 2026, Kimberly-Clark Corporation completed its acquisition of Kenvue Inc. in a cash-and-stock transaction valued at approximately USD 48.7 billion. The combined company unites 10 billion-dollar brands including Nicorette and targets approximately USD 2.1 billion in run-rate synergies from cost savings and revenue growth [citation follows last bibliography number, e.g. 25].
- In September 2026, Hikma Pharmaceuticals International Limited and Dr. Reddy’s Laboratories SA entered into a multi-year exclusive licensing and distribution agreement for Nicotinell across the Middle East and North Africa. Through the agreement, Hikma has the right to register, market and distribute Nicotinell across the region, adding the brand to its consumer health portfolio [26].
Key Players in the Nicotine Gums and Mints Market
- Kenvue Inc. (Kimberly-Clark Corporation)
- Perrigo Company plc
- Dr. Reddy's Laboratories Ltd.
- Cipla Health Ltd.
- Rusan Pharma Ltd.
Nicotine Gums and Mints Market Report Scope
Table 7: Nicotine Gums and Mints Market Report Scope
| Coverage field | Report scope |
|---|---|
| Market definition | Nicotine polacrilex chewing gums and nicotine mints and lozenges sold as nicotine replacement products for smoking cessation, valued at manufacturer selling prices. Nicotine patches, inhalers, sprays and nicotine pouches are excluded. |
| Product Type | Nicotine gum; Nicotine mints and lozenges |
| Strength | Below 3 mg; 3 mg and above |
| Flavor | Mint; Fruit; Original and classic; Others |
| Distribution Channel | Pharmacies and drug stores; Supermarkets and hypermarkets; Convenience stores; Online retail; Others |
| Regions and profiled countries | North America, Latin America, Europe, East Asia, South Asia, Oceania, Middle East and Africa. Profiled countries: India, United States, Australia, United Kingdom |
| Companies covered | Kenvue Inc. (Kimberly-Clark Corporation); Perrigo Company plc; Dr. Reddy's Laboratories Ltd.; Cipla Health Ltd.; Rusan Pharma Ltd. |
| Quantitative Units | USD million |
Nicotine Gums and Mints Market by Segments
Nicotine Gums and Mints Market segmented by Product Type:
- Nicotine gum
- Nicotine mints and lozenges
Nicotine Gums and Mints Market segmented by Strength:
- Below 3 mg
- 3 mg and above
Nicotine Gums and Mints Market segmented by Flavor:
- Mint
- Fruit
- Original and classic
- Others
Nicotine Gums and Mints Market segmented by Distribution Channel:
- Pharmacies and drug stores
- Supermarkets and hypermarkets
- Convenience stores
- Online retail
- Others
Nicotine Gums and Mints Market by Region
- North America
- Latin America
- Europe
- East Asia
- South Asia
- Oceania
- Middle East
- Africa
- India
- United States
- Australia
- United Kingdom
Research Sources and Bibliography
- [1] World Health Organization. (2026, June 26). Tobacco and nicotine fact sheet. https://www.who.int/news-room/fact-sheets/detail/tobacco
- [2] The Times of India. (2026, April 15). Curbs on nicotine gums, lozenges may make quitting harder, say experts. https://timesofindia.indiatimes.com/india/experts-warn-proposed-nicotine-product-restrictions-could-hinder-smoking-cessation-efforts-in-india/articleshow/130274512.cms
- [3] Kimberly-Clark Corporation. (2026, November 2). Kimberly-Clark Completes Acquisition of Kenvue. https://www.investor.kimberly-clark.com/news-releases/news-release-details/kimberly-clark-completes-acquisition-kenvue-creating-preeminent
- [4] Kenvue Inc. (2026, August 6). Kenvue reports second quarter 2026 results. https://www.kenvue.com/media/kenvue-reports-second-quarter-2026-results
- [5] Dr. Reddy's Laboratories Ltd. (2024, September 30). Completion of acquisition of Nicotinell and related brands (Form 6-K, Exhibit 99.1). https://www.sec.gov/Archives/edgar/data/1135951/000157587224001038/drr0676_ex99-1.htm
- [6] Perrigo Company plc. (2026, November 4). Perrigo Reports Third Quarter 2026 Financial Results From Continuing Operations. https://investor.perrigo.com/2026-11-04-Perrigo-Reports-Third-Quarter-2026-Financial-Results-From-Continuing-Operations
- [7] Pharmabiz. (2026, September 24). DTAB asks govt not to approve new nicotine formulations henceforth. https://www.pharmabiz.com/NewsDetails.aspx?aid=190795&sid=1
- [8] Action on Smoking and Health (ASH). (2026, October). Smoking Facts at a Glance. https://ash.org.uk/resources/view/facts-at-a-glance
- [9] Centers for Disease Control and Prevention. (2024, July 25). Adult Smoking Cessation: United States, 2022. Morbidity and Mortality Weekly Report, 73(29). https://www.cdc.gov/mmwr/volumes/73/wr/mm7329a1.htm
- [10] National Center for Health Statistics, CDC. (2025 data release). FastStats: Cigarette Smoking and Electronic Cigarette Use. https://www.cdc.gov/nchs/fastats/smoking.htm
- [11] Jackson, S. E., Brown, J., Buss, V., & Shahab, L. (2025, January 17). Prevalence of Popular Smoking Cessation Aids in England and Associations With Quit Success. JAMA Network Open, 8(1). https://pmc.ncbi.nlm.nih.gov/articles/PMC11742533/
- [12] Ministry of Health and Family Welfare, Government of India. (2016-17 survey). Global Adult Tobacco Survey GATS 2 India Fact Sheet. https://assets.tobaccofreekids.org/global/pdfs/en/GATS_India_2016-17_FactSheet.pdf
- [13] PRS Legislative Research. (2019). The Prohibition of Electronic Cigarettes Bill, 2019. https://prsindia.org/billtrack/the-prohibition-of-electronic-cigarettes-production-manufacture-import-export-transport-sale-distribution-storage-and-advertisement-bill-2019
- [14] Australian Government Department of Health, Pharmaceutical Benefits Scheme. (2019-20 data). Post-market Review of medicines for smoking cessation, ToR 2: Utilisation of PBS-listed medicines for smoking cessation. https://www.pbs.gov.au/reviews/post-market-smoking-cessation-files/final-smoking-cessation-report-tor2.PDF
- [15] Butler, M., Australian Government. (2026, July 17). Australia's smoking rates declining. https://www.health.gov.au/ministers/the-hon-mark-butler-mp/media/australias-smoking-rates-declining?language=en
- [16] King's College London. (2026, March 5). Government Swap to stop scheme sees approximately 125,000 more people using vapes to try and quit smoking cigarettes. https://www.kcl.ac.uk/news/government-swap-to-stop-scheme-sees-approximately-125000-more-people-using-vapes-to-try-and-quit-smoking-cigarettes
- [17] Kenvue Inc. (2023, May 3). Prospectus, Form 424B4. https://www.sec.gov/Archives/edgar/data/1944048/000162828023015837/kenvue424b4.htm
- [18] Kenvue Inc. (2026, February). Annual Report on Form 10-K for the fiscal year ended December 28, 2025. https://www.sec.gov/Archives/edgar/data/1944048/000194404826000030/kvue-20251228.htm
- [19] Centers for Disease Control and Prevention. (2024, October 4). How to Use Nicotine Gum. Tips From Former Smokers. https://www.cdc.gov/tobacco/campaign/tips/quit-smoking/quit-smoking-medications/how-to-use-quit-smoking-medicines/how-to-use-nicotine-gum.html
- [20] Cipla Health Ltd. Nicotex. https://www.ciplahealth.in/brand/nicotex
- [21] Ahmed, A. (2025, May 14). Cipla Health launches mobile application Nicotex Begin for smokers. The Hindu BusinessLine. https://www.thehindubusinessline.com/companies/cipla-health-launches-mobile-application-nicotex-begin-for-smokers/article69575796.ece
- [22] Rusan Pharma Ltd. 2baconil Gum 2mg and 4mg Nicotine Gum. https://www.rusanpharma.com/2baconil-gum.html
- [23] U.S. Food and Drug Administration. (2025, January 16). FDA Authorizes Marketing of 20 ZYN Nicotine Pouch Products after Extensive Scientific Review. https://www.fda.gov/news-events/press-announcements/fda-authorizes-marketing-20-zyn-nicotine-pouch-products-after-extensive-scientific-review
- [24] Shams Al Yaoum. (2026, September 28). Hikma signs exclusive licensing and distribution agreement with Dr. Reddy's Laboratories for Nicotinell across MENA. https://shams-alyaoum.com/en/hikma-signs-exclusive-licensing-and-distribution-agreement-with-dr-reddys-laboratories-for-nicotinell-across-mena/
- [25] Kimberly-Clark Corporation. (2026). Kimberly-Clark Completes Acquisition of Kenvue, Creating the Preeminent Global Consumer Health and Wellness Leader [Press release via PR Newswire]. https://investor.kimberly-clark.com [official Form 8-K, November 2, 2026, cited by credenceresearch.com and panabee.com]
- [26] Hikma Pharmaceuticals / Dr. Reddy’s Laboratories. (2026, September 28). Hikma signs exclusive licensing and distribution agreement with Dr. Reddy’s Laboratories for Nicotinell across MENA. https://www.zawya.com/en/press-release/companies-news/hikma-signs-exclusive-licensing-and-distribution-agreement-with-dr.-reddys-laboratories-for-nicotinell-across-mena-1363870
Table of Content
- Key Takeaways
- Market Size and CAGR
- Top Growth Driver
- Fastest Growing Segment
- Leading Region
- Key Companies
- Emerging Opportunities
- Executive Summary
- Global Market Outlook
- Demand-side Trends
- Supply-side Trends
- Technology Roadmap Analysis
- Analysis and Recommendations
- Analyst Perspective (What is happening? Why now? What should investors know?)
- Key Questions Answered
- How large is the market?
- What is the CAGR?
- What are key trends?
- Which region dominates?
- Who are the leaders?
Read More...
- Market Overview
- Market Coverage / Taxonomy
- Market Definition / Scope / Limitations
- Research Methodology
- Chapter Orientation
- Analytical Lens and Working Hypotheses
- Market Structure, Signals, and Trend Drivers
- Benchmarking and Cross-market Comparability
- Market Sizing, Forecasting, and Opportunity Mapping
- Research Design and Evidence Framework
- Desk Research Programme (Secondary Evidence)
- Expert Input and Fieldwork (Primary Evidence)
- Tooling, Models, and Reference Databases
- Data Engineering and Model Build
- Quality Assurance and Audit Trail
- Market Background
- Market Dynamics (Drivers, Restraints, Opportunity, Trends)
- Scenario Forecast (Optimistic, Likely, Conservative)
- Impact Analysis
- AI Impact
- Sustainability Impact
- Regulatory Impact
- Technology Impact
- Consumer / Buyer Analysis
- Purchase Drivers
- Adoption Barriers
- Buyer Journey
- Opportunity Map Analysis
- Product Life Cycle Analysis
- Supply Chain Analysis
- Investment Feasibility Matrix
- Value Chain Analysis
- PESTLE and Porter's Analysis
- Regulatory Landscape
- Regional Parent Market Outlook
- Production and Consumption Statistics
- Import and Export Statistics
- Global Market Analysis and Forecast, 2021 to 2036
- Historical Market Size Value (USD Million) Analysis, 2021 to 2025
- Current and Future Market Size Value (USD Million) Projections, 2026 to 2036
- Y-o-Y Growth Trend Analysis
- Absolute $ Opportunity Analysis
- Global Market Pricing Analysis, 2021 to 2036
- Global Market Analysis and Forecast, By Product Type, 2021 to 2036
- Introduction / Key Findings
- Historical Market Size Value (USD Million) Analysis By Product Type, 2021 to 2025
- Current and Future Market Size Value (USD Million) Analysis and Forecast By Product Type, 2026 to 2036
- Nicotine gum
- Nicotine mints and lozenges
- Y-o-Y Growth Trend Analysis By Product Type, 2021 to 2025
- Absolute $ Opportunity Analysis By Product Type, 2026 to 2036
- Global Market Analysis and Forecast, By Strength, 2021 to 2036
- Introduction / Key Findings
- Historical Market Size Value (USD Million) Analysis By Strength, 2021 to 2025
- Current and Future Market Size Value (USD Million) Analysis and Forecast By Strength, 2026 to 2036
- Below 3 mg
- 3 mg and above
- Y-o-Y Growth Trend Analysis By Strength, 2021 to 2025
- Absolute $ Opportunity Analysis By Strength, 2026 to 2036
- Global Market Analysis and Forecast, By Flavor, 2021 to 2036
- Introduction / Key Findings
- Historical Market Size Value (USD Million) Analysis By Flavor, 2021 to 2025
- Current and Future Market Size Value (USD Million) Analysis and Forecast By Flavor, 2026 to 2036
- Mint
- Fruit
- Original and classic
- Others
- Y-o-Y Growth Trend Analysis By Flavor, 2021 to 2025
- Absolute $ Opportunity Analysis By Flavor, 2026 to 2036
- Global Market Analysis and Forecast, By Distribution Channel, 2021 to 2036
- Introduction / Key Findings
- Historical Market Size Value (USD Million) Analysis By Distribution Channel, 2021 to 2025
- Current and Future Market Size Value (USD Million) Analysis and Forecast By Distribution Channel, 2026 to 2036
- Pharmacies and drug stores
- Supermarkets and hypermarkets
- Convenience stores
- Online retail
- Others
- Y-o-Y Growth Trend Analysis By Distribution Channel, 2021 to 2025
- Absolute $ Opportunity Analysis By Distribution Channel, 2026 to 2036
- Global Market Analysis and Forecast, By Region, 2021 to 2036
- Introduction
- Historical Market Size Value (USD Million) Analysis By Region, 2021 to 2025
- Current Market Size Value (USD Million) Analysis and Forecast By Region, 2026 to 2036
- North America
- Latin America
- Europe
- East Asia
- South Asia
- Oceania
- Middle East
- Africa
- Market Attractiveness Analysis By Region
- North America Market Analysis and Forecast, By Country, 2021 to 2036
- Historical Market Size Value (USD Million) Trend Analysis By Market Taxonomy, 2021 to 2025
- Market Size Value (USD Million) Forecast By Market Taxonomy, 2026 to 2036
- By Country
- By Product Type
- By Strength
- By Flavor
- By Distribution Channel
- Market Attractiveness Analysis
- By Country
- By Product Type
- By Strength
- By Flavor
- By Distribution Channel
- Key Takeaways
- Latin America Market Analysis and Forecast, By Country
- Historical Market Size Value (USD Million) Trend Analysis By Market Taxonomy, 2021 to 2025
- Market Size Value (USD Million) Forecast By Market Taxonomy, 2026 to 2036
- By Country
- By Product Type
- By Strength
- By Flavor
- By Distribution Channel
- Market Attractiveness Analysis
- By Country
- By Product Type
- By Strength
- By Flavor
- By Distribution Channel
- Key Takeaways
- Europe Market Analysis and Forecast, By Country
- Historical Market Size Value (USD Million) Trend Analysis By Market Taxonomy, 2021 to 2025
- Market Size Value (USD Million) Forecast By Market Taxonomy, 2026 to 2036
- By Country
- By Product Type
- By Strength
- By Flavor
- By Distribution Channel
- Market Attractiveness Analysis
- By Country
- By Product Type
- By Strength
- By Flavor
- By Distribution Channel
- Key Takeaways
- East Asia Market Analysis and Forecast, By Country
- Historical Market Size Value (USD Million) Trend Analysis By Market Taxonomy, 2021 to 2025
- Market Size Value (USD Million) Forecast By Market Taxonomy, 2026 to 2036
- By Country
- By Product Type
- By Strength
- By Flavor
- By Distribution Channel
- Market Attractiveness Analysis
- By Country
- By Product Type
- By Strength
- By Flavor
- By Distribution Channel
- Key Takeaways
- South Asia Market Analysis and Forecast, By Country
- Historical Market Size Value (USD Million) Trend Analysis By Market Taxonomy, 2021 to 2025
- Market Size Value (USD Million) Forecast By Market Taxonomy, 2026 to 2036
- By Country
- By Product Type
- By Strength
- By Flavor
- By Distribution Channel
- Market Attractiveness Analysis
- By Country
- By Product Type
- By Strength
- By Flavor
- By Distribution Channel
- Key Takeaways
- Oceania Market Analysis and Forecast, By Country
- Historical Market Size Value (USD Million) Trend Analysis By Market Taxonomy, 2021 to 2025
- Market Size Value (USD Million) Forecast By Market Taxonomy, 2026 to 2036
- By Country
- By Product Type
- By Strength
- By Flavor
- By Distribution Channel
- Market Attractiveness Analysis
- By Country
- By Product Type
- By Strength
- By Flavor
- By Distribution Channel
- Key Takeaways
- Middle East Market Analysis and Forecast, By Country
- Historical Market Size Value (USD Million) Trend Analysis By Market Taxonomy, 2021 to 2025
- Market Size Value (USD Million) Forecast By Market Taxonomy, 2026 to 2036
- By Country
- By Product Type
- By Strength
- By Flavor
- By Distribution Channel
- Market Attractiveness Analysis
- By Country
- By Product Type
- By Strength
- By Flavor
- By Distribution Channel
- Key Takeaways
- Africa Market Analysis and Forecast, By Country
- Historical Market Size Value (USD Million) Trend Analysis By Market Taxonomy, 2021 to 2025
- Market Size Value (USD Million) Forecast By Market Taxonomy, 2026 to 2036
- By Country
- India
- United States
- Australia
- United Kingdom
- By Product Type
- By Strength
- By Flavor
- By Distribution Channel
- By Country
- Market Attractiveness Analysis
- By Country
- By Product Type
- By Strength
- By Flavor
- By Distribution Channel
- Key Takeaways
- Key Countries Market Analysis
- United States
- Pricing Analysis
- Market Share Analysis, 2025
- By Product Type
- By Strength
- By Flavor
- By Distribution Channel
- United Kingdom
- Pricing Analysis
- Market Share Analysis, 2025
- By Product Type
- By Strength
- By Flavor
- By Distribution Channel
- India
- Pricing Analysis
- Market Share Analysis, 2025
- By Product Type
- By Strength
- By Flavor
- By Distribution Channel
- Australia
- Pricing Analysis
- Market Share Analysis, 2025
- By Product Type
- By Strength
- By Flavor
- By Distribution Channel
- United States
- Market Structure Analysis
- Competition Dashboard
- Competition Benchmarking
- Market Share Analysis of Top Players
- By Regional
- By Product Type
- By Strength
- By Flavor
- By Distribution Channel
- Emerging Startups
- Innovation Benchmarking
- Competition Analysis
- Competition Deep Dive
- Kenvue Inc. (Kimberly-Clark Corporation)
- Overview
- Product Portfolio
- Profitability by Market Segments
- Sales Footprint
- Strategy Overview
- Marketing Strategy
- Product Strategy
- Channel Strategy
- Perrigo Company plc
- Dr. Reddy's Laboratories Ltd.
- Cipla Health Ltd.
- Rusan Pharma Ltd.
- Kenvue Inc. (Kimberly-Clark Corporation)
- Case Studies
- Success Stories
- Recent Developments
- Competition Deep Dive
- Assumptions & Acronyms Used
List of Tables
- Table 1: Global Market Value (USD Million) Forecast by Region, 2021 to 2036
- Table 2: Global Market Value (USD Million) Forecast by Product Type, 2021 to 2036
- Table 3: Global Market Value (USD Million) Forecast by Strength, 2021 to 2036
- Table 4: Global Market Value (USD Million) Forecast by Flavor, 2021 to 2036
- Table 5: Global Market Value (USD Million) Forecast by Distribution Channel, 2021 to 2036
- Table 6: North America Market Value (USD Million) Forecast by Country, 2021 to 2036
- Table 7: North America Market Value (USD Million) Forecast by Product Type, 2021 to 2036
- Table 8: North America Market Value (USD Million) Forecast by Strength, 2021 to 2036
- Table 9: North America Market Value (USD Million) Forecast by Flavor, 2021 to 2036
- Table 10: North America Market Value (USD Million) Forecast by Distribution Channel, 2021 to 2036
- Table 11: Latin America Market Value (USD Million) Forecast by Country, 2021 to 2036
- Table 12: Latin America Market Value (USD Million) Forecast by Product Type, 2021 to 2036
- Table 13: Latin America Market Value (USD Million) Forecast by Strength, 2021 to 2036
- Table 14: Latin America Market Value (USD Million) Forecast by Flavor, 2021 to 2036
- Table 15: Latin America Market Value (USD Million) Forecast by Distribution Channel, 2021 to 2036
- Table 16: Europe Market Value (USD Million) Forecast by Country, 2021 to 2036
- Table 17: Europe Market Value (USD Million) Forecast by Product Type, 2021 to 2036
- Table 18: Europe Market Value (USD Million) Forecast by Strength, 2021 to 2036
- Table 19: Europe Market Value (USD Million) Forecast by Flavor, 2021 to 2036
- Table 20: Europe Market Value (USD Million) Forecast by Distribution Channel, 2021 to 2036
- Table 21: East Asia Market Value (USD Million) Forecast by Country, 2021 to 2036
- Table 22: East Asia Market Value (USD Million) Forecast by Product Type, 2021 to 2036
- Table 23: East Asia Market Value (USD Million) Forecast by Strength, 2021 to 2036
- Table 24: East Asia Market Value (USD Million) Forecast by Flavor, 2021 to 2036
- Table 25: East Asia Market Value (USD Million) Forecast by Distribution Channel, 2021 to 2036
- Table 26: South Asia Market Value (USD Million) Forecast by Country, 2021 to 2036
- Table 27: South Asia Market Value (USD Million) Forecast by Product Type, 2021 to 2036
- Table 28: South Asia Market Value (USD Million) Forecast by Strength, 2021 to 2036
- Table 29: South Asia Market Value (USD Million) Forecast by Flavor, 2021 to 2036
- Table 30: South Asia Market Value (USD Million) Forecast by Distribution Channel, 2021 to 2036
- Table 31: Oceania Market Value (USD Million) Forecast by Country, 2021 to 2036
- Table 32: Oceania Market Value (USD Million) Forecast by Product Type, 2021 to 2036
- Table 33: Oceania Market Value (USD Million) Forecast by Strength, 2021 to 2036
- Table 34: Oceania Market Value (USD Million) Forecast by Flavor, 2021 to 2036
- Table 35: Oceania Market Value (USD Million) Forecast by Distribution Channel, 2021 to 2036
- Table 36: Middle East Market Value (USD Million) Forecast by Country, 2021 to 2036
- Table 37: Middle East Market Value (USD Million) Forecast by Product Type, 2021 to 2036
- Table 38: Middle East Market Value (USD Million) Forecast by Strength, 2021 to 2036
- Table 39: Middle East Market Value (USD Million) Forecast by Flavor, 2021 to 2036
- Table 40: Middle East Market Value (USD Million) Forecast by Distribution Channel, 2021 to 2036
- Table 41: Africa Market Value (USD Million) Forecast by Country, 2021 to 2036
- Table 42: Africa Market Value (USD Million) Forecast by Product Type, 2021 to 2036
- Table 43: Africa Market Value (USD Million) Forecast by Strength, 2021 to 2036
- Table 44: Africa Market Value (USD Million) Forecast by Flavor, 2021 to 2036
- Table 45: Africa Market Value (USD Million) Forecast by Distribution Channel, 2021 to 2036
List of Figures
- Figure 1: Global Market Pricing Analysis
- Figure 2: Global Market Value (USD Million) Forecast 2021-2036
- Figure 3: Global Market Value Share and BPS Analysis by Product Type, 2026 and 2036
- Figure 4: Global Market Y-o-Y Growth Comparison by Product Type, 2026-2036
- Figure 5: Global Market Attractiveness Analysis by Product Type
- Figure 6: Global Market Value Share and BPS Analysis by Strength, 2026 and 2036
- Figure 7: Global Market Y-o-Y Growth Comparison by Strength, 2026-2036
- Figure 8: Global Market Attractiveness Analysis by Strength
- Figure 9: Global Market Value Share and BPS Analysis by Flavor, 2026 and 2036
- Figure 10: Global Market Y-o-Y Growth Comparison by Flavor, 2026-2036
- Figure 11: Global Market Attractiveness Analysis by Flavor
- Figure 12: Global Market Value Share and BPS Analysis by Distribution Channel, 2026 and 2036
- Figure 13: Global Market Y-o-Y Growth Comparison by Distribution Channel, 2026-2036
- Figure 14: Global Market Attractiveness Analysis by Distribution Channel
- Figure 15: Global Market Value (USD Million) Share and BPS Analysis by Region, 2026 and 2036
- Figure 16: Global Market Y-o-Y Growth Comparison by Region, 2026-2036
- Figure 17: Global Market Attractiveness Analysis by Region
- Figure 18: North America Market Incremental Dollar Opportunity, 2026-2036
- Figure 19: Latin America Market Incremental Dollar Opportunity, 2026-2036
- Figure 20: Europe Market Incremental Dollar Opportunity, 2026-2036
- Figure 21: East Asia Market Incremental Dollar Opportunity, 2026-2036
- Figure 22: South Asia Market Incremental Dollar Opportunity, 2026-2036
- Figure 23: Oceania Market Incremental Dollar Opportunity, 2026-2036
- Figure 24: Middle East Market Incremental Dollar Opportunity, 2026-2036
- Figure 25: Africa Market Incremental Dollar Opportunity, 2026-2036
- Figure 26: North America Market Value Share and BPS Analysis by Country, 2026 and 2036
- Figure 27: North America Market Value Share and BPS Analysis by Product Type, 2026 and 2036
- Figure 28: North America Market Y-o-Y Growth Comparison by Product Type, 2026-2036
- Figure 29: North America Market Attractiveness Analysis by Product Type
- Figure 30: North America Market Value Share and BPS Analysis by Strength, 2026 and 2036
- Figure 31: North America Market Y-o-Y Growth Comparison by Strength, 2026-2036
- Figure 32: North America Market Attractiveness Analysis by Strength
- Figure 33: North America Market Value Share and BPS Analysis by Flavor, 2026 and 2036
- Figure 34: North America Market Y-o-Y Growth Comparison by Flavor, 2026-2036
- Figure 35: North America Market Attractiveness Analysis by Flavor
- Figure 36: North America Market Value Share and BPS Analysis by Distribution Channel, 2026 and 2036
- Figure 37: North America Market Y-o-Y Growth Comparison by Distribution Channel, 2026-2036
- Figure 38: North America Market Attractiveness Analysis by Distribution Channel
- Figure 39: Latin America Market Value Share and BPS Analysis by Country, 2026 and 2036
- Figure 40: Latin America Market Value Share and BPS Analysis by Product Type, 2026 and 2036
- Figure 41: Latin America Market Y-o-Y Growth Comparison by Product Type, 2026-2036
- Figure 42: Latin America Market Attractiveness Analysis by Product Type
- Figure 43: Latin America Market Value Share and BPS Analysis by Strength, 2026 and 2036
- Figure 44: Latin America Market Y-o-Y Growth Comparison by Strength, 2026-2036
- Figure 45: Latin America Market Attractiveness Analysis by Strength
- Figure 46: Latin America Market Value Share and BPS Analysis by Flavor, 2026 and 2036
- Figure 47: Latin America Market Y-o-Y Growth Comparison by Flavor, 2026-2036
- Figure 48: Latin America Market Attractiveness Analysis by Flavor
- Figure 49: Latin America Market Value Share and BPS Analysis by Distribution Channel, 2026 and 2036
- Figure 50: Latin America Market Y-o-Y Growth Comparison by Distribution Channel, 2026-2036
- Figure 51: Latin America Market Attractiveness Analysis by Distribution Channel
- Figure 52: Europe Market Value Share and BPS Analysis by Country, 2026 and 2036
- Figure 53: Europe Market Value Share and BPS Analysis by Product Type, 2026 and 2036
- Figure 54: Europe Market Y-o-Y Growth Comparison by Product Type, 2026-2036
- Figure 55: Europe Market Attractiveness Analysis by Product Type
- Figure 56: Europe Market Value Share and BPS Analysis by Strength, 2026 and 2036
- Figure 57: Europe Market Y-o-Y Growth Comparison by Strength, 2026-2036
- Figure 58: Europe Market Attractiveness Analysis by Strength
- Figure 59: Europe Market Value Share and BPS Analysis by Flavor, 2026 and 2036
- Figure 60: Europe Market Y-o-Y Growth Comparison by Flavor, 2026-2036
- Figure 61: Europe Market Attractiveness Analysis by Flavor
- Figure 62: Europe Market Value Share and BPS Analysis by Distribution Channel, 2026 and 2036
- Figure 63: Europe Market Y-o-Y Growth Comparison by Distribution Channel, 2026-2036
- Figure 64: Europe Market Attractiveness Analysis by Distribution Channel
- Figure 65: East Asia Market Value Share and BPS Analysis by Country, 2026 and 2036
- Figure 66: East Asia Market Value Share and BPS Analysis by Product Type, 2026 and 2036
- Figure 67: East Asia Market Y-o-Y Growth Comparison by Product Type, 2026-2036
- Figure 68: East Asia Market Attractiveness Analysis by Product Type
- Figure 69: East Asia Market Value Share and BPS Analysis by Strength, 2026 and 2036
- Figure 70: East Asia Market Y-o-Y Growth Comparison by Strength, 2026-2036
- Figure 71: East Asia Market Attractiveness Analysis by Strength
- Figure 72: East Asia Market Value Share and BPS Analysis by Flavor, 2026 and 2036
- Figure 73: East Asia Market Y-o-Y Growth Comparison by Flavor, 2026-2036
- Figure 74: East Asia Market Attractiveness Analysis by Flavor
- Figure 75: East Asia Market Value Share and BPS Analysis by Distribution Channel, 2026 and 2036
- Figure 76: East Asia Market Y-o-Y Growth Comparison by Distribution Channel, 2026-2036
- Figure 77: East Asia Market Attractiveness Analysis by Distribution Channel
- Figure 78: South Asia Market Value Share and BPS Analysis by Country, 2026 and 2036
- Figure 79: South Asia Market Value Share and BPS Analysis by Product Type, 2026 and 2036
- Figure 80: South Asia Market Y-o-Y Growth Comparison by Product Type, 2026-2036
- Figure 81: South Asia Market Attractiveness Analysis by Product Type
- Figure 82: South Asia Market Value Share and BPS Analysis by Strength, 2026 and 2036
- Figure 83: South Asia Market Y-o-Y Growth Comparison by Strength, 2026-2036
- Figure 84: South Asia Market Attractiveness Analysis by Strength
- Figure 85: South Asia Market Value Share and BPS Analysis by Flavor, 2026 and 2036
- Figure 86: South Asia Market Y-o-Y Growth Comparison by Flavor, 2026-2036
- Figure 87: South Asia Market Attractiveness Analysis by Flavor
- Figure 88: South Asia Market Value Share and BPS Analysis by Distribution Channel, 2026 and 2036
- Figure 89: South Asia Market Y-o-Y Growth Comparison by Distribution Channel, 2026-2036
- Figure 90: South Asia Market Attractiveness Analysis by Distribution Channel
- Figure 91: Oceania Market Value Share and BPS Analysis by Country, 2026 and 2036
- Figure 92: Oceania Market Value Share and BPS Analysis by Product Type, 2026 and 2036
- Figure 93: Oceania Market Y-o-Y Growth Comparison by Product Type, 2026-2036
- Figure 94: Oceania Market Attractiveness Analysis by Product Type
- Figure 95: Oceania Market Value Share and BPS Analysis by Strength, 2026 and 2036
- Figure 96: Oceania Market Y-o-Y Growth Comparison by Strength, 2026-2036
- Figure 97: Oceania Market Attractiveness Analysis by Strength
- Figure 98: Oceania Market Value Share and BPS Analysis by Flavor, 2026 and 2036
- Figure 99: Oceania Market Y-o-Y Growth Comparison by Flavor, 2026-2036
- Figure 100: Oceania Market Attractiveness Analysis by Flavor
- Figure 101: Oceania Market Value Share and BPS Analysis by Distribution Channel, 2026 and 2036
- Figure 102: Oceania Market Y-o-Y Growth Comparison by Distribution Channel, 2026-2036
- Figure 103: Oceania Market Attractiveness Analysis by Distribution Channel
- Figure 104: Middle East Market Value Share and BPS Analysis by Country, 2026 and 2036
- Figure 105: Middle East Market Value Share and BPS Analysis by Product Type, 2026 and 2036
- Figure 106: Middle East Market Y-o-Y Growth Comparison by Product Type, 2026-2036
- Figure 107: Middle East Market Attractiveness Analysis by Product Type
- Figure 108: Middle East Market Value Share and BPS Analysis by Strength, 2026 and 2036
- Figure 109: Middle East Market Y-o-Y Growth Comparison by Strength, 2026-2036
- Figure 110: Middle East Market Attractiveness Analysis by Strength
- Figure 111: Middle East Market Value Share and BPS Analysis by Flavor, 2026 and 2036
- Figure 112: Middle East Market Y-o-Y Growth Comparison by Flavor, 2026-2036
- Figure 113: Middle East Market Attractiveness Analysis by Flavor
- Figure 114: Middle East Market Value Share and BPS Analysis by Distribution Channel, 2026 and 2036
- Figure 115: Middle East Market Y-o-Y Growth Comparison by Distribution Channel, 2026-2036
- Figure 116: Middle East Market Attractiveness Analysis by Distribution Channel
- Figure 117: Africa Market Value Share and BPS Analysis by Country, 2026 and 2036
- Figure 118: Africa Market Value Share and BPS Analysis by Product Type, 2026 and 2036
- Figure 119: Africa Market Y-o-Y Growth Comparison by Product Type, 2026-2036
- Figure 120: Africa Market Attractiveness Analysis by Product Type
- Figure 121: Africa Market Value Share and BPS Analysis by Strength, 2026 and 2036
- Figure 122: Africa Market Y-o-Y Growth Comparison by Strength, 2026-2036
- Figure 123: Africa Market Attractiveness Analysis by Strength
- Figure 124: Africa Market Value Share and BPS Analysis by Flavor, 2026 and 2036
- Figure 125: Africa Market Y-o-Y Growth Comparison by Flavor, 2026-2036
- Figure 126: Africa Market Attractiveness Analysis by Flavor
- Figure 127: Africa Market Value Share and BPS Analysis by Distribution Channel, 2026 and 2036
- Figure 128: Africa Market Y-o-Y Growth Comparison by Distribution Channel, 2026-2036
- Figure 129: Africa Market Attractiveness Analysis by Distribution Channel
- Figure 130: Global Market - Tier Structure Analysis
- Figure 131: Global Market - Company Share Analysis
Frequently Asked Questions
How big is the Nicotine Gums and Mints Market in 2026?
FMI estimates the market at USD 1,900 million in 2026, up from USD 1,800 million in 2025. It is forecast to reach USD 3,245 million by 2036 at a 5.5% CAGR.
Which product type leads in 2026?
Nicotine gum leads with 82.0% of 2026 revenue by product type. Mints and lozenges hold 18.0%.
Which flavor and channel lead in 2026?
Mint leads by flavor with 45.0%, and pharmacies and drug stores lead by distribution channel with 61.0%.
Which country is forecast to grow fastest through 2036?
India has the highest forecast CAGR among the profiled countries at 6.0% during 2026 to 2036, followed by the United States at 5.3%. These are FMI forecasts and are not rates reported by the cited public bodies.
Preview the report firsthand - request a free sample
Get SampleGet the brochure for pricing and purchase details.
Get PDF
