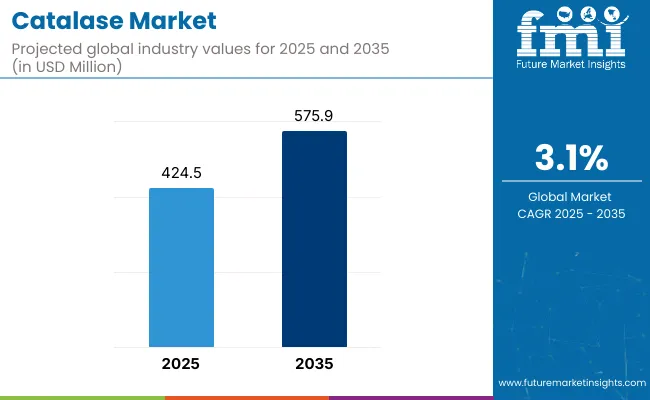
Global Catalase is estimated to be worth USD 424.5 million by 2025 and is projected to reach USD 575.9 million by 2035, reflecting a CAGR of 3.1% over the assessment period 2025 to 2035.
| Attributes | Description |
|---|---|
| Estimated Global Catalase Industry Size (2025E) | USD 424.5 million |
| Projected Global Catalase Industry Value (2035F) | USD 575.9 million |
| Value-based CAGR (2025 to 2035) | 3.1% |
Global catalase manufacturers are faced with several challenges regarding consumption and manufacturing. The food and beverage segment is expanding where catalase is required in procedures such as juice clarification and hydrogen peroxide degradation.
Moreover, enhancing the concept of a sustainable environment promotes the application of enzymatic strategies in creating textiles, minimizing detrimental chemical utilization. Many of the active manufacturers, including Novozymes, are constantly working on the development of new products and new segmental products due to increasing interest in the application of biotechnology industries.
The increased focus on natural and organic in personal care also supports the use of catalase in formulations. Moreover, regulation and quality are important because the manufacturers try to fulfill strict production requirements. Additionally, major attention is given to these aspects to determine present and future possibilities for catalase production for different segmental uses.
The table below presents a comparative assessment of the variation in CAGR over six months for the base year (2024) and current year (2025) for Global Catalase. This analysis reveals crucial shifts in manufacturers' performance and indicates revenue realization patterns, thus providing stakeholders with a better vision of the ecosystem growth trajectory over the year. The first half of the year, or H1, spans from January to June. The second half, H2, includes the months from July to December.
| Particular | Value CAGR |
|---|---|
| H1 | 2.7% (2025 to 2035) |
| H2 | 3.4% (2025 to 2035) |
| H1 | 3.0% (2026 to 2036) |
| H2 | 3.6% (2026 to 2036) |
The above table presents the expected CAGR for the Global Catalase segment over several semi-annual periods from 2025 to 2035. In the first half (H1) of the decade from 2025 to 2035, the business is predicted to surge at a CAGR of 2.7%, followed by a slightly variable growth rate of 3.4% in the second half (H2). Moving into the subsequent period, the CAGR is projected to change somewhat to 3.0% in the first half and remain relatively moderate at 3.6% in the second half.
| Segment | Value Share (2025) |
|---|---|
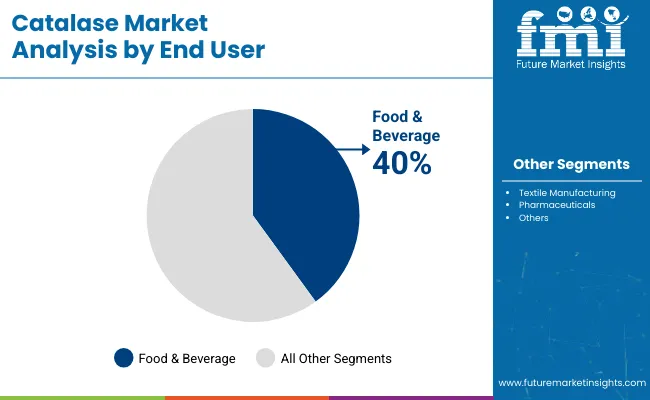
| Food & Beverage (By End User) | 39.7% |
Manufacturers of food and beverages are coming to realize the value of using catalase and thus are now demanding it in their various uses. For example, in Coca-Cola, the company uses catalase in its production, to safely neutralize hydrogen peroxide which is used for cleaning purposes to improve the safety of the products and their freshness.
Similarly for its dairy segment catalase has been implemented to extend the shelf life of products such as milk and yogurt. Through the decomposition of remaining hydrogen peroxide as used in some of its cleaning agents, the company gains enhanced safety measures as well as improved taste. Catalase is also being used by Kraft Heinz in its condiments production as well.
The enzyme enables the breakdown of the leftover hydrogen peroxide in the process thereby coming up with a clean product to meet the customer's palate on issues of hygiene. However, another honored component, which is used in juice processing at PepsiCo, is catalase. This application also ensures that flavors and nutrients of the juices are retained without the use of chemicals hence making the company a conservationist one.
| Segment | Value Share (2025) |
|---|---|
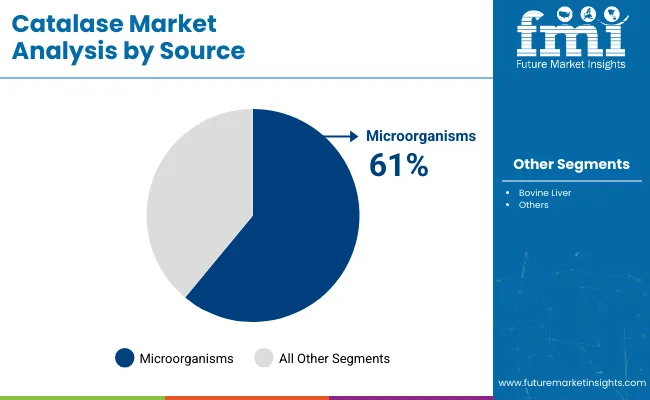
| Microorganisms (By Source) | 60.6% |
Different microorganisms have come out as promising sources of catalase owing to the versatility of the enzyme in today’s world. Of all of these types of microorganisms, bacteria, and fungi are most noticeable due to their high levels of catalase production. Of all the microorganisms Aspergillus niger is possibly the favorite in the production of catalase due to the high enzyme yields produced by the filamentous fungi.
This organism is preferred due to the exhaustion of high turnover of catalase as applicable in the foods and biotechnology industries. This goes further to make the fungus very suitable to grow in different stations, making the large-scale production of enzymes from fungi possible. Catalase and another enzyme producer called bacteria Bacillus subtilis is another interesting example.
This microorganism is desired for fast growth and offers the potential to synthesize enzymes under various conditions, and as such is versatile. Furthermore, Pseudomonas aeruginosa is well known as a catalase producer and this makes it suitable for several biotechnological applications.
These microorganisms are grown in an environment that favors high levels of catalase production to meet the many demands from the food segment, to issues involving environmental conservation. Due to their effectiveness and versatility, they are essential supply sources for this essential enzyme and provide enough products demanded by many fields for sustainable development.
Catalase Enzymes Provide Solution to Boost Up Efficiency and Quality of Food and Beverages.
Catalase enzymes have significant importance in the food and beverage industries especially to eliminate hydrogen peroxide which is found widely in bleaching agents. Catalase proves useful for decomposing hydrogen peroxide into water and oxygen effectively contributing to product safety and flavor stability.
As an enzymatic process, it has a significant role in juice production since it helps to clear the produced juice without distorting the nature of the juices. Novozymes that use catalase in their formulations and which have increased efficiency in operation and time taken to process.
Besides reducing chemical residues to acceptable levels, the incorporation of catalase has the advantages of providing a clean label and answering current manufacturing trends of producing safer and more attractive products for consumers. In addition, the mild conditions in which the enzyme can function make it environmentally friendly because they lessen energy use during production.
The global demand for the enzyme requires continued technological advancements.
The synthesis of the catalase enzymes has advanced to higher production levels due to the enhanced global need for the enzymes. In the past, production was mainly through tissues of animals, but today, microbial fermentation is used, the microbial advantage being they undergo cyclic growth at higher rates than animal tissues, and are bacteria and fungi.
This shift provides more feasible production processes and less dependence on animal-based resources. Sophisticated fermentation processes allow the extractor to achieve the right quantities of enzymes, allowing for quality production. Fermentation can produce catalase through companies such as Amano Enzyme to meet high safety and quality requirements.
Genetically modified organisms (GMOs) are also increasingly adopted to increase the activity and stability of enzymes. With current and potential uses of catalase increasing in fronts spanning commercial, industrial, and medicinal, the production method is likely to adopt new ways that will meet consumer/industrial demands.
The textile unit has benefited from the development of the catalase enzyme.
The collaboration between catalase manufacturers and food scientists opens up new ideal opportunities for food product applications. All those tie-ups interested in furthering the functional benefits obtained by the use of calcium proponent beyond the scope of the preservative are now very much able to work together.
It has been revealed to food scientists that it provides various udder formulations, primarily in terms of texture improvement and flavor retention, which, in the case of traditional forms, are regular baked products and meat products. These collaborations address the challenge of designing products to meet particular consumer needs, such as gluten-free or organic. Integration of Catalase into novel, innovative applications has been facilitated by recent advances in food processing technologies, which will only increase the effectiveness and functionality of this chemical resource.
The collaborations will also be able to give the manufacturers leads on the upcoming trends and demands of the consumer so they will not be left behind in the future. Not only do these synergisms promise much in the area of product innovation, but they also reaffirm the significance of Catalase in the dynamic food segment.
Global sales increased at a CAGR of 2.8% from 2020 to 2024. For the next ten years (2025 to 2035), projections are that expenditure on such products will rise at 3.1% CAGR.
From 2020 to 2024, various global catalase manufacturers have realized various trends making rounds in the industries, such as the rising demand for sustainable solutions and clean labels. Other drivers embrace change in the consumer experience, latently extending the catalase market in the food and beverages industries.
In the chemical industries, development in enzyme formulations has assisted in increasing the stability of the drugs and increasing the potency of the acting enzyme, such as catalase, in the manufacturing and formulation of drugs. Also, the biopharmaceuticals have acted as a stimulus for the catalase to be applied in the therapeutic activities.
Enzyme makers are exploring top-notch production processes like fermentation technology to enroll in improved enzyme efficiency and conform to the current regulation platform to set up a long-standing growth pattern.
From 2025 to 2035, the trends for global catalase manufacturers are the increasing use of biotechnology techniques and better fermentation methods. It appears that demand factors determine innovation, including sustainability, clean-label products, and legislation. Newer generation microbial fermentation catalysis is permitting higher yields and efficient production thereby making the use of catalase possible at lower costs.
In addition, there are new chances of demand in the pharmaceutical, food, and textile segments since the role of catalase is to make their products better in quality and, at the same time, minimize the negative effects on the environment. Such advancements place catalase in a strategic enzymatic role in various applications under fast-changing industrial conditions.
Tier 1, It can be seen that a few large-scale firms, including Novozymes and DuPont, take the largest industrial share of global catalase primarily due to their technological advantages in fermentation and exclusive microbial technology. These companies apply best-optimized fermentation strategies to generate high enzyme yields as well as quality.
They obtain most of their catalase from recombinant microorganisms, which makes operations highly efficient and cheaper. The high levels of research and development imply that Tier 1 firms can innovate continuously, thus leading to massive revenues and growth of industrial share because the needs of different industries in the economy can be addressed as required.
Tier 2 manufacturers such as Amano Enzyme and BIocatalysts target specific and specialty markets. To optimize the quality and the cost, they use fermentation techniques that are both old and new. Competition among these companies sourcing catalase from microbial fermentation as well as from plant origin primarily depends on the customer's requirement profile in the food and beverage and textile industries.
Tier 3 manufacturers, especially the small regional producers, some of which do not use very elaborate fermentation processes and employ substandard biological sources in the form of wild-type strains of bacteria or fungi. Such organizations normally have comparatively low manufacturing capabilities and cater to specific regions that restrain their sales and, hence, earnings capabilities.
Still, they might look for opportunities in growth initiatives or given customers’ needs for affordable approaches. The key reason for growth is suppliers adapt and advance in fermentation techniques, which mainly aids in the growth of the catalase industries in the long run.
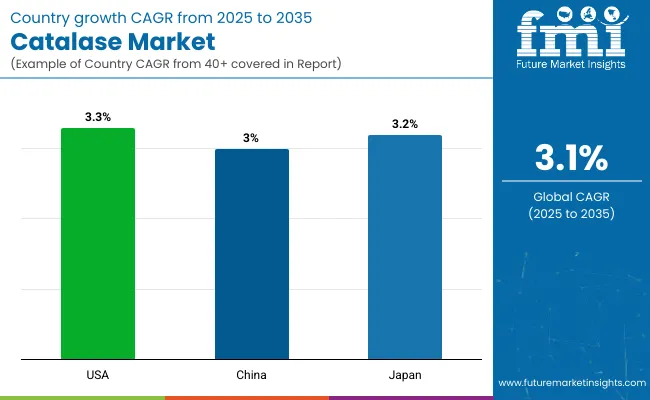
The following table shows the estimated growth rates of the top three territories. The USA, China, and Japan are set to exhibit high consumption, recording CAGRs of 3.3%, 3.0%, and 3.2%, respectively, through 2035.
| Countries | CAGR, 2025 to 2035 |
|---|---|
| The USA | 3.3% |
| China | 3.0% |
| Japan | 3.2% |
The sector of manufacturing catalase in the United States is evolving solely in the light of new trends and changing demand factors with consumers placing higher emphasis on the use of environment-friendly products. Industrial participants are adapting through innovation of green manufacturing practices and materials, falling in line with the shifting consumer trend towards green products.
Grocery & Food, beverage, agricultural, and pharmaceutical industries are among the largest consumers of this enzyme due to their increasing sustainability requirements, catalase helps decompose hydrogen peroxide. This type of change is geared by the requirement of more sustainability in processing techniques like waste management as well as enhancement of product durability.
Further, development of the biotechnology is allowing manufacturers to make catalase with a lesser amount of wastage and energy consumption. The overall use of enzymes is also being sourced with reduced biobased sources, thus achieving a further reduction in carbon footprint in the production of enzymes by companies.
At the same time, risk management with academic partners is promoting innovation, as manufacturers can offer solutions that address unique sector challenges without compromising on sustainable principles. All in all, the prospect of catalase manufacturing in the USA can be characterized as the prevention of the manufacturer's proactive response to the tendencies of more efficient use of resources that address environmental problems and ensure the competitiveness of the industries.
China has increased the pace of its progress curve in the use of catalase as part of efforts to enhance industrialization. As manufacturers continue striving to increase overall production efficiency and effectiveness, catalase is proving to be one great biochemical tool for use in industries as it replaces traditional options that could be less effective or detrimental to the environment.
The shift to catalase is most apparent in industries like textile, food processing, and wastewater management industries. For example in textile production, the enzyme is used for getting rid of the last vestiges of hydrogen peroxide used in the bleaching process hence helping save on chemical use as well as produce better quality textiles. It is done not only to address regulation guidelines but also to satisfy consumers’ expectations of safer, more environmentally friendly products.
In particular food processing, catalase has a very sensitive and essential role in the shelf life and food safety of products. It also helps the manufacturers to most efficiently decompose introduced hydrogen peroxide applied in sanitation, thus maintaining a high level of cleanness without exploiting stronger chemicals.
Further, catalase production and use are growing critical for Chinese manufacturers and they are now channeling their efforts toward research and development to further enhance their catalase production and usage. This focus leads to the development of new solutions that could be a much closer match to the needs of different applications. Consequently, the use of catalase is encouraging a greener way of manufacturing, which promotes China’s attack on the challenges of manufacturing in modern society.
Japan's catalase has risen, especially in cosmetics, food preservation, and eco-textile applications. This trend can be attributed more to the nation’s focus on biotechnology where the manufacturers seek more environmentally friendly technologies. In cosmetics, catalase is used to deactivate hydrogen peroxide, which is a widely used, constituent of many cosmetics.
Thus, including catalase in the production of cosmetic products will lead to an improvement in the quality and safety of the products that reach the consumers, reducing skin irritation, and propounding skin health. This approach holds good with the current trend of consumers running away with products that are milder on the skin but with a high effect.
In food preservation, catalase is slowly being adopted as a vital enzyme that reduces excess hydrogen peroxide used in preservation processes. This leads to enhanced food processing methods, and durability of products but not the quality of the products. This biotechnological is therefore an important solution to meet these growing consumers’ demands for fresher and natural foods.
Furthermore, during bleaching the hydrogen peroxide used can be eliminated in textile processing with the help of this enzyme; catalase. It also encourages the use of minimal chemicals therefore solving issues to do with chemical disposal while at the same time protecting the employees. The subtitles are directing manufacturers toward eco-friendly production and consumers toward environmentally friendly products; which is why these concepts have landed so well.
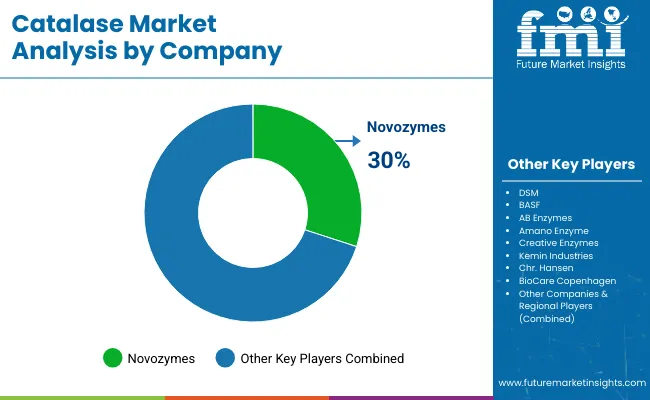
The global segment of catalases is crowded and very competitive, with several leading companies. Advancements in biotechnology have attracted top producers like Novozymes, DSM, and Amano Enzyme for enzyme production improvement. Other major contributors to the field are BASF and Kraft Heinz, who have catalase in their diverse applications.
These producers are focused on improving their products and production processes to increase their share of the growing industries for green solutions, ensuring that they will be well placed to compete in the future of the catalase industries.
According to the Source, the segment has been categorized into Bovine Liver, Microorganisms, and Other Sources.
According to the Form, the segment has been categorized into Powder and Liquid.
According to the End User, the segment has been categorized into Food & Beverage Manufacturers, Textile Manufacturing, Pharmaceuticals, and Other End Users.
Regional analysis has been carried out in key countries of North America, Latin America, Europe, East Asia, South Asia, Oceania, and the Middle East & Africa.
The global segment is estimated at a value of USD 424.5 million in 2025.
Sales increased at 2.8% CAGR between 2020 and 2024.
Some of the industrial leaders include Novozymes, DSM, BASF, AB Enzymes, Amano Enzyme, Creative Enzymes, Kemin Industries, Chr. Hansen, and BioCare Copenhagen.
The North American territory is projected to hold a revenue share of 30.0% over the forecast period.
The global value is projected to grow at a forecast CAGR of 3.1% from 2025 to 2035.


Full Research Suite comprises of:
Market outlook & trends analysis
Interviews & case studies
Strategic recommendations
Vendor profiles & capabilities analysis
5-year forecasts
8 regions and 60+ country-level data splits
Market segment data splits
12 months of continuous data updates
DELIVERED AS:
PDF EXCEL ONLINE
Key Companies & Market Share in the Catalase Sector
UK Catalase Market Report – Trends, Demand & Industry Forecast 2025–2035
USA Catalase Market Trends – Growth, Demand & Forecast 2025–2035
Europe Catalase Market Growth – Trends, Demand & Innovations 2025–2035

Thank you!
You will receive an email from our Business Development Manager. Please be sure to check your SPAM/JUNK folder too.
Chat With
MaRIA