Chlorella Market Snapshot (2023 to 2033)

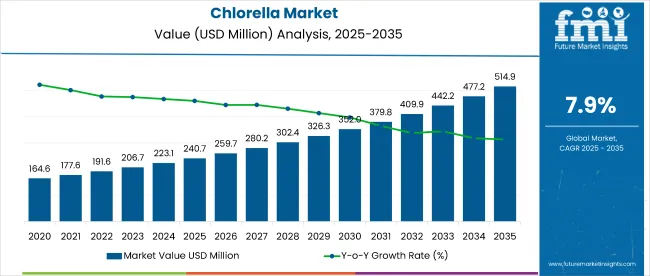
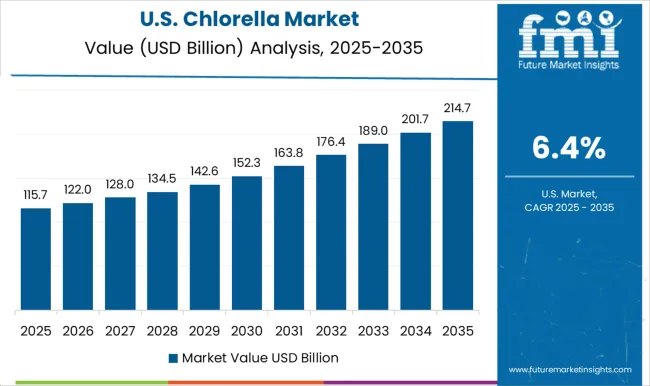
The global chlorella market is expected to reach a market value of US$ 206.9 million in 2023 and ultimately to US$ 444.6 million by registering a CAGR of 7.9% from 2023 to 2033. The market's growth can be attributed to the increasing use of chlorella in different end-use industries. The demand for chlorella registered a CAGR of 2.8% from 2018 to 2022. in the historical period 2018 to 2022.

Report Attribute Details
Growth Rate (2018 to 2022) 2.8% CAGR
Projected Growth Rate (2023 to 2033) 7.9% CAGR
Expected Market Value (2023) US$ 206.9 million
Anticipated Forecast Value (2033) US$ 444.6 million

Chlorella contains the highest chlorophyll amount compared to other plants. It consists of various active ingredients such as dietary essential amino acids, fatty acids, beta-carotene, RNA/DNA, and over 20 vitamins and minerals. It is widely used to treat constipation, fibromyalgia, high blood pressure, and high cholesterol.

Chlorella used for human consumption is cultivated outdoors in mineral-rich freshwater ponds under direct sunlight. Biologists closely monitor the cultivation process to ensure optimum nutrient value and product quality. It's used for , ulcers, Crohn’s disease, and diverticulosis by increasing the number of good bacteria in the gastrointestinal (GI) tract.treating colitis, ulcers, Crohn's disease, and diverticulosis by increasing the number of good bacteria in the gastrointestinal (GI) tract.

North America is considered a highly lucrative market, and its different products are driven primarily by its utilization across the cosmetics, personal care, food, and beverage industry.utilization across cosmetics, personal care, food, and beverage industry.

Don't pay for what you don't need

Customize your report by selecting specific countries or regions and save 30%!

2018 to 2022 Chlorella Demand Analysis vs. Forecast 2023 to 2033

The global demand for chlorella is projected to increase at a CAGR of 7.9% during the forecast period between 2023 and 2033, reaching a total of US$ 444.6 million in 2033, according to a report from Future Market Insights (FMI). From 2018 to 2022, sales witnessed significant growth, registering a CAGR of 2.8%.

The COVID-19 pandemic affected the sales of chlorella owing to the non-functioning of the major end-user industries such as food & beverage, pharmaceutical, and personal care industries. On the other hand, the multi-purpose functionality of chlorella is changing the market dynamics.On the other hand, the multi-purpose functionality of chlorella is changing the dynamics of the chlorella market.

Furthermore, with research underway for maximizing the use of chlorella, the use of the same is expected to enter different end-user industries. In the upcoming years, chlorella is expected to be used for nearly all age groups effectively.

Which are Some Prominent Drivers Spearheading Chlorella Market Growth?

Extensive Uptake in the Personal Care Industry to generate Revenue Pools

The increasing use of cosmetics and personal care products influences the growth of the chlorella industry across the globe as chlorella is used as an ingredient for adding pigmentation in cosmetic products and a key source of chlorophyll used in personal care products such as skin care creams, lotions, and hair care products.

In addition, the growing innovation in the personal care industry and continuous research and development has given a wide scope of growth for chlorella in the market.

Health benefits of increasing use of chlorellaHealth benefits increasing use of chlorella

Chlorella helps improve immunity, reduces gastric ulcers, lowers blood sugar levels, lowers cholesterol, and increases hemoglobin concentrations. These factors have helped in driving the market for chlorella across the globe. Also, the growing government support for organic farming in different regions across the world.

This has further led to a rise in chlorella cultivation, driving the market for chlorella globally. Continuously increasing demand for healthy and nutritional food drives the growth of the chlorella industry in the coming years.

Nandini Roy Choudhury

Principal Consultant

Talk to Analyst

Find your sweet spots for generating winning opportunities in this market.

What are the Challenges Faced by the Chlorella Industry?

Expensive nature of chlorella restraining market growth

Although the chlorella industry has numerous end-uses, numerous obstacles challenge market growth. The high cost associated with the research and development activities and the availability of alternatives is anticipated to be a significant growth barrier to the chlorella industry in forthcoming years. The cost and complexities related to the development of the products will hinder the growth of the market in the forecasting period. obstacles that pose a challenge to market growth. The high cost associated with the research and development activities and the availability of alternatives is anticipated to act as a significant growth barrier to the chlorella market in forthcoming years. The cost and complexities related to the development of the products will hinder the growth of the market in the forecasting period.

Region-Wise Insights

Why is North America emerging as an Opportunistic Chlorella Market?

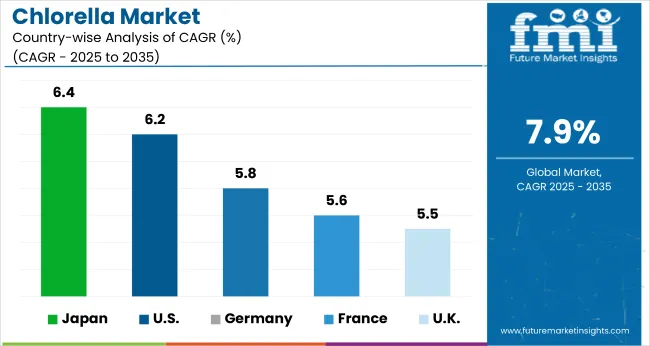
North America was the largest market for the chlorella industry, and the trend is expected to continue into the forecast period owing to the high production of chlorella in the region. The growing demand for chlorella for medicinal purposes is expected to increase the chlorella industry. The region is forecast to account for over 27.5% share in 2022.

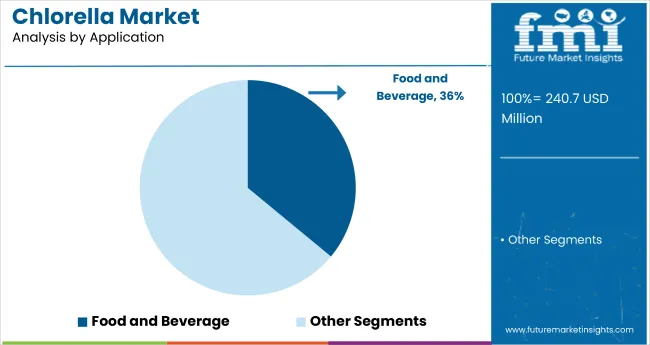
With the rapid development and an increasing number of skin-related problems in North America, the demand for chlorella products is anticipated to rise in the region. The rapidly growing food and beverage sector and the growing popularity of vegetarian food among the population further drive the growth of the chlorella industry.

How is Europe Contributing to the Growth of the Chlorella Market?

Demand for natural and organic skin care products bolstering demand for chlorella

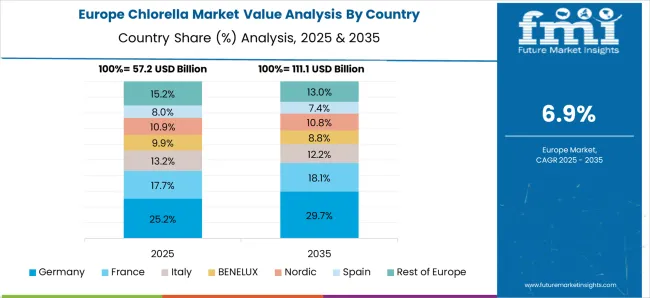
According to Future Market Insights, Europe is expected to provide immense growth opportunities for the chlorella industry due to the increasing demand for chlorella in the cosmetic and personal care industry. Europe's market accounts for a 24.3% share of the global chlorella industry.

The increasing trend of natural, organic, and environment-friendly products drives the chlorella industry in the region. Also, rapidly changing food consumption patterns in favor of functional food, high disposable income, and an increase in various chronic diseases due to the growing aging population boost the demand for chlorella in the region.

Agriculture Sector Contributing to Chlorella Market Growth in Asia PacificAgriculture Sector contributing to Chlorella Market Growth in Asia Pacific?

Seed modification growing demand for chlorella

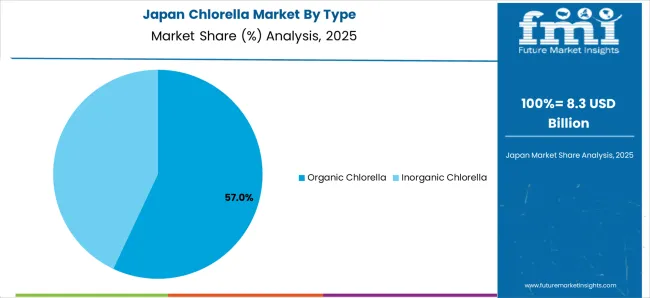
The agriculture sector is expected to increase sales of chlorella in the Asia Pacific region. The agricultural sector's strong presence and increasing awareness regarding genetically modified seeds contribute to the growth of chlorella in the region. Japan is the largest consumer of chlorella in the Asia Pacific.

Furthermore, the increasing investments in skincare products, especially by millennials and Generation Z, positively influence the demand for chlorella in the region. Thus, Asia Pacific is expected to possess a 20% market share for chlorella in 2022.

Get the data you need at a Fraction of the cost

Personalize your report by choosing insights you need
and save 40%!

Category-Wise Insights

Unadulterated Organic Chlorella Increasing Sales?

Organic Chlorella Helping in fighting against DiseasesOrganic Chlorella helping in fighting against Diseases

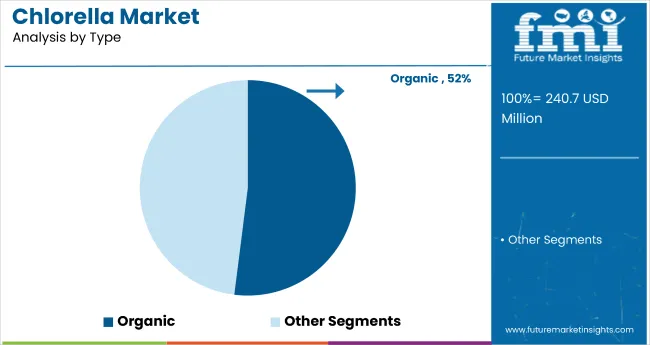
Organic chlorella is gaining popularity due to multiple reasons. Consumption of organic, chemical-free, and clean chlorella has increased. In addition, organic chlorella helps fight against multiple health ailments such as diabetes, heart problems, cancer, and cognitive diseases.

This has led to manufacturers using organic chlorella to attract consumers. Thus, organic chlorella is expected to register a CAGR of 7.9% for the chlorella industry by 2033.

Start-up for Chlorella Market

Algenuity, Seagrass Technology, Biotrino, Zara Biotech, AllMicroalgea, and ProFuture are some start-up companies operating in the chlorella industry.

  • In March 2022 - ProFuture developed light microalgae for plant-based protein without fishiness. Researchers have developed high-protein microalgae strains to boast improved taste.
  • AllMicroalgea is focusing on offering autotrophic organic chlorella and heterotrophic chlorella for use in different end user industries.

Market Competition

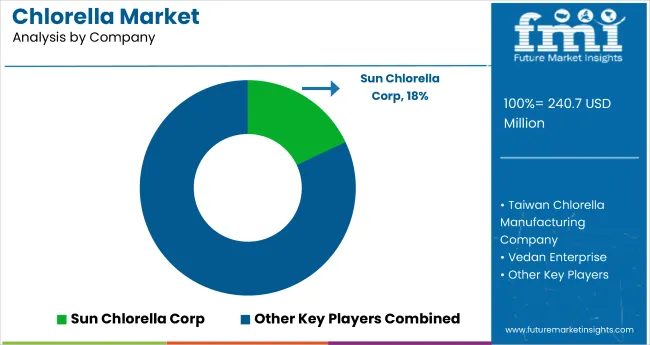
Some of the key participants present in the global chlorella industry include Sun Chlorella Corp, Vedan Enterprise, FEMICO, International Chlorella, Taiwan Chlorella Manufacturing Company, Yaeyama Chlorella, Gong Bih Enterprise, Fuqing King Dnarmsa Spirulina, Like Chlorella Biotech, Jiangxi Mingjun, Guangzhou Jinqiu Chlorella, Dongtai City Spirulina Bioengineering, Shandong Enkang, Tianjin Norland Biotech, and Ivanqi among others.

The market is highly competitive due to the presence of such a large number of participants. While global players such as Sun Chlorella Corp, Vedan Enterprise, FEMICO, International Chlorella, and Taiwan Chlorella Manufacturing Company account for a considerable market size, several regional-level players are also operating across key growth regions, particularly in the Asia Pacific.operating across key growth regions, particularly in the Asia Pacific.

  • In June 2022, Taiwan Chlorella Manufacturing Company declared that all its products are iodine-free, thus gaining the trust of its customers.
  • In December 2020, Sun Chlorella was named The Official Superfood of the Brooklyn Nets and New York Liberty. The partnership includes Sun Chlorella becoming the presenting sponsor of Nets Training Camp. Additionally, the company will be involved in upcoming Nets health and wellness virtual events, and Nets season ticket holders will be given exclusive offers for Sun Chlorella products.
  • In 2023, the EU H2020 funded projects GIANT LEAPS and LIKE-A-PRO joined the Horizon4Proteins project as there is a rise in demand for alternative plant-based proteins.
  • AlgaOrigin, a Swiss specialist for algae, introduces chlorella-based spirulina tablets., a Swiss specialist for algae introduces chlorella-based spirulina tablets.

Report Scope

Report Attribute Details
Growth Rate CAGR of 7.9% from 2023 to 2033
Expected Market Value (2023) US$ 206.9 million
Anticipated Forecast Value (2033) US$ 444.6 million
Base Year for Estimation 2022
Historical Data 2018 to 2022
Forecast Period 2023 to 2033
Quantitative Units Revenue in US$ Million and CAGR from 2023 to 2033
Report Coverage Revenue Forecast, Volume Forecast, Company Ranking, Competitive Landscape, Growth Factors, Trends, and Pricing Analysis
Segments Covered
  • Type
  • Application
  • Region
Regions Covered
  • North America
  • Latin America
  • Europe
  • Asia Pacific
  • Middle East and Africa
Key Countries Profiled
  • The USA
  • Canada
  • Mexico
  • Brazil
  • Germany
  • Italy
  • UK
  • Spain
  • France
  • China
  • Japan
  • South Korea
  • Malaysia
  • Singapore
  • Australia
  • GCC
  • South Africa
  • Israel
Key Companies Profiled
  • Sun Chlorella Corp
  • Vedan Enterprise
  • FEMICO
  • International Chlorella
  • Taiwan Chlorella Manufacturing Company
  • Yaeyama Chlorella
  • Gong Bih Enterprise
  • Fuqing King Dnarmsa Spirulina
  • Like Chlorella Biotech
  • Jiangxi Mingjun
  • Guangzhou Jinqiu Chlorella
  • Dongtai City Spirulina Bioengineering
  • Shandong Enkang
  • Tianjin Norland Biotech
Customization Available Upon Request

Key Segments Profiled in the Chlorella Industry Survey

By Type:

  • Organic Chlorella
  • Inorganic Chlorella

By Application:

  • Chlorella in Food and Beverage Industry
  • Chlorella in Pharmaceutical Industry
  • Chlorella in Personal Care Industry
  • Chlorella for Other Applications

By Region:

  • North America
  • Latin America
  • Europe
  • Asia Pacific
  • Middle East and Africa

Frequently Asked Questions

What is the growth rate of the market until 2033?

By 2033, the market will expand at a 7.9% CAGR.

What is the 2023 market value?

The 2023 market value is US$ 206.9 million.

What was the historical CAGR of the market?

From 2018 to 2022, the market expanded at a 2.8% CAGR.

What is the market value for 2033?

By 2033, the market will reach US$ 444.6 million.

Who are some prominent market players?

Sun Chlorella Corp, Vedan Enterprise, FEMICO are some key players.

Table of Content
1. Executive Summary
    1.1. Global Market Outlook
    1.2. Demand-side Trends
    1.3. Supply-side Trends
    1.4. Technology Roadmap Analysis
    1.5. Analysis and Recommendations
2. Market Overview
    2.1. Market Coverage / Taxonomy
    2.2. Market Definition / Scope / Limitations
3. Market Background
    3.1. Market Dynamics
        3.1.1. Drivers
        3.1.2. Restraints
        3.1.3. Opportunity
        3.1.4. Trends
    3.2. Scenario Forecast
        3.2.1. Demand in Optimistic Scenario
        3.2.2. Demand in Likely Scenario
        3.2.3. Demand in Conservative Scenario
    3.3. Opportunity Map Analysis
    3.4. Product Life Cycle Analysis
    3.5. Supply Chain Analysis
        3.5.1. Supply Side Participants and their Roles
            3.5.1.1. Producers
            3.5.1.2. Mid-Level Participants (Traders/ Agents/ Brokers)
            3.5.1.3. Wholesalers and Distributors
        3.5.2. Value Added and Value Created at Node in the Supply Chain
        3.5.3. List of Raw Material Suppliers
        3.5.4. List of Existing and Potential Buyer’s
    3.6. Investment Feasibility Matrix
    3.7. Value Chain Analysis
        3.7.1. Profit Margin Analysis
        3.7.2. Wholesalers and Distributors
        3.7.3. Retailers
    3.8. PESTLE and Porter’s Analysis
    3.9. Regulatory Landscape
        3.9.1. By Key Regions
        3.9.2. By Key Countries
    3.10. Regional Parent Market Outlook
    3.11. Production and Consumption Statistics
    3.12. Import and Export Statistics
4. Global Market Analysis 2018 to 2022 and Forecast, 2023 to 2033
    4.1. Historical Market Size Value (US$ Million) & Volume (MT) Analysis, 2018 to 2022
    4.2. Current and Future Market Size Value (US$ Million) & Volume (MT) Projections, 2023 to 2033
        4.2.1. Y-o-Y Growth Trend Analysis
        4.2.2. Absolute $ Opportunity Analysis
5. Global Market Analysis 2018 to 2022 and Forecast 2023 to 2033, By Type
    5.1. Introduction / Key Findings
    5.2. Historical Market Size Value (US$ Million) & Volume (MT) Analysis By Type, 2018 to 2022
    5.3. Current and Future Market Size Value (US$ Million) & Volume (MT) Analysis and Forecast By Type, 2023 to 2033
        5.3.1. Organic Chlorella
        5.3.2. Inorganic Chlorella
    5.4. Y-o-Y Growth Trend Analysis By Type, 2018 to 2022
    5.5. Absolute $ Opportunity Analysis By Type, 2023 to 2033
6. Global Market Analysis 2018 to 2022 and Forecast 2023 to 2033, By Application
    6.1. Introduction / Key Findings
    6.2. Historical Market Size Value (US$ Million) & Volume (MT) Analysis By Application, 2018 to 2022
    6.3. Current and Future Market Size Value (US$ Million) & Volume (MT) Analysis and Forecast By Application, 2023 to 2033
        6.3.1. Food and Beverage Industry
        6.3.2. Pharmaceutical Industry
        6.3.3. Personal Care Industry
        6.3.4. Other Applications
    6.4. Y-o-Y Growth Trend Analysis By Application, 2018 to 2022
    6.5. Absolute $ Opportunity Analysis By Application, 2023 to 2033
7. Global Market Analysis 2018 to 2022 and Forecast 2023 to 2033, By Region
    7.1. Introduction
    7.2. Historical Market Size Value (US$ Million) & Volume (MT) Analysis By Region, 2018 to 2022
    7.3. Current Market Size Value (US$ Million) & Volume (MT) Analysis and Forecast By Region, 2023 to 2033
        7.3.1. North America
        7.3.2. Latin America
        7.3.3. Western Europe
        7.3.4. Eastern Europe
        7.3.5. South Asia and Pacific
        7.3.6. East Asia
        7.3.7. Middle East and Africa
    7.4. Market Attractiveness Analysis By Region
8. North America Market Analysis 2018 to 2022 and Forecast 2023 to 2033, By Country
    8.1. Historical Market Size Value (US$ Million) & Volume (MT) Trend Analysis By Market Taxonomy, 2018 to 2022
    8.2. Market Size Value (US$ Million) & Volume (MT) Forecast By Market Taxonomy, 2023 to 2033
        8.2.1. By Country
            8.2.1.1. USA
            8.2.1.2. Canada
        8.2.2. By Type
        8.2.3. By Application
    8.3. Market Attractiveness Analysis
        8.3.1. By Country
        8.3.2. By Type
        8.3.3. By Application
    8.4. Key Takeaways
9. Latin America Market Analysis 2018 to 2022 and Forecast 2023 to 2033, By Country
    9.1. Historical Market Size Value (US$ Million) & Volume (MT) Trend Analysis By Market Taxonomy, 2018 to 2022
    9.2. Market Size Value (US$ Million) & Volume (MT) Forecast By Market Taxonomy, 2023 to 2033
        9.2.1. By Country
            9.2.1.1. Brazil
            9.2.1.2. Mexico
            9.2.1.3. Rest of Latin America
        9.2.2. By Type
        9.2.3. By Application
    9.3. Market Attractiveness Analysis
        9.3.1. By Country
        9.3.2. By Type
        9.3.3. By Application
    9.4. Key Takeaways
10. Western Europe Market Analysis 2018 to 2022 and Forecast 2023 to 2033, By Country
    10.1. Historical Market Size Value (US$ Million) & Volume (MT) Trend Analysis By Market Taxonomy, 2018 to 2022
    10.2. Market Size Value (US$ Million) & Volume (MT) Forecast By Market Taxonomy, 2023 to 2033
        10.2.1. By Country
            10.2.1.1. Germany
            10.2.1.2. UK
            10.2.1.3. France
            10.2.1.4. Spain
            10.2.1.5. Italy
            10.2.1.6. Rest of Western Europe
        10.2.2. By Type
        10.2.3. By Application
    10.3. Market Attractiveness Analysis
        10.3.1. By Country
        10.3.2. By Type
        10.3.3. By Application
    10.4. Key Takeaways
11. Eastern Europe Market Analysis 2018 to 2022 and Forecast 2023 to 2033, By Country
    11.1. Historical Market Size Value (US$ Million) & Volume (MT) Trend Analysis By Market Taxonomy, 2018 to 2022
    11.2. Market Size Value (US$ Million) & Volume (MT) Forecast By Market Taxonomy, 2023 to 2033
        11.2.1. By Country
            11.2.1.1. Poland
            11.2.1.2. Russia
            11.2.1.3. Czech Republic
            11.2.1.4. Romania
            11.2.1.5. Rest of Eastern Europe
        11.2.2. By Type
        11.2.3. By Application
    11.3. Market Attractiveness Analysis
        11.3.1. By Country
        11.3.2. By Type
        11.3.3. By Application
    11.4. Key Takeaways
12. South Asia and Pacific Market Analysis 2018 to 2022 and Forecast 2023 to 2033, By Country
    12.1. Historical Market Size Value (US$ Million) & Volume (MT) Trend Analysis By Market Taxonomy, 2018 to 2022
    12.2. Market Size Value (US$ Million) & Volume (MT) Forecast By Market Taxonomy, 2023 to 2033
        12.2.1. By Country
            12.2.1.1. India
            12.2.1.2. Bangladesh
            12.2.1.3. Australia
            12.2.1.4. New Zealand
            12.2.1.5. Rest of South Asia and Pacific
        12.2.2. By Type
        12.2.3. By Application
    12.3. Market Attractiveness Analysis
        12.3.1. By Country
        12.3.2. By Type
        12.3.3. By Application
    12.4. Key Takeaways
13. East Asia Market Analysis 2018 to 2022 and Forecast 2023 to 2033, By Country
    13.1. Historical Market Size Value (US$ Million) & Volume (MT) Trend Analysis By Market Taxonomy, 2018 to 2022
    13.2. Market Size Value (US$ Million) & Volume (MT) Forecast By Market Taxonomy, 2023 to 2033
        13.2.1. By Country
            13.2.1.1. China
            13.2.1.2. Japan
            13.2.1.3. South Korea
        13.2.2. By Type
        13.2.3. By Application
    13.3. Market Attractiveness Analysis
        13.3.1. By Country
        13.3.2. By Type
        13.3.3. By Application
    13.4. Key Takeaways
14. Middle East and Africa Market Analysis 2018 to 2022 and Forecast 2023 to 2033, By Country
    14.1. Historical Market Size Value (US$ Million) & Volume (MT) Trend Analysis By Market Taxonomy, 2018 to 2022
    14.2. Market Size Value (US$ Million) & Volume (MT) Forecast By Market Taxonomy, 2023 to 2033
        14.2.1. By Country
            14.2.1.1. GCC Countries
            14.2.1.2. South Africa
            14.2.1.3. Israel
            14.2.1.4. Rest of MEA
        14.2.2. By Type
        14.2.3. By Application
    14.3. Market Attractiveness Analysis
        14.3.1. By Country
        14.3.2. By Type
        14.3.3. By Application
    14.4. Key Takeaways
15. Key Countries Market Analysis
    15.1. USA
        15.1.1. Pricing Analysis
        15.1.2. Market Share Analysis, 2022
            15.1.2.1. By Type
            15.1.2.2. By Application
    15.2. Canada
        15.2.1. Pricing Analysis
        15.2.2. Market Share Analysis, 2022
            15.2.2.1. By Type
            15.2.2.2. By Application
    15.3. Brazil
        15.3.1. Pricing Analysis
        15.3.2. Market Share Analysis, 2022
            15.3.2.1. By Type
            15.3.2.2. By Application
    15.4. Mexico
        15.4.1. Pricing Analysis
        15.4.2. Market Share Analysis, 2022
            15.4.2.1. By Type
            15.4.2.2. By Application
    15.5. Germany
        15.5.1. Pricing Analysis
        15.5.2. Market Share Analysis, 2022
            15.5.2.1. By Type
            15.5.2.2. By Application
    15.6. UK
        15.6.1. Pricing Analysis
        15.6.2. Market Share Analysis, 2022
            15.6.2.1. By Type
            15.6.2.2. By Application
    15.7. France
        15.7.1. Pricing Analysis
        15.7.2. Market Share Analysis, 2022
            15.7.2.1. By Type
            15.7.2.2. By Application
    15.8. Spain
        15.8.1. Pricing Analysis
        15.8.2. Market Share Analysis, 2022
            15.8.2.1. By Type
            15.8.2.2. By Application
    15.9. Italy
        15.9.1. Pricing Analysis
        15.9.2. Market Share Analysis, 2022
            15.9.2.1. By Type
            15.9.2.2. By Application
    15.10. Poland
        15.10.1. Pricing Analysis
        15.10.2. Market Share Analysis, 2022
            15.10.2.1. By Type
            15.10.2.2. By Application
    15.11. Russia
        15.11.1. Pricing Analysis
        15.11.2. Market Share Analysis, 2022
            15.11.2.1. By Type
            15.11.2.2. By Application
    15.12. Czech Republic
        15.12.1. Pricing Analysis
        15.12.2. Market Share Analysis, 2022
            15.12.2.1. By Type
            15.12.2.2. By Application
    15.13. Romania
        15.13.1. Pricing Analysis
        15.13.2. Market Share Analysis, 2022
            15.13.2.1. By Type
            15.13.2.2. By Application
    15.14. India
        15.14.1. Pricing Analysis
        15.14.2. Market Share Analysis, 2022
            15.14.2.1. By Type
            15.14.2.2. By Application
    15.15. Bangladesh
        15.15.1. Pricing Analysis
        15.15.2. Market Share Analysis, 2022
            15.15.2.1. By Type
            15.15.2.2. By Application
    15.16. Australia
        15.16.1. Pricing Analysis
        15.16.2. Market Share Analysis, 2022
            15.16.2.1. By Type
            15.16.2.2. By Application
    15.17. New Zealand
        15.17.1. Pricing Analysis
        15.17.2. Market Share Analysis, 2022
            15.17.2.1. By Type
            15.17.2.2. By Application
    15.18. China
        15.18.1. Pricing Analysis
        15.18.2. Market Share Analysis, 2022
            15.18.2.1. By Type
            15.18.2.2. By Application
    15.19. Japan
        15.19.1. Pricing Analysis
        15.19.2. Market Share Analysis, 2022
            15.19.2.1. By Type
            15.19.2.2. By Application
    15.20. South Korea
        15.20.1. Pricing Analysis
        15.20.2. Market Share Analysis, 2022
            15.20.2.1. By Type
            15.20.2.2. By Application
    15.21. GCC Countries
        15.21.1. Pricing Analysis
        15.21.2. Market Share Analysis, 2022
            15.21.2.1. By Type
            15.21.2.2. By Application
    15.22. South Africa
        15.22.1. Pricing Analysis
        15.22.2. Market Share Analysis, 2022
            15.22.2.1. By Type
            15.22.2.2. By Application
    15.23. Israel
        15.23.1. Pricing Analysis
        15.23.2. Market Share Analysis, 2022
            15.23.2.1. By Type
            15.23.2.2. By Application
16. Market Structure Analysis
    16.1. Competition Dashboard
    16.2. Competition Benchmarking
    16.3. Market Share Analysis of Top Players
        16.3.1. By Regional
        16.3.2. By Type
        16.3.3. By Application
17. Competition Analysis
    17.1. Competition Deep Dive
        17.1.1. Sun Corp
            17.1.1.1. Overview
            17.1.1.2. Product Portfolio
            17.1.1.3. Profitability by Market Segments
            17.1.1.4. Sales Footprint
            17.1.1.5. Strategy Overview
                17.1.1.5.1. Marketing Strategy
                17.1.1.5.2. Product Strategy
                17.1.1.5.3. Channel Strategy
        17.1.2. Vedan Enterprise
            17.1.2.1. Overview
            17.1.2.2. Product Portfolio
            17.1.2.3. Profitability by Market Segments
            17.1.2.4. Sales Footprint
            17.1.2.5. Strategy Overview
                17.1.2.5.1. Marketing Strategy
                17.1.2.5.2. Product Strategy
                17.1.2.5.3. Channel Strategy
        17.1.3. FEMICO
            17.1.3.1. Overview
            17.1.3.2. Product Portfolio
            17.1.3.3. Profitability by Market Segments
            17.1.3.4. Sales Footprint
            17.1.3.5. Strategy Overview
                17.1.3.5.1. Marketing Strategy
                17.1.3.5.2. Product Strategy
                17.1.3.5.3. Channel Strategy
        17.1.4. International Chlorella
            17.1.4.1. Overview
            17.1.4.2. Product Portfolio
            17.1.4.3. Profitability by Market Segments
            17.1.4.4. Sales Footprint
            17.1.4.5. Strategy Overview
                17.1.4.5.1. Marketing Strategy
                17.1.4.5.2. Product Strategy
                17.1.4.5.3. Channel Strategy
        17.1.5. Taiwan Manufacturing Company
            17.1.5.1. Overview
            17.1.5.2. Product Portfolio
            17.1.5.3. Profitability by Market Segments
            17.1.5.4. Sales Footprint
            17.1.5.5. Strategy Overview
                17.1.5.5.1. Marketing Strategy
                17.1.5.5.2. Product Strategy
                17.1.5.5.3. Channel Strategy
        17.1.6. Yaeyama Chlorella
            17.1.6.1. Overview
            17.1.6.2. Product Portfolio
            17.1.6.3. Profitability by Market Segments
            17.1.6.4. Sales Footprint
            17.1.6.5. Strategy Overview
                17.1.6.5.1. Marketing Strategy
                17.1.6.5.2. Product Strategy
                17.1.6.5.3. Channel Strategy
        17.1.7. Gong Bih Enterprise
            17.1.7.1. Overview
            17.1.7.2. Product Portfolio
            17.1.7.3. Profitability by Market Segments
            17.1.7.4. Sales Footprint
            17.1.7.5. Strategy Overview
                17.1.7.5.1. Marketing Strategy
                17.1.7.5.2. Product Strategy
                17.1.7.5.3. Channel Strategy
        17.1.8. Fuqing King Dnarmsa Spirulina
            17.1.8.1. Overview
            17.1.8.2. Product Portfolio
            17.1.8.3. Profitability by Market Segments
            17.1.8.4. Sales Footprint
            17.1.8.5. Strategy Overview
                17.1.8.5.1. Marketing Strategy
                17.1.8.5.2. Product Strategy
                17.1.8.5.3. Channel Strategy
        17.1.9. Like Biotech
            17.1.9.1. Overview
            17.1.9.2. Product Portfolio
            17.1.9.3. Profitability by Market Segments
            17.1.9.4. Sales Footprint
            17.1.9.5. Strategy Overview
                17.1.9.5.1. Marketing Strategy
                17.1.9.5.2. Product Strategy
                17.1.9.5.3. Channel Strategy
        17.1.10. Jiangxi Mingjun
            17.1.10.1. Overview
            17.1.10.2. Product Portfolio
            17.1.10.3. Profitability by Market Segments
            17.1.10.4. Sales Footprint
            17.1.10.5. Strategy Overview
                17.1.10.5.1. Marketing Strategy
                17.1.10.5.2. Product Strategy
                17.1.10.5.3. Channel Strategy
        17.1.11. Guangzhou Jinqiu Chlorella
            17.1.11.1. Overview
            17.1.11.2. Product Portfolio
            17.1.11.3. Profitability by Market Segments
            17.1.11.4. Sales Footprint
            17.1.11.5. Strategy Overview
                17.1.11.5.1. Marketing Strategy
                17.1.11.5.2. Product Strategy
                17.1.11.5.3. Channel Strategy
        17.1.12. Dongtai City Spirulina Bio-engineering
            17.1.12.1. Overview
            17.1.12.2. Product Portfolio
            17.1.12.3. Profitability by Market Segments
            17.1.12.4. Sales Footprint
            17.1.12.5. Strategy Overview
                17.1.12.5.1. Marketing Strategy
                17.1.12.5.2. Product Strategy
                17.1.12.5.3. Channel Strategy
        17.1.13. Shandong Enkang
            17.1.13.1. Overview
            17.1.13.2. Product Portfolio
            17.1.13.3. Profitability by Market Segments
            17.1.13.4. Sales Footprint
            17.1.13.5. Strategy Overview
                17.1.13.5.1. Marketing Strategy
                17.1.13.5.2. Product Strategy
                17.1.13.5.3. Channel Strategy
        17.1.14. Tianjin Norland Biotech
            17.1.14.1. Overview
            17.1.14.2. Product Portfolio
            17.1.14.3. Profitability by Market Segments
            17.1.14.4. Sales Footprint
            17.1.14.5. Strategy Overview
                17.1.14.5.1. Marketing Strategy
                17.1.14.5.2. Product Strategy
                17.1.14.5.3. Channel Strategy
18. Assumptions & Acronyms Used
19. Research Methodology
Recommendations

Food and Beverage

Microalgae Market

May 2023

REP-GB-13748

342 pages

Food and Beverage

Chlorella Ingredients Market

June 2022

REP-GB-15069

306 pages

Explore Food and Beverage Insights

View Reports
Future Market Insights

Chlorella Market

Schedule a Call