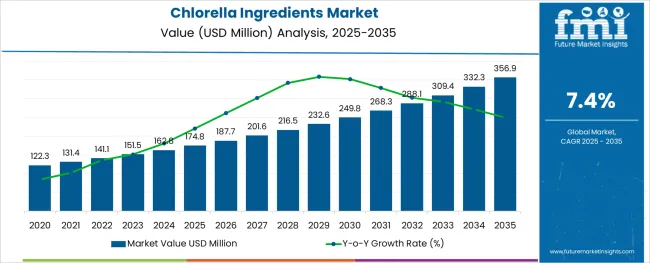
The Chlorella Ingredients Market is estimated to be valued at USD 174.8 million in 2025 and is projected to reach USD 356.9 million by 2035, registering a compound annual growth rate (CAGR) of 7.4% over the forecast period.

The chlorella ingredients market is gaining traction due to the rising demand for plant-based nutrition and increasing awareness of its therapeutic properties. Consumers are showing growing interest in natural supplements that support immunity detoxification and overall wellness. Chlorella's nutritional density has drawn attention from health professionals and wellness advocates leading to its wider inclusion in functional foods dietary supplements and medical nutrition.
Its antioxidant and anti-inflammatory potential has also made it a subject of ongoing clinical interest further strengthening its use in health-focused applications. The expansion of clean label formulations and consumer preference for non-synthetic ingredients have contributed to the increased demand for chlorella sourced from sustainable environments.
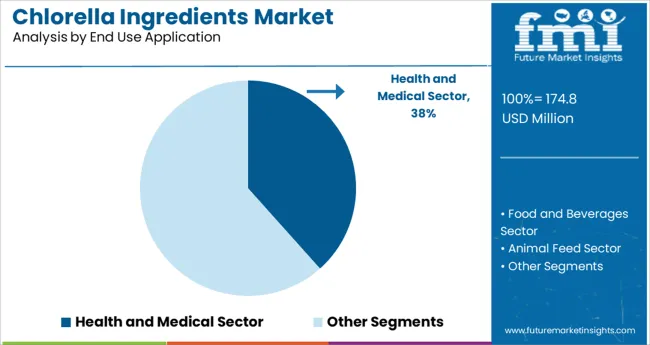
Market momentum is expected to be shaped by product development in nutraceuticals and fortified foods as well as regulatory support for microalgae-based food products. Segmental growth is expected to be led by the Health and Medical Sector in end use applications and Fresh Water as the primary cultivation source.
The market is segmented by End Use Application and Source and region. By End Use Application, the market is divided into Health and Medical Sector, Food and Beverages Sector, Animal Feed Sector, Pet Food Sector, Cosmetics and Personal Care Sector, and Fertilizers Sector. In terms of Source, the market is classified into Fresh Water and Marine water. Regionally, the market is classified into North America, Latin America, Western Europe, Eastern Europe, Balkan & Baltic Countries, Russia & Belarus, Central Asia, East Asia, South Asia & Pacific, and the Middle East & Africa.
The market is segmented by End Use Application and Source and region. By End Use Application, the market is divided into Health and Medical Sector, Food and Beverages Sector, Animal Feed Sector, Pet Food Sector, Cosmetics and Personal Care Sector, and Fertilizers Sector. In terms of Source, the market is classified into Fresh Water and Marine water. Regionally, the market is classified into North America, Latin America, Western Europe, Eastern Europe, Balkan & Baltic Countries, Russia & Belarus, Central Asia, East Asia, South Asia & Pacific, and the Middle East & Africa.

The Health and Medical Sector segment is projected to account for 38.4% of the chlorella ingredients market revenue in 2025 making it the largest end use application. Growth in this segment is supported by rising consumer interest in natural ingredients that offer therapeutic benefits without the side effects associated with synthetic alternatives.
Chlorella has been increasingly incorporated into medical nutrition products due to its rich profile of vitamins minerals and proteins along with its detoxifying and immune-boosting properties. Medical practitioners and wellness experts have emphasized its potential in managing oxidative stress and supporting gut health which has boosted its presence in supplements aimed at specific health outcomes.
As health and prevention continue to dominate consumer priorities the Health and Medical Sector is expected to remain the key application driving demand for chlorella ingredients.

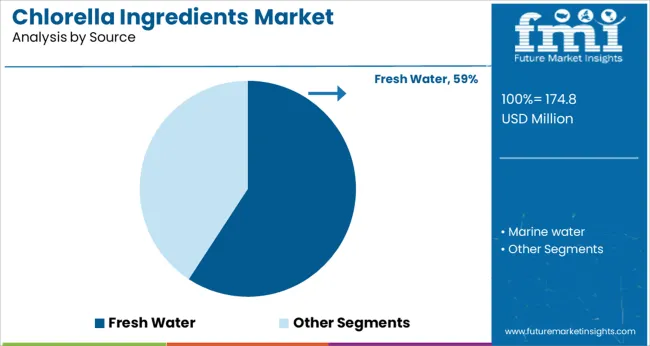
The Fresh Water segment is projected to contribute 59.2% of the chlorella ingredients market revenue in 2025 making it the leading source of cultivation. This segment has gained preference due to its controlled cultivation conditions which help produce high-quality chlorella with consistent nutrient content.
Producers have favored fresh water environments for their ability to support contamination-free biomass production without the need for chemical additives. These systems also enable optimized light and nutrient exposure which enhances the chlorophyll content and overall nutritional value of chlorella.
The demand for clean safe and traceable sources in functional foods and supplements has further increased the focus on fresh water cultivation. As consumer trust in quality sourcing becomes more critical the Fresh Water segment is expected to maintain its dominance in chlorella production.
Growing consumer awareness of the health benefits of microalgae products, as well as growing preference for plant-derived proteins, are the primary drivers pushing the demand for chlorella ingredients forward during the forecast period.
Customers' interest in superfoods' or nutrition-rich food has grown in recent years. Consumers who are concerned about their health are driving the demand for products that encourage good health, increase longevity, and prevent chronic diseases.
Chlorella produces lutein, a molecule that has been shown to treat and prevent macular degeneration as well as having anti-cataract properties. These characteristics are pushing the adoption of chlorella ingredients at a fast rate.
Growing demand for personal care and cosmetic items has played a vital influence in supporting the expansion of the chlorella ingredients market around the globe. In cosmetic products, chlorella serves as a component that adds pigment. Furthermore, chlorella is a significant source of the chlorophyll found in cosmetics including creams, lotions, and hair care items.
The rise of the chlorella ingredients market internationally has also been fueled by a rising number of health-conscious consumers. Chlorella aids in boosting the immune system, decreasing gastrointestinal ulcers, lowering blood sugar and cholesterol, and raising hemoglobin levels. These elements have influenced the sales of chlorella ingredients all around the world.
The expanding government support for organic farming in many parts of the world is another factor driving the expansion of the chlorella ingredients market globally. This has also increased chlorella cultivation, which has propelled the demand for chlorella ingredients globally.
Chlorella contains a lot of nutrients, glycerine, sugar content, and bases that have been esterified to saturated as well as unsaturated fats. Some essential fatty acids, like omega-3 and omega-6, are plentiful in Chlorella, and a high level of PUFAs, comparable to the that discovered in fish oils, has been discovered.
Chlorella is a high-quality source of minerals and vitamins that can be easily consumed by both adults and children to meet their daily vitamin requirements.
Alpha-carotene, beta-carotene, vitamins B1, B2, B3, B5, B6, E, and vitamin K are just a few of the vitamins found in large amounts in chlorella. Folic acid, biotin, inositol, choline, and vitamin B12 are all found in trace amounts. As Chlorella is composed of 55-60% protein, 1-4% chlorophyll, 9-18% dietary Fibre, vitamins, and minerals it is widely used in the nutraceuticals market as well.
Due to the growing inclination for healthy food products, which is boosting the demand for chlorella ingredients, North America dominated the global chlorella ingredients market.
Additionally, the chlorella ingredients market is expanding as a result of rising advancements in the food and beverage industry and rising veganism adoption among the populace.
The USA Chlorella Ingredients market has a market valuation of USD 174.8 Million in 2025 and is expected to rise at a CAGR of 6.6% by 2035.
Increasing health consciousness among consumers and changing lifestyles in Asian nations are expected to make the Asia Pacific the significant-growing chlorella ingredients market between 2024 and 2029.
As a result of the rising adoption of chlorella ingredients in a wide range of Asian cuisines, the market for such ingredients is expanding.
One of the key factors in the expansion of the Asia-Pacific chlorella ingredients market is China and Japan. Chlorella ingredients market expansion in the area is being driven by the accelerated growth of the personal care sector in Asia-growing Pacific economies.
As per the chlorella ingredients market study, chlorella cultivation for the manufacture of biomass or derivative goods is an economic activity that has previously been commercialized in a number of countries including India.
The high protein, carotenoids, vitamin, and mineral content of these microalgae has sparked interest because of their rapid growth and simple life cycles, which allow for in-depth studies of their mechanisms as well as their use as a food replacement advantages such as high nutrients, vitamin, carotenoids, and mineral content.
Such varied application of chlorella ingredients is boosting demand in the Indian market as well.
Conventional nature holds around 75.1% of the chlorella ingredients market share in 2025, however, the organic type of chlorella ingredients is expected to grow with a high demand for chlorella ingredients over the forecast period.
Chlorella ingredients have been extensively explored to acquire biomass or extract bioactive chemicals that could be used in functional nutritional supplements, nutraceuticals, cosmetics, and medicines. This benefit for human or medical nutrition stems from their biological actions that provide health advantages to boost the chlorella ingredients market.
The source of chlorella ingredients is classified into marine water and freshwater. Freshwater holds the dominant chlorella ingredients market share. The easy access to chlorella ingredients through freshwater is a key factor propelling the chlorella ingredients market forward.
Chlorella ingredients mostly have their application its segments such as health and medical science, food, and beverages. Health and medical science hold a leading chlorella ingredients market share, nonetheless, the food and beverages segment is set to witness tremendous growth in the coming decade.

In the years to come, the chlorella ingredients market is anticipated to benefit from distinctive cultivation techniques and forthcoming revolutionary uses. Due to growing industrialization, product extensions, technological advancements, and the excellent quality of manufactured goods, the competition in this industry is anticipated to intensify more in the years to come.
For example:
| Attributes | Details |
|---|---|
| Forecast Period | 2025 to 2035 |
| Historical Data Available for | 2020 to 2025 |
| Market Analysis | million for Value and MT for Volume |
| Key Regions Covered | North America; Latin America; Europe; East Asia; South Asia; Oceania; and the Middle East & Africa |
| Key Countries Covered | USA, Canada, Brazil, Mexico, Chile, Peru, Argentina, Germany, Italy, France, United Kingdom, Spain, BENELUX, Nordic, Russia, Poland, China, Japan, South Korea, India, Thailand, Indonesia, Malaysia, Singapore, Australia, New Zealand, GCC Countries, Turkey, South Africa, North Africa, and Central Africa |
| Key Segments Covered | Source, End Use Application and Region |
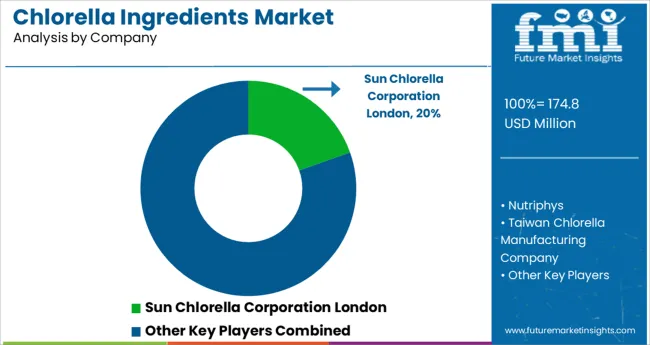
| Key Companies Profiled | Sun Chlorella Corporation London; Nutriphys; Taiwan Chlorella Manufacturing Company; Yaeyama Chlorella; Gong Bih Enterprise; Fuqing King Dnarmsa Spirulina Co. Ltd.; Like Chlorella Biotech; Guangzhou Jinqiu Chlorella; Vedan Enterprise; Dongtai City Spirulina Bio-engineering; Tianjin Norland Biotech; NP Nutra; Green Source Organics |
| Report Coverage | Market Forecast, Company Share Analysis, Competition Intelligence, Drivers, Restraints, Opportunities and Threats Analysis, Market Dynamics and Challenges, and Strategic Growth Initiatives |
| Customization & Pricing | Available upon Request |
The global chlorella ingredients market is estimated to be valued at USD 174.8 million in 2025.
It is projected to reach USD 356.9 million by 2035.
The market is expected to grow at a 7.4% CAGR between 2025 and 2035.
The key product types are health and medical sector, food and beverages sector, animal feed sector, pet food sector, cosmetics and personal care sector and fertilizers sector.
fresh water segment is expected to dominate with a 59.2% industry share in 2025.


Full Research Suite comprises of:
Market outlook & trends analysis
Interviews & case studies
Strategic recommendations
Vendor profiles & capabilities analysis
5-year forecasts
8 regions and 60+ country-level data splits
Market segment data splits
12 months of continuous data updates
DELIVERED AS:
PDF EXCEL ONLINE
Chlorella Market Size and Share Forecast Outlook 2025 to 2035
Chlorella Extracts Market Analysis - Size and Share Forecast Outlook 2025 to 2035
Ingredients Market for Plant-based Food & Beverages Size and Share Forecast Outlook 2025 to 2035
Bean Ingredients Market Size and Share Forecast Outlook 2025 to 2035
Milk Ingredients Market Analysis - Size, Share, and Forecast Outlook 2025 to 2035
Malt Ingredients Market Analysis by Raw Material, Product Type, Grade, End-use, and Region through 2035
Aroma Ingredients Market Size and Share Forecast Outlook 2025 to 2035
Dairy Ingredients Market Size and Share Forecast Outlook 2025 to 2035
Pulse Ingredients Market Analysis – Size, Share, and Forecast 2025 to 2035
Smoke Ingredients for Food Market Analysis - Size, Share & Forecast 2025 to 2035
Bakery Ingredients Market Analysis - Size, Share, & Forecast Outlook 2025 to 2035
Biotin Ingredients Market Size and Share Forecast Outlook 2025 to 2035
Baking Ingredients Market Size and Share Forecast Outlook 2025 to 2035
Almond Ingredients Market Size, Growth, and Forecast for 2025 to 2035
Savory Ingredients Market Analysis – Size, Share, and Forecast Outlook 2025 to 2035
Examining Savory Ingredients Market Share & Industry Leaders
Energy Ingredients Market Analysis by Product Type and Application Through 2035
Perfume Ingredients Chemicals Market Size and Share Forecast Outlook 2025 to 2035
Vitamin Ingredients Market Size and Share Forecast Outlook 2025 to 2035
Alcohol Ingredients Market Analysis - Size, Share, and Forecast Outlook 2025 to 2035

Thank you!
You will receive an email from our Business Development Manager. Please be sure to check your SPAM/JUNK folder too.
Chat With
MaRIA