Chromium Picolinate Market Size and Share Forecast Outlook 2025 to 2035

The chromium picolinate market is valued at USD 14.7 billion in 2025 and is anticipated to grow to USD 33.5 billion by 2035, exhibiting a CAGR of 8.6%.
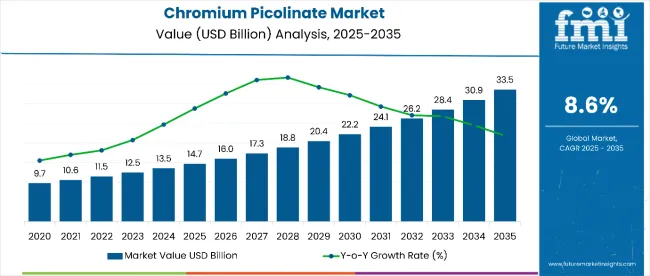
Quick Stats for Chromium Picolinate Market

  • Chromium Picolinate Market Value (2025): USD 14.7 billion
  • Chromium Picolinate Market Forecast Value (2035): USD 33.5 billion
  • Chromium Picolinate Market Forecast CAGR: 8.6%
  • LeadingSegment in Chromium Picolinate Market in 2025: Food Grade (62%)
  • Key Growth Regions in Chromium Picolinate Market: United States, United Kingdom, and Germany
  • Top Key Players in Chromium Picolinate Market: Lonza Group, Merck KGaA, Mubychem Group, Celtic Chemicals Ltd., Resonance Specialities Ltd., Cambridge Commodities Limited.

Chromium Picolinate Market

Metric Value
Estimated Value in (2025E) USD 14.7 billion
Forecast Value in (2035F) USD 33.5 billion
Forecast CAGR (2025 to 2035) 8.6%

This growth reflects an absolute dollar opportunity of USD 18.8 billion, driven primarily by increasing health awareness and rising demand for dietary supplements that aid in weight management and diabetes control. The pharmaceutical segment accounts for 50% of the market, while the food-grade segment leads with 62%, highlighting diverse applications in health and nutrition.

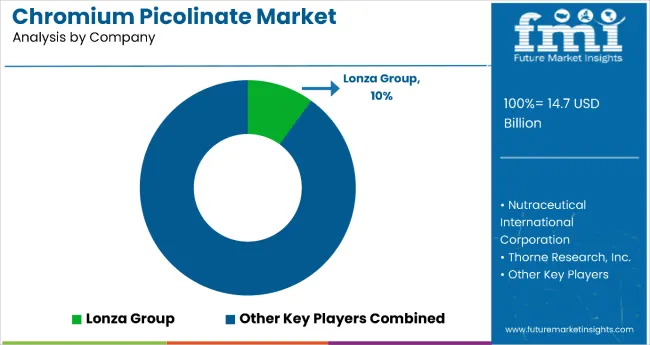
By 2030, the market is expected to reach around USD 22.2 billion, supported by steady growth across key regions. The US, UK, Germany, China, and India are anticipated to lead the market expansion with CAGRs between 8.0% and 8.5%. Major companies such as Lonza Group, holding a 10% market share, are focusing on capacity expansion and product innovation. Increasing consumer preference for natural supplements and the rise of e-commerce channels further fuel the market’s growth globally.

Companies such as Lonza Group, Merck KGaA, and Mubychem Group are strengthening their market positions through strategic investments in advanced manufacturing technologies and innovative product development. Growing consumer focus on health and wellness is driving expansion into pharmaceutical supplements, sports nutrition, and functional food applications. Market growth is supported by increasing regulatory approvals, emphasis on product safety, and the rising popularity of bioavailable chromium picolinate formulations.

The market holds approximately 50% share within the pharmaceutical industry segment, driven by its effectiveness in glucose metabolism and diabetes management supplements. It accounts for around 62% of the food grade segment, reflecting growing consumer demand for health supplements and fortified foods. The market is also influenced by significant regional contributions, with the US (8.5%), UK (8.4%), Germany (8.3%), China (8.2%), and India (8.0%) representing key growth territories. The Lonza Group commands a leading 10% share among manufacturers, bolstered by innovation and extensive distribution networks.

The market is evolving due to rising health consciousness and increasing incidence of metabolic disorders globally. Advances in manufacturing processes ensure high purity and bioavailability, making chromium picolinate a preferred ingredient in nutraceuticals and dietary supplements. Strategic partnerships between raw material suppliers and supplement manufacturers are driving product development and geographic expansion. Regulatory compliance and consumer demand for traceable, high-quality ingredients continue to reshape supply chains and support premium market positioning.

Why is the Chromium Picolinate Market Growing?

Chromium picolinate’s proven efficacy in supporting glucose metabolism, insulin sensitivity, and weight management makes it a preferred ingredient in pharmaceutical and nutraceutical formulations. Its role in enhancing nutrient absorption and regulating lipid profiles further contributes to its growing popularity. Additionally, ongoing clinical studies continue to validate its safety and effectiveness, encouraging wider adoption across health-focused industries.

Increasing consumer awareness of metabolic health and rising prevalence of diabetes and obesity are driving demand for chromium picolinate-based supplements, especially in food-grade and pharmaceutical applications. Innovations in manufacturing ensure high purity and bioavailability, enhancing product performance and safety.

As health-conscious consumers seek effective, natural supplements for blood sugar control and energy metabolism, the chromium picolinate market outlook remains strong. With companies focusing on regulatory compliance and sustainable sourcing, chromium picolinate is well-positioned to grow across dietary supplements, functional foods, and pharmaceutical sectors.

Chromium Picolinate Market Analysis by Top Investment Segments

The market is segmented by grade, end use, and region. By grade, the market is divided into food grade, pharmaceutical grade, and others (industrial grade and cosmetic grade). Based on end use, the market is segmented into food & beverage industry, dietary supplement industry, nutraceutical industry, pharmaceutical industry, and others (animal feed and personal care products). Regionally, the market is classified into North America, Latin America, Western Europe, Eastern Europe, South Asia and Pacific, East Asia, and the Middle East and Africa.
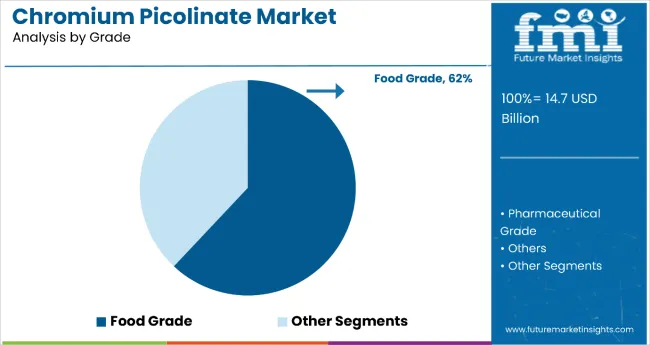
By Grade, Food Grade Accounts for 62% of the Market Share

Chromium Picolinate Market By Grade

The food grade segment dominates the chromium picolinate market with a commanding 62% share in 2025, driven by growing consumer preference for functional foods and dietary supplements fortified with chromium picolinate, recognized for its benefits in glucose metabolism and weight management. Food-grade chromium picolinate is extensively used in food and beverage products such as energy bars, meal replacements, and fortified drinks, enabling manufacturers to target health-conscious consumers seeking natural metabolic enhancers.

Rising awareness of diabetes management and obesity prevention fuels demand, supported by regulatory approvals for functional food applications. Manufacturers are investing in innovative, bioavailable formulations that maintain chromium stability during processing and storage, positioning the segment for steady growth as health-focused product portfolios expand.
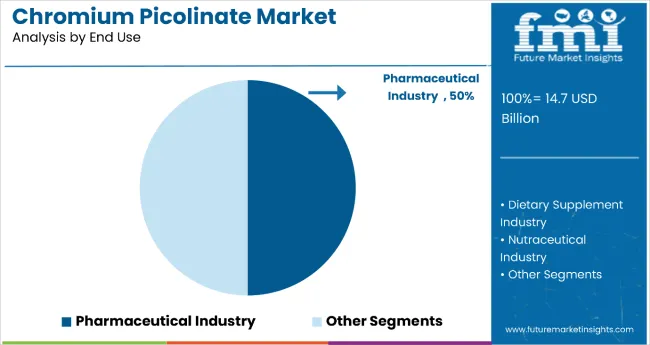
By End Use, Pharmaceutical Industry Account for 50% of the Market Share

Chromium Picolinate Market By End Use

The pharmaceutical industry holds a significant 50% share of the chromium picolinate market, reflecting its critical role in formulations supporting glucose metabolism, insulin sensitivity, and weight management, key factors in managing diabetes and metabolic disorders. Pharmaceutical companies are increasingly incorporating chromium picolinate into treatments for type 2 diabetes, metabolic syndrome, and obesity-related conditions.

Beyond pharmaceuticals, the compound is gaining traction in nutraceutical and dietary supplement industries, catering to consumers seeking natural bioactive compounds for wellness and preventive health. While the food & beverage and other sectors (personal care, animal feed, cosmetics) contribute to the market, their shares remain comparatively smaller.

What are the Drivers, Restraints, and Key Trends of the Chromium Picolinate Market?

Between 2025 and 2035, increasing prevalence of metabolic disorders such as diabetes, obesity, and insulin resistance has propelled the adoption of chromium picolinate in pharmaceutical and nutraceutical formulations. Pharmaceutical companies are prioritizing bioactive compounds that improve glucose metabolism and insulin sensitivity, positioning chromium picolinate as a critical ingredient in advanced therapeutic and preventive products.

Efficacy and Safety Concerns Pose Market Challenges

Despite its benefits, the market faces challenges due to regulatory scrutiny over safety concerns linked to long-term high-dose consumption. Some studies have raised questions about potential toxicity, which can limit product approvals and consumer acceptance. Additionally, inconsistent quality and lack of standardized formulations across manufacturers create barriers to widespread adoption. High competition from alternative supplements for metabolic health, such as magnesium and cinnamon extracts, also restrains market growth, making it essential for producers to ensure rigorous quality control and clinical validation.

Rising Demand for Weight Management Supplements Fuels Growth

The market is evolving with increased focus on clinical-backed formulations and combination supplements targeting multifactorial metabolic conditions. There is growing consumer preference for clean-label, natural-origin chromium sources, driving manufacturers to invest in sustainable and traceable supply chains. Innovation in delivery forms, such as liposomal and time-release capsules, is enhancing bioavailability and patient compliance.
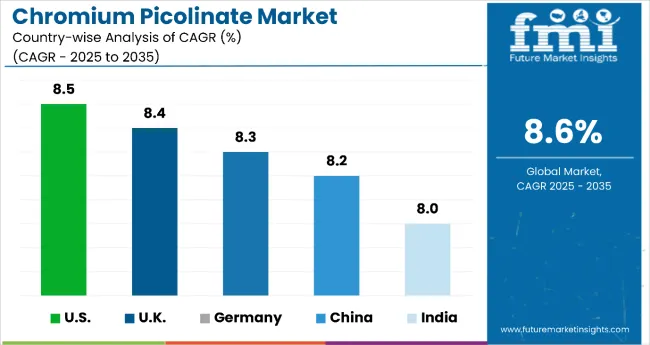
Analysis of Chromium Picolinate Market by Key Countries

Chromium Picolinate Market By Country

Countries CAGR
USA 8.5%
UK 8.4%
Germany 8.3%
China 8.2%
India 8.0%

The market is experiencing strong growth across all key countries, with CAGR values ranging from 8.0% to 8.5% between 2025 and 2035. The USA leads slightly with the highest CAGR of 8.5%, supported by advanced R&D infrastructure and high consumer demand for metabolic health supplements. Close behind, the UK is projected to grow at 8.4%, driven by robust healthcare systems and increasing consumer awareness. Germany follows with an 8.3% CAGR, benefiting from a mature healthcare sector and an aging population requiring metabolic and cardiovascular support. China’s market expands at 8.2%, fueled by rising middle-class incomes and strong manufacturing capabilities. India shows a promising CAGR of 8.0%, propelled by a young, health-conscious population and growing e-commerce penetration despite regulatory challenges.

The report covers an in-depth analysis of 40+ countries; five top-performing OECD countries are highlighted below.

Production Capacity Trends in Chromium Picolinate Market in the USA

The USA chromium picolinate market leads with a strong CAGR of 8.5% from 2025 to 2030, driven by rising consumer focus on metabolic health and weight management. Increasing prevalence of diabetes and obesity has accelerated demand for chromium supplements. The country’s advanced R&D infrastructure supports innovation in nutraceutical formulations, boosting product efficacy and diversity. Regulatory oversight from the FDA ensures high-quality standards, building consumer trust. Moreover, widespread online and retail distribution channels expand accessibility. Leading supplement manufacturers continuously invest in product development and marketing to meet growing consumer demand. This robust ecosystem positions the USA as a critical hub for both production and consumption in the market.

  • The USA has high consumer demand for metabolic health supplements.
  • Advanced research and development facilities in the country drive innovation.
  • Regulatory support from the FDA ensures the safety and quality of products.

Production Outlook Trends in Chromium Picolinate Market in the UK

The UK chromium picolinate demand is projected to grow at a CAGR of 8.4% from 2025 to 2035, driven by increasing consumer interest in metabolic health and weight management supplements. Rising awareness of diabetes and obesity management is fueling demand. The country’s well-established healthcare system and strong regulatory framework ensure high-quality product standards, fostering consumer trust. Additionally, growth in online retail and specialty health stores enhances product availability. Innovation in nutraceutical formulations by key players is expanding product offerings. The UK is positioned as a significant market for both consumption and production in Europe.

  • The UK market benefits from rising health and wellness awareness.
  • Strict regulatory oversight promotes product safety and quality.
  • Online and offline retail channels improve accessibility.

Structural Adoption in Chromium Picolinate Market in Germany

Sales of chromium picolinate in Germany are expected to grow at a CAGR of 8.3%, driven by a mature healthcare system and a population with high health awareness. The country’s aging demographic increases demand for supplements supporting metabolic and cardiovascular health. Strict regulatory policies ensure product safety and high quality, fostering strong consumer confidence. Germany’s robust pharmaceutical and nutraceutical sectors support research and innovation, driving product development. Responsible sourcing and ethical manufacturing practices are gaining importance among consumers. Moreover, established retail networks and increasing online sales contribute to widespread market penetration. These factors make Germany a key European market for Chromium Picolinate with steady growth prospects.

  • Germany’s aging population is increasing demand for health supplements.
  • Strict regulatory standards ensure the safety and quality of products.
  • The pharmaceutical and nutraceutical sectors are highly developed.

Supply Capacity Growth in Chromium Picolinate Market in China

Revenue from chromium picolinate in China is projected to grow at a CAGR of 8.2%, driven by increasing health awareness among its population and rapid urbanization. Rising cases of lifestyle-related diseases such as diabetes are encouraging supplement use. China’s strong manufacturing base supports both domestic consumption and export, making it a significant global supplier. However, regulatory frameworks are evolving to ensure quality and safety, which may initially slow expansion but ultimately enhance market credibility. The growing middle class with higher disposable incomes fuels demand for dietary supplements. Additionally, government health initiatives promote preventive care, further expanding market potential. China is quickly becoming a pivotal player in production capacity and global supply chains for Chromium Picolinate.

  • China is expanding its manufacturing capabilities rapidly.
  • The growing middle-class population is becoming more health-conscious.
  • Government health initiatives are supporting preventive healthcare.

Capacity Increase in Chromium Picolinate Market in India

Sales of chromium picolinate in India are witnessing rapid expansion with an expected CAGR of 8.0%, led by rising health consciousness and increased spending on dietary supplements. The country’s young population is driving demand for weight management and fitness supplements. Government initiatives promoting nutrition and wellness are strengthening market growth. Additionally, rapid growth of e-commerce platforms is increasing product accessibility across urban and semi-urban regions. However, regulatory challenges and limited consumer awareness pose hurdles that manufacturers are addressing through educational campaigns. The expanding nutraceutical industry, combined with cost-effective manufacturing, makes India a key growth market and emerging export hub for Chromium Picolinate.
  • India’s young population is increasingly health-conscious.
  • Demand for weight management and fitness supplements is rising.
  • Manufacturers are focusing on overcoming regulatory and awareness challenges.

Competitive Landscape of Chromium Picolinate Market

Chromium Picolinate Market By Company

The market is moderately consolidated, with key players focusing on high-purity compound manufacturing and specialized formulation expertise. Lonza Group, holding a significant 10% market share, leads in supplying pharmaceutical-grade chromium picolinate used in dietary supplements and therapeutic products. Their strengths include advanced manufacturing processes and strict regulatory adherence.

Other major players like Nutrition 21 and Inter Health Nutraceuticals emphasize research-backed formulations and innovation to enhance bioavailability and efficacy. Companies such as Gnosis by Lesaffre and Zhejiang Tianyu Pharmaceutical prioritize large-scale production and cost-efficient extraction techniques, catering primarily to food-grade and nutraceutical sectors.

Regional manufacturers focus on local market needs by offering customized chromium picolinate products with consistent quality and supply reliability. Entry barriers remain high due to the complex synthesis process, regulatory approval challenges, and stringent quality standards, making purity, efficacy, and certifications critical competitive factors in this market.

Scope of the Report - Chromium Picolinate Market

Item Value
Quantitative Units (2025) USD 14.7 billion
Grade Food Grade, Pharmaceutical Grade, and Others (industrial and cosmetic grade)
End Use Food & Beverage Industry, Dietary Supplement Industry, Nutraceutical Industry, Pharmaceutical Industry, and Others (Cosmetics, Animal Nutrition, a nd Personal Care Products)
Regions Covered North America, Europe, Asia-Pacific, Latin America, Middle East & Africa
Countries Covered United States, Canada, United Kingdom, Germany, France, China, Japan, South Korea, Brazil, Australia and 40+ countries
Key Companies Profiled Amsal Chem Private Limited, Merck KGaA, Mubychem Group, Celtic Chemicals Ltd., Resonance Specialities Ltd., Yihan Industrial Co., Ltd., Sellwell (Group) Chemical Factory, Cambridge Commodities Limited, Chemlock Metals Corporation, Oceanic Laboratories Pvt. Ltd., Anmol Chemicals Group, Salvi Chemical Industries Ltd.
Additional Attributes Rising demand in pharmaceutical and nutraceutical applications, growing adoption in dietary supplements and functional foods, increasing focus on weight management and glucose metabolism, advancements in formulation technologies, regulatory compliance and quality standardization

Key Segments

By Grade:

  • Food Grade
  • Pharmaceutical Grade
  • Others (Industrial and Cosmetic Grade)

By End Use:

  • Food & Beverage Industry
  • Dietary Supplement Industry
  • Nutraceutical Industry
  • Pharmaceutical Industry
  • Others (Cosmetics, Animal Nutrition, and Personal Care Products)

By Region:

  • North America
  • Latin America
  • Western Europe
  • Eastern Europe
  • East Asia
  • South Asia & Pacific
  • Middle East and Africa

Frequently Asked Questions

How big is the chromium picolinate market in 2025?

The global chromium picolinate market is estimated to be valued at USD 14.7 billion in 2025.

What will be the size of chromium picolinate market in 2035?

The market size for the chromium picolinate market is projected to reach USD 32.2 billion by 2035.

How much will be the chromium picolinate market growth between 2025 and 2035?

The chromium picolinate market is expected to grow at a 8.2% CAGR between 2025 and 2035.

What are the key product types in the chromium picolinate market?

The key product types in chromium picolinate market are food grade, pharmaceutical grade and others (industrial and cosmetic grade).

Which end use segment to contribute significant share in the chromium picolinate market in 2025?

In terms of end use, dietary supplement industry segment to command 38.2% share in the chromium picolinate market in 2025.

Table of Content

  1. Executive Summary
    • Global Market Outlook
    • Demand-side Trends
    • Supply-side Trends
    • Technology Roadmap Analysis
    • Analysis and Recommendations
  2. Market Overview
    • Market Coverage / Taxonomy
    • Market Definition / Scope / Limitations
  3. Market Background
    • Market Dynamics
      • Drivers
      • Restraints
      • Opportunity
      • Trends
    • Scenario Forecast
      • Demand in Optimistic Scenario
      • Demand in Likely Scenario
      • Demand in Conservative Scenario
    • Opportunity Map Analysis
    • Product Life Cycle Analysis
    • Supply Chain Analysis
    • Investment Feasibility Matrix
    • Value Chain Analysis
    • PESTLE and Porter’s Analysis
    • Regulatory Landscape
    • Regional Parent Market Outlook
    • Production and Consumption Statistics
    • Import and Export Statistics
  4. Global Market Analysis 2020 to 2024 and Forecast, 2025 to 2035
    • Historical Market Size Value (USD Million) Analysis, 2020 to 2024
    • Current and Future Market Size Value (USD Million) Projections, 2025 to 2035
      • Y-o-Y Growth Trend Analysis
      • Absolute $ Opportunity Analysis
  5. Global Market Pricing Analysis 2020 to 2024 and Forecast 2025 to 2035
  6. Global Market Analysis 2020 to 2024 and Forecast 2025 to 2035, By Grade
    • Introduction / Key Findings
    • Historical Market Size Value (USD Million) Analysis By Grade , 2020 to 2024
    • Current and Future Market Size Value (USD Million) Analysis and Forecast By Grade , 2025 to 2035
      • Food Grade
      • Pharmaceutical Grade
      • Others (Industrial And Cosmetic Grade)
    • Y-o-Y Growth Trend Analysis By Grade , 2020 to 2024
    • Absolute $ Opportunity Analysis By Grade , 2025 to 2035
  7. Global Market Analysis 2020 to 2024 and Forecast 2025 to 2035, By End Use
    • Introduction / Key Findings
    • Historical Market Size Value (USD Million) Analysis By End Use, 2020 to 2024
    • Current and Future Market Size Value (USD Million) Analysis and Forecast By End Use, 2025 to 2035
      • Dietary Supplement Industry
      • Food & Beverage Industry
      • Nutraceutical Industry
      • Pharmaceutical Industry
      • Others (Cosmetics, Animal Nutrition, And Personal Care Products)
    • Y-o-Y Growth Trend Analysis By End Use, 2020 to 2024
    • Absolute $ Opportunity Analysis By End Use, 2025 to 2035
  8. Global Market Analysis 2020 to 2024 and Forecast 2025 to 2035, By Region
    • Introduction
    • Historical Market Size Value (USD Million) Analysis By Region, 2020 to 2024
    • Current Market Size Value (USD Million) Analysis and Forecast By Region, 2025 to 2035
      • North America
      • Latin America
      • Western Europe
      • Eastern Europe
      • East Asia
      • South Asia and Pacific
      • Middle East & Africa
    • Market Attractiveness Analysis By Region
  9. North America Market Analysis 2020 to 2024 and Forecast 2025 to 2035, By Country
    • Historical Market Size Value (USD Million) Trend Analysis By Market Taxonomy, 2020 to 2024
    • Market Size Value (USD Million) Forecast By Market Taxonomy, 2025 to 2035
      • By Country
        • USA
        • Canada
        • Mexico
      • By Grade
      • By End Use
    • Market Attractiveness Analysis
      • By Country
      • By Grade
      • By End Use
    • Key Takeaways
  10. Latin America Market Analysis 2020 to 2024 and Forecast 2025 to 2035, By Country
    • Historical Market Size Value (USD Million) Trend Analysis By Market Taxonomy, 2020 to 2024
    • Market Size Value (USD Million) Forecast By Market Taxonomy, 2025 to 2035
      • By Country
        • Brazil
        • Chile
        • Rest of Latin America
      • By Grade
      • By End Use
    • Market Attractiveness Analysis
      • By Country
      • By Grade
      • By End Use
    • Key Takeaways
  11. Western Europe Market Analysis 2020 to 2024 and Forecast 2025 to 2035, By Country
    • Historical Market Size Value (USD Million) Trend Analysis By Market Taxonomy, 2020 to 2024
    • Market Size Value (USD Million) Forecast By Market Taxonomy, 2025 to 2035
      • By Country
        • Germany
        • UK
        • Italy
        • Spain
        • France
        • Nordic
        • BENELUX
        • Rest of Western Europe
      • By Grade
      • By End Use
    • Market Attractiveness Analysis
      • By Country
      • By Grade
      • By End Use
    • Key Takeaways
  12. Eastern Europe Market Analysis 2020 to 2024 and Forecast 2025 to 2035, By Country
    • Historical Market Size Value (USD Million) Trend Analysis By Market Taxonomy, 2020 to 2024
    • Market Size Value (USD Million) Forecast By Market Taxonomy, 2025 to 2035
      • By Country
        • Russia
        • Poland
        • Hungary
        • Balkan & Baltic
        • Rest of Eastern Europe
      • By Grade
      • By End Use
    • Market Attractiveness Analysis
      • By Country
      • By Grade
      • By End Use
    • Key Takeaways
  13. East Asia Market Analysis 2020 to 2024 and Forecast 2025 to 2035, By Country
    • Historical Market Size Value (USD Million) Trend Analysis By Market Taxonomy, 2020 to 2024
    • Market Size Value (USD Million) Forecast By Market Taxonomy, 2025 to 2035
      • By Country
        • China
        • Japan
        • South Korea
      • By Grade
      • By End Use
    • Market Attractiveness Analysis
      • By Country
      • By Grade
      • By End Use
    • Key Takeaways
  14. South Asia and Pacific Market Analysis 2020 to 2024 and Forecast 2025 to 2035, By Country
    • Historical Market Size Value (USD Million) Trend Analysis By Market Taxonomy, 2020 to 2024
    • Market Size Value (USD Million) Forecast By Market Taxonomy, 2025 to 2035
      • By Country
        • India
        • ASEAN
        • Australia & New Zealand
        • Rest of South Asia and Pacific
      • By Grade
      • By End Use
    • Market Attractiveness Analysis
      • By Country
      • By Grade
      • By End Use
    • Key Takeaways
  15. Middle East & Africa Market Analysis 2020 to 2024 and Forecast 2025 to 2035, By Country
    • Historical Market Size Value (USD Million) Trend Analysis By Market Taxonomy, 2020 to 2024
    • Market Size Value (USD Million) Forecast By Market Taxonomy, 2025 to 2035
      • By Country
        • Kingdom of Saudi Arabia
        • Other GCC Countries
        • Turkiye
        • South Africa
        • Other African Union
        • Rest of Middle East & Africa
      • By Grade
      • By End Use
    • Market Attractiveness Analysis
      • By Country
      • By Grade
      • By End Use
    • Key Takeaways
  16. Key Countries Market Analysis
    • USA
      • Pricing Analysis
      • Market Share Analysis, 2024
        • By Grade
        • By End Use
    • Canada
      • Pricing Analysis
      • Market Share Analysis, 2024
        • By Grade
        • By End Use
    • Mexico
      • Pricing Analysis
      • Market Share Analysis, 2024
        • By Grade
        • By End Use
    • Brazil
      • Pricing Analysis
      • Market Share Analysis, 2024
        • By Grade
        • By End Use
    • Chile
      • Pricing Analysis
      • Market Share Analysis, 2024
        • By Grade
        • By End Use
    • Germany
      • Pricing Analysis
      • Market Share Analysis, 2024
        • By Grade
        • By End Use
    • UK
      • Pricing Analysis
      • Market Share Analysis, 2024
        • By Grade
        • By End Use
    • Italy
      • Pricing Analysis
      • Market Share Analysis, 2024
        • By Grade
        • By End Use
    • Spain
      • Pricing Analysis
      • Market Share Analysis, 2024
        • By Grade
        • By End Use
    • France
      • Pricing Analysis
      • Market Share Analysis, 2024
        • By Grade
        • By End Use
    • India
      • Pricing Analysis
      • Market Share Analysis, 2024
        • By Grade
        • By End Use
    • ASEAN
      • Pricing Analysis
      • Market Share Analysis, 2024
        • By Grade
        • By End Use
    • Australia & New Zealand
      • Pricing Analysis
      • Market Share Analysis, 2024
        • By Grade
        • By End Use
    • China
      • Pricing Analysis
      • Market Share Analysis, 2024
        • By Grade
        • By End Use
    • Japan
      • Pricing Analysis
      • Market Share Analysis, 2024
        • By Grade
        • By End Use
    • South Korea
      • Pricing Analysis
      • Market Share Analysis, 2024
        • By Grade
        • By End Use
    • Russia
      • Pricing Analysis
      • Market Share Analysis, 2024
        • By Grade
        • By End Use
    • Poland
      • Pricing Analysis
      • Market Share Analysis, 2024
        • By Grade
        • By End Use
    • Hungary
      • Pricing Analysis
      • Market Share Analysis, 2024
        • By Grade
        • By End Use
    • Kingdom of Saudi Arabia
      • Pricing Analysis
      • Market Share Analysis, 2024
        • By Grade
        • By End Use
    • Turkiye
      • Pricing Analysis
      • Market Share Analysis, 2024
        • By Grade
        • By End Use
    • South Africa
      • Pricing Analysis
      • Market Share Analysis, 2024
        • By Grade
        • By End Use
  17. Market Structure Analysis
    • Competition Dashboard
    • Competition Benchmarking
    • Market Share Analysis of Top Players
      • By Regional
      • By Grade
      • By End Use
  18. Competition Analysis
    • Competition Deep Dive
      • Amsal Chem Private Limited
        • Overview
        • Product Portfolio
        • Profitability by Market Segments (Product/Age /Sales Channel/Region)
        • Sales Footprint
        • Strategy Overview
          • Marketing Strategy
          • Product Strategy
          • Channel Strategy
      • Merck KGaA
      • Mubychem Group
      • Celtic Chemicals Ltd.
      • Resonance Specialities Ltd.
      • Yihan Industrial Co., Ltd.
      • Sellwell (Group) Chemical Factory
      • Cambridge Commodities Limited
      • Chemlock Metals Corporation
      • Oceanic Laboratories Pvt. Ltd.
      • Anmol Chemicals Group
      • Salvi Chemical Industries Ltd.
  19. Assumptions & Acronyms Used
  20. Research Methodology

List of Tables

  • Table 1: Global Market Value (USD Million) Forecast by Region, 2020 to 2035
  • Table 2: Global Market Value (USD Million) Forecast by Grade , 2020 to 2035
  • Table 3: Global Market Value (USD Million) Forecast by End Use, 2020 to 2035
  • Table 4: North America Market Value (USD Million) Forecast by Country, 2020 to 2035
  • Table 5: North America Market Value (USD Million) Forecast by Grade , 2020 to 2035
  • Table 6: North America Market Value (USD Million) Forecast by End Use, 2020 to 2035
  • Table 7: Latin America Market Value (USD Million) Forecast by Country, 2020 to 2035
  • Table 8: Latin America Market Value (USD Million) Forecast by Grade , 2020 to 2035
  • Table 9: Latin America Market Value (USD Million) Forecast by End Use, 2020 to 2035
  • Table 10: Western Europe Market Value (USD Million) Forecast by Country, 2020 to 2035
  • Table 11: Western Europe Market Value (USD Million) Forecast by Grade , 2020 to 2035
  • Table 12: Western Europe Market Value (USD Million) Forecast by End Use, 2020 to 2035
  • Table 13: Eastern Europe Market Value (USD Million) Forecast by Country, 2020 to 2035
  • Table 14: Eastern Europe Market Value (USD Million) Forecast by Grade , 2020 to 2035
  • Table 15: Eastern Europe Market Value (USD Million) Forecast by End Use, 2020 to 2035
  • Table 16: East Asia Market Value (USD Million) Forecast by Country, 2020 to 2035
  • Table 17: East Asia Market Value (USD Million) Forecast by Grade , 2020 to 2035
  • Table 18: East Asia Market Value (USD Million) Forecast by End Use, 2020 to 2035
  • Table 19: South Asia and Pacific Market Value (USD Million) Forecast by Country, 2020 to 2035
  • Table 20: South Asia and Pacific Market Value (USD Million) Forecast by Grade , 2020 to 2035
  • Table 21: South Asia and Pacific Market Value (USD Million) Forecast by End Use, 2020 to 2035
  • Table 22: Middle East & Africa Market Value (USD Million) Forecast by Country, 2020 to 2035
  • Table 23: Middle East & Africa Market Value (USD Million) Forecast by Grade , 2020 to 2035
  • Table 24: Middle East & Africa Market Value (USD Million) Forecast by End Use, 2020 to 2035

List of Figures

  • Figure 1: Global Market Pricing Analysis
  • Figure 2: Global Market Value (USD Million) Forecast 2020 to 2035
  • Figure 3: Global Market Value Share and BPS Analysis by Grade , 2025 and 2035
  • Figure 4: Global Market Y-o-Y Growth Comparison by Grade , 2025 to 2035
  • Figure 5: Global Market Attractiveness Analysis by Grade
  • Figure 6: Global Market Value Share and BPS Analysis by End Use, 2025 and 2035
  • Figure 7: Global Market Y-o-Y Growth Comparison by End Use, 2025 to 2035
  • Figure 8: Global Market Attractiveness Analysis by End Use
  • Figure 9: Global Market Value (USD Million) Share and BPS Analysis by Region, 2025 and 2035
  • Figure 10: Global Market Y-o-Y Growth Comparison by Region, 2025 to 2035
  • Figure 11: Global Market Attractiveness Analysis by Region
  • Figure 12: North America Market Incremental Dollar Opportunity, 2025 to 2035
  • Figure 13: Latin America Market Incremental Dollar Opportunity, 2025 to 2035
  • Figure 14: Western Europe Market Incremental Dollar Opportunity, 2025 to 2035
  • Figure 15: Eastern Europe Market Incremental Dollar Opportunity, 2025 to 2035
  • Figure 16: East Asia Market Incremental Dollar Opportunity, 2025 to 2035
  • Figure 17: South Asia and Pacific Market Incremental Dollar Opportunity, 2025 to 2035
  • Figure 18: Middle East & Africa Market Incremental Dollar Opportunity, 2025 to 2035
  • Figure 19: North America Market Value Share and BPS Analysis by Country, 2025 and 2035
  • Figure 20: North America Market Value Share and BPS Analysis by Grade , 2025 and 2035
  • Figure 21: North America Market Y-o-Y Growth Comparison by Grade , 2025 to 2035
  • Figure 22: North America Market Attractiveness Analysis by Grade
  • Figure 23: North America Market Value Share and BPS Analysis by End Use, 2025 and 2035
  • Figure 24: North America Market Y-o-Y Growth Comparison by End Use, 2025 to 2035
  • Figure 25: North America Market Attractiveness Analysis by End Use
  • Figure 26: Latin America Market Value Share and BPS Analysis by Country, 2025 and 2035
  • Figure 27: Latin America Market Value Share and BPS Analysis by Grade , 2025 and 2035
  • Figure 28: Latin America Market Y-o-Y Growth Comparison by Grade , 2025 to 2035
  • Figure 29: Latin America Market Attractiveness Analysis by Grade
  • Figure 30: Latin America Market Value Share and BPS Analysis by End Use, 2025 and 2035
  • Figure 31: Latin America Market Y-o-Y Growth Comparison by End Use, 2025 to 2035
  • Figure 32: Latin America Market Attractiveness Analysis by End Use
  • Figure 33: Western Europe Market Value Share and BPS Analysis by Country, 2025 and 2035
  • Figure 34: Western Europe Market Value Share and BPS Analysis by Grade , 2025 and 2035
  • Figure 35: Western Europe Market Y-o-Y Growth Comparison by Grade , 2025 to 2035
  • Figure 36: Western Europe Market Attractiveness Analysis by Grade
  • Figure 37: Western Europe Market Value Share and BPS Analysis by End Use, 2025 and 2035
  • Figure 38: Western Europe Market Y-o-Y Growth Comparison by End Use, 2025 to 2035
  • Figure 39: Western Europe Market Attractiveness Analysis by End Use
  • Figure 40: Eastern Europe Market Value Share and BPS Analysis by Country, 2025 and 2035
  • Figure 41: Eastern Europe Market Value Share and BPS Analysis by Grade , 2025 and 2035
  • Figure 42: Eastern Europe Market Y-o-Y Growth Comparison by Grade , 2025 to 2035
  • Figure 43: Eastern Europe Market Attractiveness Analysis by Grade
  • Figure 44: Eastern Europe Market Value Share and BPS Analysis by End Use, 2025 and 2035
  • Figure 45: Eastern Europe Market Y-o-Y Growth Comparison by End Use, 2025 to 2035
  • Figure 46: Eastern Europe Market Attractiveness Analysis by End Use
  • Figure 47: East Asia Market Value Share and BPS Analysis by Country, 2025 and 2035
  • Figure 48: East Asia Market Value Share and BPS Analysis by Grade , 2025 and 2035
  • Figure 49: East Asia Market Y-o-Y Growth Comparison by Grade , 2025 to 2035
  • Figure 50: East Asia Market Attractiveness Analysis by Grade
  • Figure 51: East Asia Market Value Share and BPS Analysis by End Use, 2025 and 2035
  • Figure 52: East Asia Market Y-o-Y Growth Comparison by End Use, 2025 to 2035
  • Figure 53: East Asia Market Attractiveness Analysis by End Use
  • Figure 54: South Asia and Pacific Market Value Share and BPS Analysis by Country, 2025 and 2035
  • Figure 55: South Asia and Pacific Market Value Share and BPS Analysis by Grade , 2025 and 2035
  • Figure 56: South Asia and Pacific Market Y-o-Y Growth Comparison by Grade , 2025 to 2035
  • Figure 57: South Asia and Pacific Market Attractiveness Analysis by Grade
  • Figure 58: South Asia and Pacific Market Value Share and BPS Analysis by End Use, 2025 and 2035
  • Figure 59: South Asia and Pacific Market Y-o-Y Growth Comparison by End Use, 2025 to 2035
  • Figure 60: South Asia and Pacific Market Attractiveness Analysis by End Use
  • Figure 61: Middle East & Africa Market Value Share and BPS Analysis by Country, 2025 and 2035
  • Figure 62: Middle East & Africa Market Value Share and BPS Analysis by Grade , 2025 and 2035
  • Figure 63: Middle East & Africa Market Y-o-Y Growth Comparison by Grade , 2025 to 2035
  • Figure 64: Middle East & Africa Market Attractiveness Analysis by Grade
  • Figure 65: Middle East & Africa Market Value Share and BPS Analysis by End Use, 2025 and 2035
  • Figure 66: Middle East & Africa Market Y-o-Y Growth Comparison by End Use, 2025 to 2035
  • Figure 67: Middle East & Africa Market Attractiveness Analysis by End Use
  • Figure 68: Global Market – Tier Structure Analysis
  • Figure 69: Global Market – Company Share Analysis
Dashboard
Dashboard
Dashboard
Dashboard
Dashboard
Dashboard

Full Research Suite comprises of:

Market outlook & trends analysis

Market outlook & trends analysis

Interviews & case studies

Interviews & case studies

Strategic recommendations

Strategic recommendations

Vendor profiles & capabilities analysis

Vendor profiles & capabilities analysis

5-year forecasts

5-year forecasts

8 regions and 60+ country-level data splits

8 regions and 60+ country-level data splits

Market segment data splits

Market segment data splits

12 months of continuous data updates

12 months of continuous data updates

DELIVERED AS:

PDF EXCEL ONLINE

Full Research Suite


$3500

$5000

$6500

Buy Report Now
Similar Industry Reports

Similar Industry Reports

Chromium Polynicotinate Market

Chromium Polynicotinate Market Size and Share Forecast Outlook 2025 to 2035

Chromium Trioxide Market

Chromium Trioxide Market Size and Share Forecast Outlook 2025 to 2035

Chromium Salts Market

Chromium Salts Market Trends - Growth, Demand & Forecast 2025 to 2035

Future Market Insights

Chromium Picolinate Market

Chat With MaRIA

Chat With

MaRIA

Hi There, I am MaRIA, Your Market Research Intelligence Assistant. How may I help you?