Chromium Salts Market Size and Share Forecast Outlook 2025 to 2035

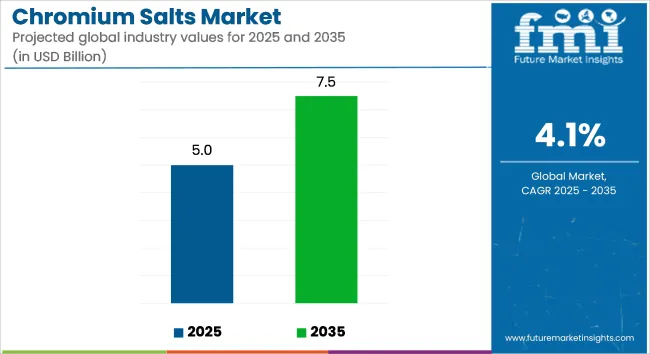
The global chromium salts market is estimated at USD 5.0 billion in 2025 and reach USD 7.5 billion by 2035, reflecting a CAGR of 4.1% during the forecast period. Market expansion is being driven by increasing industrial demand across sectors such as dyes and pigments, leather tanning, metallurgy, and catalysis.
Quick Stats of Chromium Salts Market

  • Industry Value (2025): USD 5.0 billion
  • Forecast Value (2035): USD 7.5 billion
  • Forecast CAGR: 4.1%
  • Leading Segment in 2025: Chromium(III) Salts (58% share)
  • Key Growth Region: South Asia, North America, Europe
  • Top Key Players: Merck Millipore, Sigma-Aldrich, Lanxess AG, Vishnu Chemicals, Yildirim Holding A.S.

Chromium Salts Market Industry Value Analysis

Metric Value
Industry Size (2025E) USD 5.0 billion
Industry Value (2035F) USD 7.5 billion
CAGR (2025 to 2035) 4.1%

Chromium salts are being utilized for their chemical versatility and functional properties, including corrosion resistance, color stability, and catalytic reactivity. In the leather industry, chromium(III) sulfate is being applied extensively for tanning processes to improve leather durability and flexibility. The metal treatment industry is using chromium salts to enhance surface hardness, wear resistance, and aesthetic finishes in automotive and aerospace components.

Chromic chloride is being deployed in electroplating applications, where it functions as a catalyst in surface coating and corrosion resistance. Chromium nitrate is being used in dyeing operations and as a rust inhibitor in industrial treatments, while chromic sulfate remains a primary input in leather processing.

Despite broad industrial applicability, concerns regarding hexavalent chromium compounds are prompting regulatory scrutiny and driving research into safer alternatives. Environmental and occupational health impacts associated with certain chromium compounds are leading manufacturers to focus on trivalent chromium formulations and adopt process innovations that reduce toxicity and waste generation.

The demand for chromium-based pigments in paints, coatings, and textile dyes continues to grow, particularly in applications where high weatherability and color retention are essential. In structural metals and industrial fabrication, chromium salts are being preferred for enhancing longevity and corrosion resistance under harsh conditions.

Research and development efforts are being directed toward improving the efficiency of chromium recycling and reducing environmental footprint. Additionally, increased compliance requirements under frameworks such as REACH in Europe and TSCA in the United States are shaping procurement standards and material usage.

The chromium salts market is expected to maintain steady growth through 2035, supported by its critical role in performance-based industrial applications and ongoing advancements in safer, high-purity chromium formulations for regulated end-use environments.
Analyzing Chromium Salts Market by Top Investment Segments

Chromium(III) salts are projected to lead product demand due to their predominant use in tanning and rising preference over hexavalent alternatives

Chromium Salts Market Analysis By Type

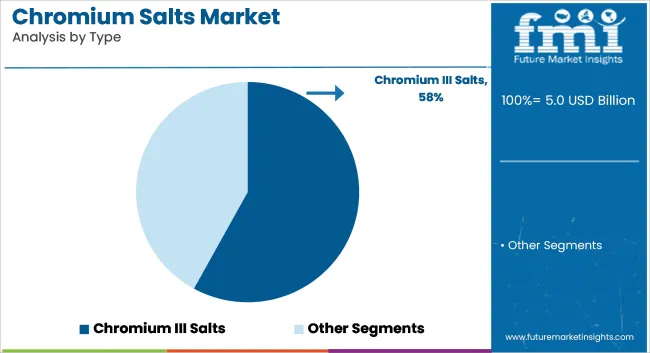
Chromium(III) salts are estimated to account for approximately 58% of the global chromium salts market share in 2025 and are projected to grow at a CAGR of 4.2% through 2035. Among these, chromium(III) sulfate and chromium(III) chloride are widely used in leather tanning processes due to their high reactivity with collagen and lower toxicity compared to chromium(VI) salts.

As environmental and occupational safety regulations tighten, especially in the EU and North America, chromium(III) compounds are increasingly replacing hexavalent chromium in several end-use industries. Tanning remains the largest consumer of chromium(III) salts, supported by consistent demand from South Asia’s leather manufacturing hubs and global fashion and footwear sectors.
Metallurgy is expected to dominate application demand due to chromium's critical role in alloy strengthening and corrosion resistance

Chromium Salts Market Analysis By Application

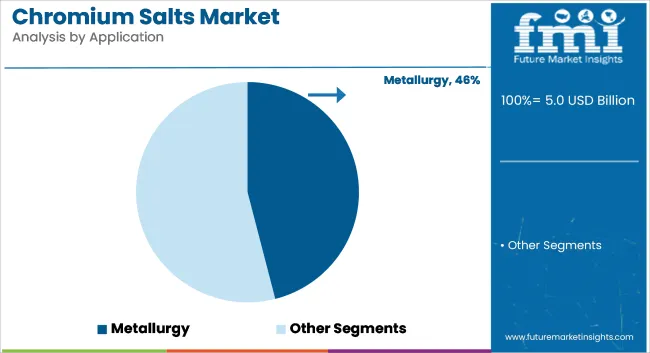
The metallurgy segment is projected to hold approximately 46% of the global chromium salts market share in 2025 and is expected to grow at a CAGR of 4.3% through 2035. Chromium salts are essential in producing corrosion-resistant alloys, electroplated components, and stainless steel, offering improved hardness, wear resistance, and surface finish. Electroplating processes in automotive, electronics, and industrial machinery sectors continue to drive demand, particularly for chromium(VI) compounds where stringent performance is required.

However, regulatory substitution pressures are steering manufacturers toward trivalent formulations with equivalent anti-corrosive properties. Additionally, the aerospace and refractory materials sectors contribute to steady chromium salt consumption due to the material's high-temperature stability and oxidation resistance. As industrial infrastructure expands globally, the metallurgy segment remains the core demand center for chromium-based chemistries.

Challenges and Opportunities

Challenge: Environmental and Health Concerns

Hexavalent chromium compounds are applied widely in electroplating, leather tanning, and chemical processing among many other uses; thus, its manufacture is risky for several health and environmental concerns. Such dangerous exposure due to chromium compounds were from respiratory and dermatological disorders up to cancers; therefore, the production and handling have been highly controlled in the significant industrial markets.

Government regulations across the world are imposing tighter restrictions on chromium-based emissions, waste disposal, and permissible exposure levels. Manufacturers face a major challenge in high compliance and adaptation costs, necessitating investments in safer chemical processing techniques and alternative formulations.

Opportunity: Development of Eco-Friendly Alternatives

The rising focus on green chemistry solutions presents a major opportunity for the chromium salts market. Companies are actively investing in trivalent chromium compounds as a safer alternative to hexavalent chromium, which reduces toxicity and environmental impact while maintaining strong performance in metal treatment and leather processing applications.

New technological developments have paved ways for the recycling and re-use of chromium compounds, thus avoiding the issues related to waste disposal and making the system cost-effective. Other research projects include developing bio-based, biodegradable alternatives for chromium in industries like textiles, wood preservation, and automotive coating to meet the sustainability goals.
Country-wise Insights

Chromium Salts Market Cagr Analysis By Country

United States

United States chromium salts market is steadily growing due to their wide application in metal finishing, leather tanning, pigments, and wood preservation. Their use in increasing demand for stainless steel and chrome plating in automotive and aerospace industries is acting as a major growth driver. Moreover, environmental regulations are influencing the shift toward eco-friendly chromium compounds, thus boosting opportunities for the development of advanced products.

In the following years, application of chromium salts in catalysts for chemical processes and increasing growth in the construction and automotive sectors should be the contributors to this growth.

Rising Demand from Metal Finishing Industry: The USA metal finishing industry is over USD 30 billionchromium salts are highly utilized by this industry in order to maintain corrosion resistance as well as desired aesthetic properties.

  • Aerospace & Automotive Industry: The automobile market in the United States is expected to reach up to USD 900 billion by 2030. Consequently, chromium plating-based products are likely to increase.
  • Leather Tanning: It is a highly regulated industry. However, despite these restrictions, this industry is consuming large amounts of chromium salts in special applications.
  • Catalysts Industry: Chromium salts find a major application in catalyst development tailored for petrochemical and polymer industries.
  • Regulatory Environment from an innovation perspective: The emphasis is on trivalent chromium compounds as trivalent compounds are nontoxic compared to hexavalent.
Country CAGR (2025 to 2035)
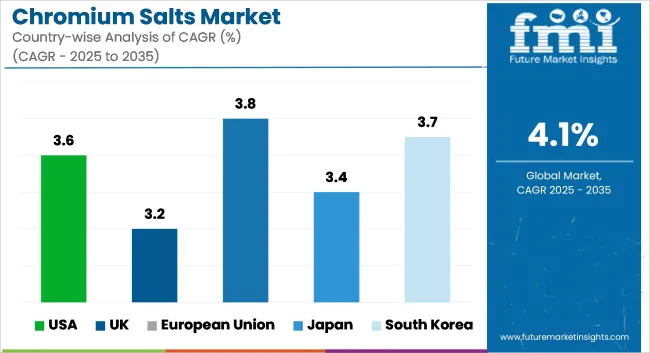
USA 3.6%

United Kingdom

the market for chromium salts in the UK is growing due to the demand from automobile, construction, and chemical segments. REACH has strict regulations, and this has led the market to opt more for trivalent chromium compounds, leading to positive innovation through the use of environmentally friendly products. Chrome-based pigments demand in the coatings industry is also propelling the market upward; the aerospace industry is also expanding.

  • Government policies on more sustainable production processes and green chemistry are promoting increasing use of alternatives to less hazardous chromium.
  • Harsh Environmental Policies
  • The UK has committed significantly to reduce use of toxic chemicals under the directives of REACH, and its demand for such less toxic options of chromium alternatives is higher
  • Increasing Aerospace Industries
  • UK-based manufacturing of corrosion-proof aerospace sectors is expected to expand at a rate of 4% per year, and hence the demand for such coatings increases.
  • Increasing demand in the construction industry: Usage of chromium salts in cement and concrete for durability as well as aesthetic reasons.
  • Adoption in specialty pigments: Increasing use of chromium-based pigments in high-performance paints and coatings.
  • Technology Advancements in Chrome Plating: Low-toxicity chrome electroplating solutions driving demand in the automotive components industry.
Country CAGR (2025 to 2035)
UK 3.2%

European Union

  • The European Union chromium salts market is marked by stringent environmental policies, henceforth increasing demand for environmentally friendly and low-toxicity chromium salts. The industry is fueled by strong demand from industries like automobile, aerospace, construction, and chemicals.
  • Germany, France, and Italy are the most significant contributors, with strong automotive production and industrial coatings industries. The market is changing due to the adoption of green manufacturing processes and the use of eco-friendly chrome tanning techniques.
  • Strict Compliance with REACH Regulations: The EU's emphasis on chemical safety and sustainability encourages the use of trivalent chromium.
  • Increasing Automobile Production: The EU automobile sector is of the order of €1.3 trillion and major user of chrome plating chemicals
  • Increasing Construction Activities: Increasing demand for chromium-doped cement for improvement in durability in infrastructure products
  • Improved Pigment Uses: Increasing usage of chromium oxide pigments in coatings, plastic, and ceramics
  • Environment-Friendly Leather Tanning: The EU leather industry is gradually shifting to chrome-free tanning technologies to reduce environmental impacts.
Region CAGR (2025 to 2035)
European Union 3.8%

Japan

Demand from electronic components, automotive production, and specialty chemicals is the main driver of the chromium salts market in Japan. High-precision metal finishing for electronic and automotive applications fuels the market growth in Japan. Furthermore, developments in surface treatment technology and awareness about the environment are compelling consumers to switch towards low-toxicity chromium-based compounds.

Environmental consciousness in the manufacturing process of Japan, and stringent regulations against pollution, compel the industries to come up with eco-friendly applications of chrome.

  • Electronics Industry: The electronics sector in Japan is over USD 120 billion using chrome salts for metal plating in semiconductors and devices.
  • Automotive Industry Growth: Huge demand for electric vehicles (EVs) and hybrid cars that require corrosion-resistant coatings.
  • Advancements in Surface Treatment Technology: Nano-chromium coating applied to precision material in aerospace and defense fields.
  • Trivalent Chromium Trends: Increased decreasing of hexavalent chromium utilization in industrial processes with enhanced environmental regulations.
  • High Demand in Speciality Chemicals: chromium salts are substantially used as catalysts for chemical synthesis and polymer production.
Country CAGR (2025 to 2035)
Japan 3.4%

South Korea

South Korea's chromium salts market is growing due to rising automotive manufacturing, electronics, and industrial coatings. Technological growth and green industrial practices in the country push for trivalent chromium compound use, whereas huge demand from construction and chemical processing industries also supports market growth.

Government incentives for sustainable manufacturing and investments in high-performance metal finishing technologies are key market drivers.

  • Automotive Industry Expansion: South Korea’s auto industry produces over 4 million vehicles annually, driving demand for chrome plating materials.
  • Growth in Electronics Manufacturing: The country’s semiconductor exports exceeded USD 150 billion in 2024, with chromium salts used in precision components.
  • Focus on Eco-Friendly Industrial Processes: Government regulations promoting low-toxicity chemicals in industrial applications.
  • Rising Construction Activities: Increasing demand for chromium-modified concrete additives to improve durability and corrosion resistance.
  • Advancements in Chemical Catalysis: Use of chromium salts in polymer production and petrochemical catalysts.
Country CAGR (2025 to 2035)
South Korea 3.7%

Competitive Outlook

Key players are improving the quality and purity of chromium salts to meet industrial demands while focusing on environmentally friendly processes. Innovations aim to reduce toxic by-products and enhance waste management, driven by regulatory pressures. As sustainability becomes a priority, companies are investing in alternative production methods and eco-friendly chromium salts to align with the growing demand for greener industrial solutions.

  • In April 2024, a collaborative study led by researchers from the University of California, Berkeley, and Argonne National Laboratory was reported to have explored chromium chemistry in irradiated molten salts, providing key insights into corrosion mechanisms in next-generation nuclear reactors. The research focused on the behavior of chromium ions under radiation in fluoride-based molten salt environments, which are central to molten salt reactor (MSR) technology. It was found that chromium undergoes redox reactions that influence alloy corrosion rates and long-term reactor stability. The findings were positioned as critical for designing corrosion-resistant structural materials and improving MSR viability.
  • In January 2023, Yildirim Holding A.S. was reported to have acquired the Chromium business of Elementis plc for USD 119 million. The transaction included production assets and intellectual property related to chromium chemicals used in metal finishing, leather tanning, and wood preservation. The acquisition was positioned to strengthen Yildirim’s role in the global chromium value chain and expand its specialty chemicals portfolio.

Companies

  • Merck Millipore (MilliporeSigma)
  • Sigma-Aldrich
  • Loba Chemie
  • Lanxess AG
  • Vishnu Chemicals Limited
  • Aktyubinsk Chromium Chemicals Plant (ACCP)
  • American Elements
  • Hubei Zhenhua Chemical Co., Ltd.

Key Segmentation

By Type:

  • Chromium III Salts
    • Chromium(III) Sulfate
    • Chromium(III) Chloride
  • Chromium VI Salts

By Application:

  • Metallurgy
    • Corrosion-Resistant Alloys
    • Electroplating Processes
    • Stainless Steel Production
  • Tanning Industry
  • Pigments
  • Metal Finishing
  • Wood Preservation
  • Coatings & Ceramics
  • Aerospace Coatings
  • Anti-Corrosion Treatments
  • Refractory Materials

By Region:

  • North America
  • Europe
  • Asia Pacific

Table of Content

  1. Executive Summary
  2. Industry Introduction, including Taxonomy and Market Definition
  3. Chromium Salts Market Trends and Success Factors, including Macro-Economic Factors, Market Dynamics, and Recent Industry Developments
  4. Global Market Demand Analysis 2020 to 2024 and Forecast 2025 to 2035, including Historical Analysis and Future Projections
  5. Pricing Analysis
  6. Global Market Analysis 2020 to 2024 and Forecast 2025 to 2035
    • Type
    • Application
  7. Global Market Analysis 2020 to 2024 and Forecast 2025 to 2035, By Type
    • Chromium O Salts
    • Chromium I Salts
    • Chromium II Salts
    • Chromium III Salts
    • Chromium IV Salts
    • Others
    • Vacuums
  8. Global Market Analysis 2020 to 2024 and Forecast 2025 to 2035, By Application
    • Metallurgy
    • Dyes & Pigments
    • Wood Production
    • Preservatives
    • Tanning
    • Refractory Materials
  9. Global Market Analysis 2020 to 2024 and Forecast 2025 to 2035, By Region
    • North America
    • Latin America
    • Western Europe
    • Eastern Europe
    • East Asia
    • South Asia Pacific
    • Middle East and Africa
  10. North America Sales Analysis 2020 to 2024 and Forecast 2025 to 2035, by Key Segments and Countries
  11. Latin America Sales Analysis 2020 to 2024 and Forecast 2025 to 2035, by Key Segments and Countries
  12. Western Europe Sales Analysis 2020 to 2024 and Forecast 2025 to 2035, by Key Segments and Countries
  13. Eastern Europe Sales Analysis 2020 to 2024 and Forecast 2025 to 2035, by Key Segments and Countries
  14. East Asia Sales Analysis 2020 to 2024 and Forecast 2025 to 2035, by Key Segments and Countries
  15. South Asia Pacific Sales Analysis 2020 to 2024 and Forecast 2025 to 2035, by Key Segments and Countries
  16. Middle East and Africa Sales Analysis 2020 to 2024 and Forecast 2025 to 2035, by Key Segments and Countries
  17. Sales Forecast 2025 to 2035 by Type and Application for 30 Countries
  18. Competition Outlook, including Market Structure Analysis, Company Share Analysis by Key Players, and Competition Dashboard
  19. Company Profile
    • Vishnu Chemicals Limited
    • Aktyubinsk Chromium Chemicals Plant (ACCP)
    • American Elements
    • Hubei Zhenhua Chemical Co., Ltd.
    • Sun Chemical Corporation
    • CHEMALLIANCE LLC
    • Behn Meyer
    • Chemtura Corporation
    • Solutia Incorporated
    • Emerald Performance Materials

List of Tables

  • Table 1: Global Market Value (USD Million) Forecast by Region, 2020 to 2035
  • Table 2: Global Market Volume (Tons) Forecast by Region, 2020 to 2035
  • Table 3: Global Market Value (USD Million) Forecast by Type, 2020 to 2035
  • Table 4: Global Market Volume (Tons) Forecast by Type, 2020 to 2035
  • Table 5: Global Market Value (USD Million) Forecast by Application, 2020 to 2035
  • Table 6: Global Market Volume (Tons) Forecast by Application, 2020 to 2035
  • Table 7: North America Market Value (USD Million) Forecast by Country, 2020 to 2035
  • Table 8: North America Market Volume (Tons) Forecast by Country, 2020 to 2035
  • Table 9: North America Market Value (USD Million) Forecast by Type, 2020 to 2035
  • Table 10: North America Market Volume (Tons) Forecast by Type, 2020 to 2035
  • Table 11: North America Market Value (USD Million) Forecast by Application, 2020 to 2035
  • Table 12: North America Market Volume (Tons) Forecast by Application, 2020 to 2035
  • Table 13: Latin America Market Value (USD Million) Forecast by Country, 2020 to 2035
  • Table 14: Latin America Market Volume (Tons) Forecast by Country, 2020 to 2035
  • Table 15: Latin America Market Value (USD Million) Forecast by Type, 2020 to 2035
  • Table 16: Latin America Market Volume (Tons) Forecast by Type, 2020 to 2035
  • Table 17: Latin America Market Value (USD Million) Forecast by Application, 2020 to 2035
  • Table 18: Latin America Market Volume (Tons) Forecast by Application, 2020 to 2035
  • Table 19: Western Europe Market Value (USD Million) Forecast by Country, 2020 to 2035
  • Table 20: Western Europe Market Volume (Tons) Forecast by Country, 2020 to 2035
  • Table 21: Western Europe Market Value (USD Million) Forecast by Type, 2020 to 2035
  • Table 22: Western Europe Market Volume (Tons) Forecast by Type, 2020 to 2035
  • Table 23: Western Europe Market Value (USD Million) Forecast by Application, 2020 to 2035
  • Table 24: Western Europe Market Volume (Tons) Forecast by Application, 2020 to 2035
  • Table 25: Eastern Europe Market Value (USD Million) Forecast by Country, 2020 to 2035
  • Table 26: Eastern Europe Market Volume (Tons) Forecast by Country, 2020 to 2035
  • Table 27: Eastern Europe Market Value (USD Million) Forecast by Type, 2020 to 2035
  • Table 28: Eastern Europe Market Volume (Tons) Forecast by Type, 2020 to 2035
  • Table 29: Eastern Europe Market Value (USD Million) Forecast by Application, 2020 to 2035
  • Table 30: Eastern Europe Market Volume (Tons) Forecast by Application, 2020 to 2035
  • Table 31: South Asia and Pacific Market Value (USD Million) Forecast by Country, 2020 to 2035
  • Table 32: South Asia and Pacific Market Volume (Tons) Forecast by Country, 2020 to 2035
  • Table 33: South Asia and Pacific Market Value (USD Million) Forecast by Type, 2020 to 2035
  • Table 34: South Asia and Pacific Market Volume (Tons) Forecast by Type, 2020 to 2035
  • Table 35: South Asia and Pacific Market Value (USD Million) Forecast by Application, 2020 to 2035
  • Table 36: South Asia and Pacific Market Volume (Tons) Forecast by Application, 2020 to 2035
  • Table 37: East Asia Market Value (USD Million) Forecast by Country, 2020 to 2035
  • Table 38: East Asia Market Volume (Tons) Forecast by Country, 2020 to 2035
  • Table 39: East Asia Market Value (USD Million) Forecast by Type, 2020 to 2035
  • Table 40: East Asia Market Volume (Tons) Forecast by Type, 2020 to 2035
  • Table 41: East Asia Market Value (USD Million) Forecast by Application, 2020 to 2035
  • Table 42: East Asia Market Volume (Tons) Forecast by Application, 2020 to 2035
  • Table 43: Middle East and Africa Market Value (USD Million) Forecast by Country, 2020 to 2035
  • Table 44: Middle East and Africa Market Volume (Tons) Forecast by Country, 2020 to 2035
  • Table 45: Middle East and Africa Market Value (USD Million) Forecast by Type, 2020 to 2035
  • Table 46: Middle East and Africa Market Volume (Tons) Forecast by Type, 2020 to 2035
  • Table 47: Middle East and Africa Market Value (USD Million) Forecast by Application, 2020 to 2035
  • Table 48: Middle East and Africa Market Volume (Tons) Forecast by Application, 2020 to 2035

List of Figures

  • Figure 1: Global Market Value (USD Million) by Type, 2025 to 2035
  • Figure 2: Global Market Value (USD Million) by Application, 2025 to 2035
  • Figure 3: Global Market Value (USD Million) by Region, 2025 to 2035
  • Figure 4: Global Market Value (USD Million) Analysis by Region, 2020 to 2035
  • Figure 5: Global Market Volume (Tons) Analysis by Region, 2020 to 2035
  • Figure 6: Global Market Value Share (%) and BPS Analysis by Region, 2025 to 2035
  • Figure 7: Global Market Y-o-Y Growth (%) Projections by Region, 2025 to 2035
  • Figure 8: Global Market Value (USD Million) Analysis by Type, 2020 to 2035
  • Figure 9: Global Market Volume (Tons) Analysis by Type, 2020 to 2035
  • Figure 10: Global Market Value Share (%) and BPS Analysis by Type, 2025 to 2035
  • Figure 11: Global Market Y-o-Y Growth (%) Projections by Type, 2025 to 2035
  • Figure 12: Global Market Value (USD Million) Analysis by Application, 2020 to 2035
  • Figure 13: Global Market Volume (Tons) Analysis by Application, 2020 to 2035
  • Figure 14: Global Market Value Share (%) and BPS Analysis by Application, 2025 to 2035
  • Figure 15: Global Market Y-o-Y Growth (%) Projections by Application, 2025 to 2035
  • Figure 16: Global Market Attractiveness by Type, 2025 to 2035
  • Figure 17: Global Market Attractiveness by Application, 2025 to 2035
  • Figure 18: Global Market Attractiveness by Region, 2025 to 2035
  • Figure 19: North America Market Value (USD Million) by Type, 2025 to 2035
  • Figure 20: North America Market Value (USD Million) by Application, 2025 to 2035
  • Figure 21: North America Market Value (USD Million) by Country, 2025 to 2035
  • Figure 22: North America Market Value (USD Million) Analysis by Country, 2020 to 2035
  • Figure 23: North America Market Volume (Tons) Analysis by Country, 2020 to 2035
  • Figure 24: North America Market Value Share (%) and BPS Analysis by Country, 2025 to 2035
  • Figure 25: North America Market Y-o-Y Growth (%) Projections by Country, 2025 to 2035
  • Figure 26: North America Market Value (USD Million) Analysis by Type, 2020 to 2035
  • Figure 27: North America Market Volume (Tons) Analysis by Type, 2020 to 2035
  • Figure 28: North America Market Value Share (%) and BPS Analysis by Type, 2025 to 2035
  • Figure 29: North America Market Y-o-Y Growth (%) Projections by Type, 2025 to 2035
  • Figure 30: North America Market Value (USD Million) Analysis by Application, 2020 to 2035
  • Figure 31: North America Market Volume (Tons) Analysis by Application, 2020 to 2035
  • Figure 32: North America Market Value Share (%) and BPS Analysis by Application, 2025 to 2035
  • Figure 33: North America Market Y-o-Y Growth (%) Projections by Application, 2025 to 2035
  • Figure 34: North America Market Attractiveness by Type, 2025 to 2035
  • Figure 35: North America Market Attractiveness by Application, 2025 to 2035
  • Figure 36: North America Market Attractiveness by Country, 2025 to 2035
  • Figure 37: Latin America Market Value (USD Million) by Type, 2025 to 2035
  • Figure 38: Latin America Market Value (USD Million) by Application, 2025 to 2035
  • Figure 39: Latin America Market Value (USD Million) by Country, 2025 to 2035
  • Figure 40: Latin America Market Value (USD Million) Analysis by Country, 2020 to 2035
  • Figure 41: Latin America Market Volume (Tons) Analysis by Country, 2020 to 2035
  • Figure 42: Latin America Market Value Share (%) and BPS Analysis by Country, 2025 to 2035
  • Figure 43: Latin America Market Y-o-Y Growth (%) Projections by Country, 2025 to 2035
  • Figure 44: Latin America Market Value (USD Million) Analysis by Type, 2020 to 2035
  • Figure 45: Latin America Market Volume (Tons) Analysis by Type, 2020 to 2035
  • Figure 46: Latin America Market Value Share (%) and BPS Analysis by Type, 2025 to 2035
  • Figure 47: Latin America Market Y-o-Y Growth (%) Projections by Type, 2025 to 2035
  • Figure 48: Latin America Market Value (USD Million) Analysis by Application, 2020 to 2035
  • Figure 49: Latin America Market Volume (Tons) Analysis by Application, 2020 to 2035
  • Figure 50: Latin America Market Value Share (%) and BPS Analysis by Application, 2025 to 2035
  • Figure 51: Latin America Market Y-o-Y Growth (%) Projections by Application, 2025 to 2035
  • Figure 52: Latin America Market Attractiveness by Type, 2025 to 2035
  • Figure 53: Latin America Market Attractiveness by Application, 2025 to 2035
  • Figure 54: Latin America Market Attractiveness by Country, 2025 to 2035
  • Figure 55: Western Europe Market Value (USD Million) by Type, 2025 to 2035
  • Figure 56: Western Europe Market Value (USD Million) by Application, 2025 to 2035
  • Figure 57: Western Europe Market Value (USD Million) by Country, 2025 to 2035
  • Figure 58: Western Europe Market Value (USD Million) Analysis by Country, 2020 to 2035
  • Figure 59: Western Europe Market Volume (Tons) Analysis by Country, 2020 to 2035
  • Figure 60: Western Europe Market Value Share (%) and BPS Analysis by Country, 2025 to 2035
  • Figure 61: Western Europe Market Y-o-Y Growth (%) Projections by Country, 2025 to 2035
  • Figure 62: Western Europe Market Value (USD Million) Analysis by Type, 2020 to 2035
  • Figure 63: Western Europe Market Volume (Tons) Analysis by Type, 2020 to 2035
  • Figure 64: Western Europe Market Value Share (%) and BPS Analysis by Type, 2025 to 2035
  • Figure 65: Western Europe Market Y-o-Y Growth (%) Projections by Type, 2025 to 2035
  • Figure 66: Western Europe Market Value (USD Million) Analysis by Application, 2020 to 2035
  • Figure 67: Western Europe Market Volume (Tons) Analysis by Application, 2020 to 2035
  • Figure 68: Western Europe Market Value Share (%) and BPS Analysis by Application, 2025 to 2035
  • Figure 69: Western Europe Market Y-o-Y Growth (%) Projections by Application, 2025 to 2035
  • Figure 70: Western Europe Market Attractiveness by Type, 2025 to 2035
  • Figure 71: Western Europe Market Attractiveness by Application, 2025 to 2035
  • Figure 72: Western Europe Market Attractiveness by Country, 2025 to 2035
  • Figure 73: Eastern Europe Market Value (USD Million) by Type, 2025 to 2035
  • Figure 74: Eastern Europe Market Value (USD Million) by Application, 2025 to 2035
  • Figure 75: Eastern Europe Market Value (USD Million) by Country, 2025 to 2035
  • Figure 76: Eastern Europe Market Value (USD Million) Analysis by Country, 2020 to 2035
  • Figure 77: Eastern Europe Market Volume (Tons) Analysis by Country, 2020 to 2035
  • Figure 78: Eastern Europe Market Value Share (%) and BPS Analysis by Country, 2025 to 2035
  • Figure 79: Eastern Europe Market Y-o-Y Growth (%) Projections by Country, 2025 to 2035
  • Figure 80: Eastern Europe Market Value (USD Million) Analysis by Type, 2020 to 2035
  • Figure 81: Eastern Europe Market Volume (Tons) Analysis by Type, 2020 to 2035
  • Figure 82: Eastern Europe Market Value Share (%) and BPS Analysis by Type, 2025 to 2035
  • Figure 83: Eastern Europe Market Y-o-Y Growth (%) Projections by Type, 2025 to 2035
  • Figure 84: Eastern Europe Market Value (USD Million) Analysis by Application, 2020 to 2035
  • Figure 85: Eastern Europe Market Volume (Tons) Analysis by Application, 2020 to 2035
  • Figure 86: Eastern Europe Market Value Share (%) and BPS Analysis by Application, 2025 to 2035
  • Figure 87: Eastern Europe Market Y-o-Y Growth (%) Projections by Application, 2025 to 2035
  • Figure 88: Eastern Europe Market Attractiveness by Type, 2025 to 2035
  • Figure 89: Eastern Europe Market Attractiveness by Application, 2025 to 2035
  • Figure 90: Eastern Europe Market Attractiveness by Country, 2025 to 2035
  • Figure 91: South Asia and Pacific Market Value (USD Million) by Type, 2025 to 2035
  • Figure 92: South Asia and Pacific Market Value (USD Million) by Application, 2025 to 2035
  • Figure 93: South Asia and Pacific Market Value (USD Million) by Country, 2025 to 2035
  • Figure 94: South Asia and Pacific Market Value (USD Million) Analysis by Country, 2020 to 2035
  • Figure 95: South Asia and Pacific Market Volume (Tons) Analysis by Country, 2020 to 2035
  • Figure 96: South Asia and Pacific Market Value Share (%) and BPS Analysis by Country, 2025 to 2035
  • Figure 97: South Asia and Pacific Market Y-o-Y Growth (%) Projections by Country, 2025 to 2035
  • Figure 98: South Asia and Pacific Market Value (USD Million) Analysis by Type, 2020 to 2035
  • Figure 99: South Asia and Pacific Market Volume (Tons) Analysis by Type, 2020 to 2035
  • Figure 100: South Asia and Pacific Market Value Share (%) and BPS Analysis by Type, 2025 to 2035
  • Figure 101: South Asia and Pacific Market Y-o-Y Growth (%) Projections by Type, 2025 to 2035
  • Figure 102: South Asia and Pacific Market Value (USD Million) Analysis by Application, 2020 to 2035
  • Figure 103: South Asia and Pacific Market Volume (Tons) Analysis by Application, 2020 to 2035
  • Figure 104: South Asia and Pacific Market Value Share (%) and BPS Analysis by Application, 2025 to 2035
  • Figure 105: South Asia and Pacific Market Y-o-Y Growth (%) Projections by Application, 2025 to 2035
  • Figure 106: South Asia and Pacific Market Attractiveness by Type, 2025 to 2035
  • Figure 107: South Asia and Pacific Market Attractiveness by Application, 2025 to 2035
  • Figure 108: South Asia and Pacific Market Attractiveness by Country, 2025 to 2035
  • Figure 109: East Asia Market Value (USD Million) by Type, 2025 to 2035
  • Figure 110: East Asia Market Value (USD Million) by Application, 2025 to 2035
  • Figure 111: East Asia Market Value (USD Million) by Country, 2025 to 2035
  • Figure 112: East Asia Market Value (USD Million) Analysis by Country, 2020 to 2035
  • Figure 113: East Asia Market Volume (Tons) Analysis by Country, 2020 to 2035
  • Figure 114: East Asia Market Value Share (%) and BPS Analysis by Country, 2025 to 2035
  • Figure 115: East Asia Market Y-o-Y Growth (%) Projections by Country, 2025 to 2035
  • Figure 116: East Asia Market Value (USD Million) Analysis by Type, 2020 to 2035
  • Figure 117: East Asia Market Volume (Tons) Analysis by Type, 2020 to 2035
  • Figure 118: East Asia Market Value Share (%) and BPS Analysis by Type, 2025 to 2035
  • Figure 119: East Asia Market Y-o-Y Growth (%) Projections by Type, 2025 to 2035
  • Figure 120: East Asia Market Value (USD Million) Analysis by Application, 2020 to 2035
  • Figure 121: East Asia Market Volume (Tons) Analysis by Application, 2020 to 2035
  • Figure 122: East Asia Market Value Share (%) and BPS Analysis by Application, 2025 to 2035
  • Figure 123: East Asia Market Y-o-Y Growth (%) Projections by Application, 2025 to 2035
  • Figure 124: East Asia Market Attractiveness by Type, 2025 to 2035
  • Figure 125: East Asia Market Attractiveness by Application, 2025 to 2035
  • Figure 126: East Asia Market Attractiveness by Country, 2025 to 2035
  • Figure 127: Middle East and Africa Market Value (USD Million) by Type, 2025 to 2035
  • Figure 128: Middle East and Africa Market Value (USD Million) by Application, 2025 to 2035
  • Figure 129: Middle East and Africa Market Value (USD Million) by Country, 2025 to 2035
  • Figure 130: Middle East and Africa Market Value (USD Million) Analysis by Country, 2020 to 2035
  • Figure 131: Middle East and Africa Market Volume (Tons) Analysis by Country, 2020 to 2035
  • Figure 132: Middle East and Africa Market Value Share (%) and BPS Analysis by Country, 2025 to 2035
  • Figure 133: Middle East and Africa Market Y-o-Y Growth (%) Projections by Country, 2025 to 2035
  • Figure 134: Middle East and Africa Market Value (USD Million) Analysis by Type, 2020 to 2035
  • Figure 135: Middle East and Africa Market Volume (Tons) Analysis by Type, 2020 to 2035
  • Figure 136: Middle East and Africa Market Value Share (%) and BPS Analysis by Type, 2025 to 2035
  • Figure 137: Middle East and Africa Market Y-o-Y Growth (%) Projections by Type, 2025 to 2035
  • Figure 138: Middle East and Africa Market Value (USD Million) Analysis by Application, 2020 to 2035
  • Figure 139: Middle East and Africa Market Volume (Tons) Analysis by Application, 2020 to 2035
  • Figure 140: Middle East and Africa Market Value Share (%) and BPS Analysis by Application, 2025 to 2035
  • Figure 141: Middle East and Africa Market Y-o-Y Growth (%) Projections by Application, 2025 to 2035
  • Figure 142: Middle East and Africa Market Attractiveness by Type, 2025 to 2035
  • Figure 143: Middle East and Africa Market Attractiveness by Application, 2025 to 2035
  • Figure 144: Middle East and Africa Market Attractiveness by Country, 2025 to 2035

Frequently Asked Questions

What was the overall size of the Chromium Salts Market in 2025?

The overall market size for Chromium Salts Market was USD 5.0 Billion in 2025.

How big is the Chromium Salts Market expected in 2035?

The Chromium Salts Market is expected to reach USD 7.5 Billion in 2035.

What will drive the demand for Chromium Salts Market during the forecast period?

The increasing demand from various industries such as dyes and pigments, leather tanning, metallurgy, and catalysts fuels Chromium Salts Market during the forecast period.

List the top 5 countries contributing in Chromium Salts Market?

The top 5 countries which drives the development of Chromium Salts Market are USA, UK, Europe Union, Japan and South Korea.

Which segment in type is expected to lead in Chromium Salts Market?

Chromium III salts to command significant share over the assessment period.

Explore Similar Insights

Future Market Insights

Chromium Salts Market