Chromium Polynicotinate Market Size and Share Forecast Outlook 2025 to 2035

The Chromium Polynicotinate Market is estimated to be valued at USD 105.0 billion in 2025 and is projected to reach USD 171.0 billion by 2035, registering a compound annual growth rate (CAGR) of 5.0% over the forecast period.

Quick Stats for Chromium Polynicotinate Market

  • Chromium Polynicotinate Market Value (2025): USD 105.0 billion
  • Chromium Polynicotinate Market Forecast Value (2035): USD 171.0 billion
  • Chromium Polynicotinate Market Forecast CAGR: 5.0%
  • Leading Segment in Chromium Polynicotinate Market in 2025: Capsule (58.4%)
  • Key Growth Regions in Chromium Polynicotinate Market: North America, Asia-Pacific, Europe
  • Top Key Players in Chromium Polynicotinate Market: Biotech Pharmacal, Olympian Labs, Solgar, Natures Way, NOW Foods, Vital Nutrients, Puritans Pride, Solal, Superior Labs, Nutrafx

Chromium Polynicotinate Market Key Takeaways

Metric Value
Chromium Polynicotinate Market Estimated Value in (2025 E) USD 105.0 billion
Chromium Polynicotinate Market Forecast Value in (2035 F) USD 171.0 billion
Forecast CAGR (2025 to 2035) 5.0%

Why is the Chromium Polynicotinate Market Growing?

The Chromium Polynicotinate market is witnessing strong growth, driven by increasing awareness of nutritional supplementation and the demand for products that support glucose metabolism, weight management, and metabolic health. Rising incidences of lifestyle-related disorders such as diabetes and obesity are further fueling the adoption of chromium-based supplements. Advancements in formulation technologies, including bioavailable and stable nutrient complexes, have enhanced product efficacy, improving consumer confidence.

The market is also benefiting from increased online availability, direct-to-consumer sales channels, and growing interest in personalized nutrition solutions. Healthcare professionals and wellness programs are recommending chromium polynicotinate as part of dietary management, reinforcing adoption. Regulatory approvals and quality certifications in key regions are supporting market credibility.

North America, in particular, is witnessing significant growth due to high consumer health awareness, established distribution networks, and a preference for dietary supplementation With continued emphasis on preventive healthcare, lifestyle management, and nutritional interventions, the market is expected to sustain long-term expansion, driven by both evolving consumer behavior and product innovation.

Segmental Analysis

The chromium polynicotinate market is segmented by form, distribution channel, region, and geographic regions. By form, chromium polynicotinate market is divided into Capsule and Liquid. In terms of distribution channel, chromium polynicotinate market is classified into Online Stores, Medical Stores, Supermarkets/Hypermarkets, and Convenience Stores. Based on region, chromium polynicotinate market is segmented into North America, Europe, Asia-Pacific, Latin America, and Middle East & Africa. Regionally, the chromium polynicotinate industry is classified into North America, Latin America, Western Europe, Eastern Europe, Balkan & Baltic Countries, Russia & Belarus, Central Asia, East Asia, South Asia & Pacific, and the Middle East & Africa.
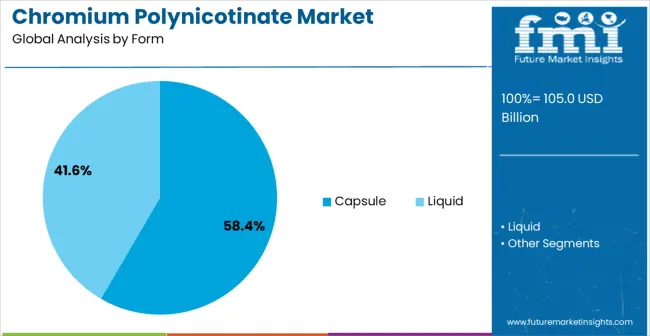
Insights into the Capsule Form Segment

Chromium Polynicotinate Market Analysis By Form

The capsule form segment is projected to hold 58.4% of the market revenue in 2025, establishing it as the leading product form. Its growth is being driven by consumer preference for convenience, ease of administration, and accurate dosing. Capsules provide enhanced stability and bioavailability for chromium polynicotinate, making them a preferred choice among health-conscious individuals and wellness program participants.

The form supports compliance with daily supplementation routines and is widely accepted across age groups and lifestyles. Manufacturers are focusing on capsule-based delivery due to its scalability, manufacturing efficiency, and ability to incorporate additional nutrients or herbal blends.

The combination of convenience, consistency, and efficacy has reinforced consumer trust and strengthened market adoption As dietary supplement awareness increases globally, capsule-based chromium polynicotinate is expected to maintain its dominant position, supported by growing retail availability and recommendations from healthcare professionals emphasizing its benefits for metabolic health.
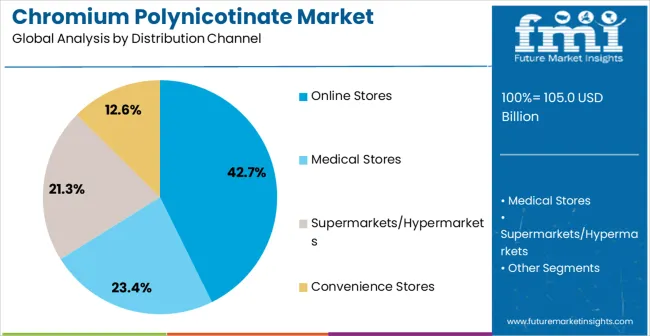
Insights into the Online Stores Distribution Channel Segment

Chromium Polynicotinate Market Analysis By Distribution Channel

The online stores distribution channel segment is anticipated to account for 42.7% of the market revenue in 2025, making it the leading distribution channel. Growth in this segment is being driven by the increasing preference for e-commerce as a convenient and accessible platform for dietary supplements. Online channels provide extensive product variety, detailed information, and the ability to compare brands, enhancing consumer purchasing decisions.

Subscription models and direct-to-consumer sales further encourage repeat purchases and brand loyalty. The COVID-19 pandemic accelerated the adoption of online shopping, and the trend continues due to digital literacy and smartphone penetration. E-commerce platforms enable manufacturers to reach geographically dispersed consumers and offer promotional campaigns efficiently.

The growing trust in online payment security, rapid delivery systems, and personalized shopping experiences are reinforcing this channel’s market share As consumers increasingly seek convenient and reliable sources for dietary supplements, online stores are expected to remain a primary growth driver for chromium polynicotinate distribution.
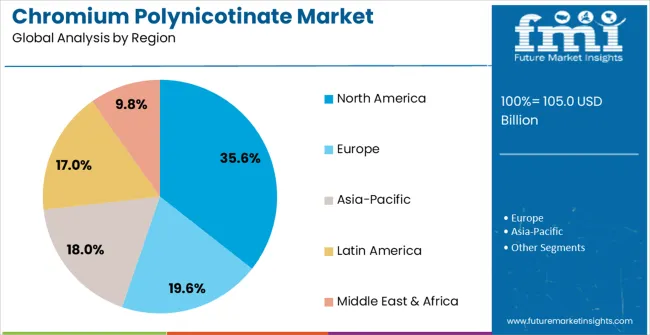
Insights into the North America Region Segment

Chromium Polynicotinate Market Analysis By Region

The North America region is expected to hold 35.6% of the market revenue in 2025, positioning it as the leading regional market. Growth is being driven by high consumer health awareness, established dietary supplement culture, and widespread adoption of preventive healthcare practices. The presence of well-developed retail and e-commerce infrastructure ensures easy availability of chromium polynicotinate products.

Consumers in the region are increasingly focused on managing blood glucose, supporting metabolic health, and incorporating supplements into daily routines. Regulatory frameworks, quality certifications, and clinical endorsements contribute to market credibility and build consumer trust. Additionally, health-conscious millennials and aging populations are significant contributors to demand.

Rising interest in personalized nutrition, fitness programs, and functional wellness products is further supporting regional growth With continuous investment in health education and preventive healthcare initiatives, North America is expected to remain a key market for chromium polynicotinate, driving adoption and innovation across the region.

Market Overview

Chromium Polynicotinate Market Overview

Chromium is a metal which was first discovered in the late 1790s in France, until 1958 it was not considered as an essential trace element but was considered in the 1960s. Chromium polynicotinate is a supplement made up of chromium and niacin. It is believed that niacin helps in the absorption of chromium. Chromium polynicotinate doesn’t contain much niacin as excess of niacin can cause side effects.

Chromium polynicotinate is taken by people those who want to lose body weight, increasing muscle, and decreasing fat content of the body. Chromium polynicotinate is also used by athlete to improve their performance and to increase energy. Several research studies has shown that chromium polynicotinate is useful in treating depression. It is suggested that chromium polynicotinate should not be consumed by patient suffering from liver or kidney disorder as it may cause some sort of allergic reaction to them.
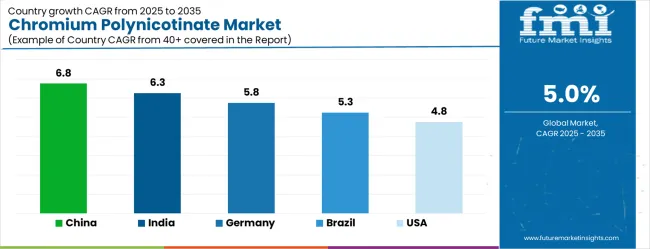
Analysis of Chromium Polynicotinate Market By Key Countries

Chromium Polynicotinate Market Cagr Analysis By Country

Country CAGR
China 6.8%
India 6.3%
Germany 5.8%
Brazil 5.3%
USA 4.8%
UK 4.3%
Japan 3.8%

Country-wise Analysis

The Chromium Polynicotinate Market is expected to register a CAGR of 5.0% during the forecast period, exhibiting varied country level momentum. China leads with the highest CAGR of 6.8%, followed by India at 6.3%. Developed markets such as Germany, France, and the UK continue to expand steadily, while the USA is likely to grow at consistent rates. Japan posts the lowest CAGR at 3.8%, yet still underscores a broadly positive trajectory for the global Chromium Polynicotinate Market. In 2024, Germany held a dominant revenue in the Western Europe market and is expected to grow with a CAGR of 5.8%. The USA Chromium Polynicotinate Market is estimated to be valued at USD 38.8 billion in 2025 and is anticipated to reach a valuation of USD 38.8 billion by 2035. Sales are projected to rise at a CAGR of 0.0% over the forecast period between 2025 and 2035. While Japan and South Korea markets are estimated to be valued at USD 4.7 billion and USD 3.6 billion respectively in 2025.
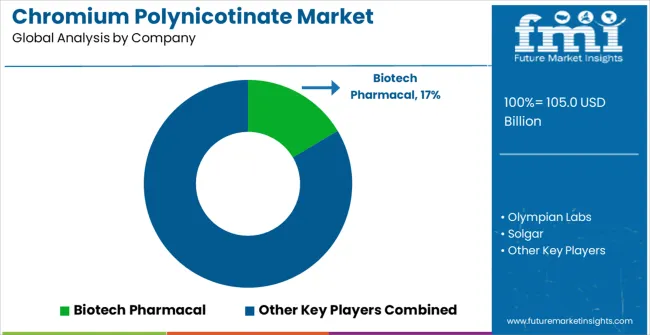
Key Players in the Chromium Polynicotinate Market

Chromium Polynicotinate Market Analysis By Company

  • Biotech Pharmacal
  • Olympian Labs
  • Solgar
  • Natures Way
  • NOW Foods
  • Vital Nutrients
  • Puritans Pride
  • Solal
  • Superior Labs
  • Nutrafx

Scope of the Report

Item Value
Quantitative Units USD 105.0 Billion
Form Capsule and Liquid
Distribution Channel Online Stores, Medical Stores, Supermarkets/Hypermarkets, and Convenience Stores
Region North America, Europe, Asia-Pacific, Latin America, and Middle East & Africa
Regions Covered North America, Europe, Asia-Pacific, Latin America, Middle East & Africa
Country Covered United States, Canada, Germany, France, United Kingdom, China, Japan, India, Brazil, South Africa
Key Companies Profiled Biotech Pharmacal, Olympian Labs, Solgar, Natures Way, NOW Foods, Vital Nutrients, Puritans Pride, Solal, Superior Labs, and Nutrafx

Chromium Polynicotinate Market by Segments

Form:

  • Capsule
  • Liquid

Distribution Channel:

  • Online Stores
  • Medical Stores
  • Supermarkets/Hypermarkets
  • Convenience Stores

Region:

  • North America
  • Europe
  • Asia-Pacific
  • Latin America
  • Middle East & Africa

Region:

  • North America
    • USA
    • Canada
    • Mexico
  • Latin America
    • Brazil
    • Chile
    • Rest of Latin America
  • Western Europe
    • Germany
    • UK
    • Italy
    • Spain
    • France
    • Nordic
    • BENELUX
    • Rest of Western Europe
  • Eastern Europe
    • Russia
    • Poland
    • Hungary
    • Balkan & Baltic
    • Rest of Eastern Europe
  • East Asia
    • China
    • Japan
    • South Korea
  • South Asia and Pacific
    • India
    • ASEAN
    • Australia & New Zealand
    • Rest of South Asia and Pacific
  • Middle East & Africa
    • Kingdom of Saudi Arabia
    • Other GCC Countries
    • Turkiye
    • South Africa
    • Other African Union
    • Rest of Middle East & Africa

Table of Content

  1. Executive Summary
    • Global Market Outlook
    • Demand-side Trends
    • Supply-side Trends
    • Technology Roadmap Analysis
    • Analysis and Recommendations
  2. Market Overview
    • Market Coverage / Taxonomy
    • Market Definition / Scope / Limitations
  3. Market Background
    • Market Dynamics
      • Drivers
      • Restraints
      • Opportunity
      • Trends
    • Scenario Forecast
      • Demand in Optimistic Scenario
      • Demand in Likely Scenario
      • Demand in Conservative Scenario
    • Opportunity Map Analysis
    • Product Life Cycle Analysis
    • Supply Chain Analysis
    • Investment Feasibility Matrix
    • Value Chain Analysis
    • PESTLE and Porter’s Analysis
    • Regulatory Landscape
    • Regional Parent Market Outlook
    • Production and Consumption Statistics
    • Import and Export Statistics
  4. Global Market Analysis 2020 to 2024 and Forecast, 2025 to 2035
    • Historical Market Size Value (USD Million) Analysis, 2020 to 2024
    • Current and Future Market Size Value (USD Million) Projections, 2025 to 2035
      • Y-o-Y Growth Trend Analysis
      • Absolute $ Opportunity Analysis
  5. Global Market Pricing Analysis 2020 to 2024 and Forecast 2025 to 2035
  6. Global Market Analysis 2020 to 2024 and Forecast 2025 to 2035, By Form
    • Introduction / Key Findings
    • Historical Market Size Value (USD Million) Analysis By Form , 2020 to 2024
    • Current and Future Market Size Value (USD Million) Analysis and Forecast By Form , 2025 to 2035
      • Capsule
      • Liquid
    • Y-o-Y Growth Trend Analysis By Form , 2020 to 2024
    • Absolute $ Opportunity Analysis By Form , 2025 to 2035
  7. Global Market Analysis 2020 to 2024 and Forecast 2025 to 2035, By Distribution Channel
    • Introduction / Key Findings
    • Historical Market Size Value (USD Million) Analysis By Distribution Channel, 2020 to 2024
    • Current and Future Market Size Value (USD Million) Analysis and Forecast By Distribution Channel, 2025 to 2035
      • Online Stores
      • Medical Stores
      • Supermarkets/Hypermarkets
      • Convenience Stores
    • Y-o-Y Growth Trend Analysis By Distribution Channel, 2020 to 2024
    • Absolute $ Opportunity Analysis By Distribution Channel, 2025 to 2035
  8. Global Market Analysis 2020 to 2024 and Forecast 2025 to 2035, By Region
    • Introduction / Key Findings
    • Historical Market Size Value (USD Million) Analysis By Region, 2020 to 2024
    • Current and Future Market Size Value (USD Million) Analysis and Forecast By Region, 2025 to 2035
      • North America
      • Europe
      • Asia-Pacific
      • Latin America
      • Middle East & Africa
    • Y-o-Y Growth Trend Analysis By Region, 2020 to 2024
    • Absolute $ Opportunity Analysis By Region, 2025 to 2035
  9. Global Market Analysis 2020 to 2024 and Forecast 2025 to 2035, By Region
    • Introduction
    • Historical Market Size Value (USD Million) Analysis By Region, 2020 to 2024
    • Current Market Size Value (USD Million) Analysis and Forecast By Region, 2025 to 2035
      • North America
      • Latin America
      • Western Europe
      • Eastern Europe
      • East Asia
      • South Asia and Pacific
      • Middle East & Africa
    • Market Attractiveness Analysis By Region
  10. North America Market Analysis 2020 to 2024 and Forecast 2025 to 2035, By Country
    • Historical Market Size Value (USD Million) Trend Analysis By Market Taxonomy, 2020 to 2024
    • Market Size Value (USD Million) Forecast By Market Taxonomy, 2025 to 2035
      • By Country
        • USA
        • Canada
        • Mexico
      • By Form
      • By Distribution Channel
      • By Region
    • Market Attractiveness Analysis
      • By Country
      • By Form
      • By Distribution Channel
      • By Region
    • Key Takeaways
  11. Latin America Market Analysis 2020 to 2024 and Forecast 2025 to 2035, By Country
    • Historical Market Size Value (USD Million) Trend Analysis By Market Taxonomy, 2020 to 2024
    • Market Size Value (USD Million) Forecast By Market Taxonomy, 2025 to 2035
      • By Country
        • Brazil
        • Chile
        • Rest of Latin America
      • By Form
      • By Distribution Channel
      • By Region
    • Market Attractiveness Analysis
      • By Country
      • By Form
      • By Distribution Channel
      • By Region
    • Key Takeaways
  12. Western Europe Market Analysis 2020 to 2024 and Forecast 2025 to 2035, By Country
    • Historical Market Size Value (USD Million) Trend Analysis By Market Taxonomy, 2020 to 2024
    • Market Size Value (USD Million) Forecast By Market Taxonomy, 2025 to 2035
      • By Country
        • Germany
        • UK
        • Italy
        • Spain
        • France
        • Nordic
        • BENELUX
        • Rest of Western Europe
      • By Form
      • By Distribution Channel
      • By Region
    • Market Attractiveness Analysis
      • By Country
      • By Form
      • By Distribution Channel
      • By Region
    • Key Takeaways
  13. Eastern Europe Market Analysis 2020 to 2024 and Forecast 2025 to 2035, By Country
    • Historical Market Size Value (USD Million) Trend Analysis By Market Taxonomy, 2020 to 2024
    • Market Size Value (USD Million) Forecast By Market Taxonomy, 2025 to 2035
      • By Country
        • Russia
        • Poland
        • Hungary
        • Balkan & Baltic
        • Rest of Eastern Europe
      • By Form
      • By Distribution Channel
      • By Region
    • Market Attractiveness Analysis
      • By Country
      • By Form
      • By Distribution Channel
      • By Region
    • Key Takeaways
  14. East Asia Market Analysis 2020 to 2024 and Forecast 2025 to 2035, By Country
    • Historical Market Size Value (USD Million) Trend Analysis By Market Taxonomy, 2020 to 2024
    • Market Size Value (USD Million) Forecast By Market Taxonomy, 2025 to 2035
      • By Country
        • China
        • Japan
        • South Korea
      • By Form
      • By Distribution Channel
      • By Region
    • Market Attractiveness Analysis
      • By Country
      • By Form
      • By Distribution Channel
      • By Region
    • Key Takeaways
  15. South Asia and Pacific Market Analysis 2020 to 2024 and Forecast 2025 to 2035, By Country
    • Historical Market Size Value (USD Million) Trend Analysis By Market Taxonomy, 2020 to 2024
    • Market Size Value (USD Million) Forecast By Market Taxonomy, 2025 to 2035
      • By Country
        • India
        • ASEAN
        • Australia & New Zealand
        • Rest of South Asia and Pacific
      • By Form
      • By Distribution Channel
      • By Region
    • Market Attractiveness Analysis
      • By Country
      • By Form
      • By Distribution Channel
      • By Region
    • Key Takeaways
  16. Middle East & Africa Market Analysis 2020 to 2024 and Forecast 2025 to 2035, By Country
    • Historical Market Size Value (USD Million) Trend Analysis By Market Taxonomy, 2020 to 2024
    • Market Size Value (USD Million) Forecast By Market Taxonomy, 2025 to 2035
      • By Country
        • Kingdom of Saudi Arabia
        • Other GCC Countries
        • Turkiye
        • South Africa
        • Other African Union
        • Rest of Middle East & Africa
      • By Form
      • By Distribution Channel
      • By Region
    • Market Attractiveness Analysis
      • By Country
      • By Form
      • By Distribution Channel
      • By Region
    • Key Takeaways
  17. Key Countries Market Analysis
    • USA
      • Pricing Analysis
      • Market Share Analysis, 2024
        • By Form
        • By Distribution Channel
        • By Region
    • Canada
      • Pricing Analysis
      • Market Share Analysis, 2024
        • By Form
        • By Distribution Channel
        • By Region
    • Mexico
      • Pricing Analysis
      • Market Share Analysis, 2024
        • By Form
        • By Distribution Channel
        • By Region
    • Brazil
      • Pricing Analysis
      • Market Share Analysis, 2024
        • By Form
        • By Distribution Channel
        • By Region
    • Chile
      • Pricing Analysis
      • Market Share Analysis, 2024
        • By Form
        • By Distribution Channel
        • By Region
    • Germany
      • Pricing Analysis
      • Market Share Analysis, 2024
        • By Form
        • By Distribution Channel
        • By Region
    • UK
      • Pricing Analysis
      • Market Share Analysis, 2024
        • By Form
        • By Distribution Channel
        • By Region
    • Italy
      • Pricing Analysis
      • Market Share Analysis, 2024
        • By Form
        • By Distribution Channel
        • By Region
    • Spain
      • Pricing Analysis
      • Market Share Analysis, 2024
        • By Form
        • By Distribution Channel
        • By Region
    • France
      • Pricing Analysis
      • Market Share Analysis, 2024
        • By Form
        • By Distribution Channel
        • By Region
    • India
      • Pricing Analysis
      • Market Share Analysis, 2024
        • By Form
        • By Distribution Channel
        • By Region
    • ASEAN
      • Pricing Analysis
      • Market Share Analysis, 2024
        • By Form
        • By Distribution Channel
        • By Region
    • Australia & New Zealand
      • Pricing Analysis
      • Market Share Analysis, 2024
        • By Form
        • By Distribution Channel
        • By Region
    • China
      • Pricing Analysis
      • Market Share Analysis, 2024
        • By Form
        • By Distribution Channel
        • By Region
    • Japan
      • Pricing Analysis
      • Market Share Analysis, 2024
        • By Form
        • By Distribution Channel
        • By Region
    • South Korea
      • Pricing Analysis
      • Market Share Analysis, 2024
        • By Form
        • By Distribution Channel
        • By Region
    • Russia
      • Pricing Analysis
      • Market Share Analysis, 2024
        • By Form
        • By Distribution Channel
        • By Region
    • Poland
      • Pricing Analysis
      • Market Share Analysis, 2024
        • By Form
        • By Distribution Channel
        • By Region
    • Hungary
      • Pricing Analysis
      • Market Share Analysis, 2024
        • By Form
        • By Distribution Channel
        • By Region
    • Kingdom of Saudi Arabia
      • Pricing Analysis
      • Market Share Analysis, 2024
        • By Form
        • By Distribution Channel
        • By Region
    • Turkiye
      • Pricing Analysis
      • Market Share Analysis, 2024
        • By Form
        • By Distribution Channel
        • By Region
    • South Africa
      • Pricing Analysis
      • Market Share Analysis, 2024
        • By Form
        • By Distribution Channel
        • By Region
  18. Market Structure Analysis
    • Competition Dashboard
    • Competition Benchmarking
    • Market Share Analysis of Top Players
      • By Regional
      • By Form
      • By Distribution Channel
      • By Region
  19. Competition Analysis
    • Competition Deep Dive
      • Biotech Pharmacal
        • Overview
        • Product Portfolio
        • Profitability by Market Segments (Product/Age /Sales Channel/Region)
        • Sales Footprint
        • Strategy Overview
          • Marketing Strategy
          • Product Strategy
          • Channel Strategy
      • Olympian Labs
      • Solgar
      • Natures Way
      • NOW Foods
      • Vital Nutrients
      • Puritans Pride
      • Solal
      • Superior Labs
      • Nutrafx
  20. Assumptions & Acronyms Used
  21. Research Methodology

List of Tables

  • Table 1: Global Market Value (USD Million) Forecast by Region, 2020-2035
  • Table 2: Global Market Value (USD Million) Forecast by Form , 2020-2035
  • Table 3: Global Market Value (USD Million) Forecast by Distribution Channel, 2020-2035
  • Table 4: Global Market Value (USD Million) Forecast by Region, 2020-2035
  • Table 5: North America Market Value (USD Million) Forecast by Country, 2020-2035
  • Table 6: North America Market Value (USD Million) Forecast by Form , 2020-2035
  • Table 7: North America Market Value (USD Million) Forecast by Distribution Channel, 2020-2035
  • Table 8: North America Market Value (USD Million) Forecast by Region, 2020-2035
  • Table 9: Latin America Market Value (USD Million) Forecast by Country, 2020-2035
  • Table 10: Latin America Market Value (USD Million) Forecast by Form , 2020-2035
  • Table 11: Latin America Market Value (USD Million) Forecast by Distribution Channel, 2020-2035
  • Table 12: Latin America Market Value (USD Million) Forecast by Region, 2020-2035
  • Table 13: Western Europe Market Value (USD Million) Forecast by Country, 2020-2035
  • Table 14: Western Europe Market Value (USD Million) Forecast by Form , 2020-2035
  • Table 15: Western Europe Market Value (USD Million) Forecast by Distribution Channel, 2020-2035
  • Table 16: Western Europe Market Value (USD Million) Forecast by Region, 2020-2035
  • Table 17: Eastern Europe Market Value (USD Million) Forecast by Country, 2020-2035
  • Table 18: Eastern Europe Market Value (USD Million) Forecast by Form , 2020-2035
  • Table 19: Eastern Europe Market Value (USD Million) Forecast by Distribution Channel, 2020-2035
  • Table 20: Eastern Europe Market Value (USD Million) Forecast by Region, 2020-2035
  • Table 21: East Asia Market Value (USD Million) Forecast by Country, 2020-2035
  • Table 22: East Asia Market Value (USD Million) Forecast by Form , 2020-2035
  • Table 23: East Asia Market Value (USD Million) Forecast by Distribution Channel, 2020-2035
  • Table 24: East Asia Market Value (USD Million) Forecast by Region, 2020-2035
  • Table 25: South Asia and Pacific Market Value (USD Million) Forecast by Country, 2020-2035
  • Table 26: South Asia and Pacific Market Value (USD Million) Forecast by Form , 2020-2035
  • Table 27: South Asia and Pacific Market Value (USD Million) Forecast by Distribution Channel, 2020-2035
  • Table 28: South Asia and Pacific Market Value (USD Million) Forecast by Region, 2020-2035
  • Table 29: Middle East & Africa Market Value (USD Million) Forecast by Country, 2020-2035
  • Table 30: Middle East & Africa Market Value (USD Million) Forecast by Form , 2020-2035
  • Table 31: Middle East & Africa Market Value (USD Million) Forecast by Distribution Channel, 2020-2035
  • Table 32: Middle East & Africa Market Value (USD Million) Forecast by Region, 2020-2035

List of Figures

  • Figure 1: Global Market Pricing Analysis
  • Figure 2: Global Market Value (USD Million) Forecast 2020-2035
  • Figure 3: Global Market Value Share and BPS Analysis by Form , 2025 and 2035
  • Figure 4: Global Market Y-o-Y Growth Comparison by Form , 2025-2035
  • Figure 5: Global Market Attractiveness Analysis by Form
  • Figure 6: Global Market Value Share and BPS Analysis by Distribution Channel, 2025 and 2035
  • Figure 7: Global Market Y-o-Y Growth Comparison by Distribution Channel, 2025-2035
  • Figure 8: Global Market Attractiveness Analysis by Distribution Channel
  • Figure 9: Global Market Value Share and BPS Analysis by Region, 2025 and 2035
  • Figure 10: Global Market Y-o-Y Growth Comparison by Region, 2025-2035
  • Figure 11: Global Market Attractiveness Analysis by Region
  • Figure 12: Global Market Value (USD Million) Share and BPS Analysis by Region, 2025 and 2035
  • Figure 13: Global Market Y-o-Y Growth Comparison by Region, 2025-2035
  • Figure 14: Global Market Attractiveness Analysis by Region
  • Figure 15: North America Market Incremental Dollar Opportunity, 2025-2035
  • Figure 16: Latin America Market Incremental Dollar Opportunity, 2025-2035
  • Figure 17: Western Europe Market Incremental Dollar Opportunity, 2025-2035
  • Figure 18: Eastern Europe Market Incremental Dollar Opportunity, 2025-2035
  • Figure 19: East Asia Market Incremental Dollar Opportunity, 2025-2035
  • Figure 20: South Asia and Pacific Market Incremental Dollar Opportunity, 2025-2035
  • Figure 21: Middle East & Africa Market Incremental Dollar Opportunity, 2025-2035
  • Figure 22: North America Market Value Share and BPS Analysis by Country, 2025 and 2035
  • Figure 23: North America Market Value Share and BPS Analysis by Form , 2025 and 2035
  • Figure 24: North America Market Y-o-Y Growth Comparison by Form , 2025-2035
  • Figure 25: North America Market Attractiveness Analysis by Form
  • Figure 26: North America Market Value Share and BPS Analysis by Distribution Channel, 2025 and 2035
  • Figure 27: North America Market Y-o-Y Growth Comparison by Distribution Channel, 2025-2035
  • Figure 28: North America Market Attractiveness Analysis by Distribution Channel
  • Figure 29: North America Market Value Share and BPS Analysis by Region, 2025 and 2035
  • Figure 30: North America Market Y-o-Y Growth Comparison by Region, 2025-2035
  • Figure 31: North America Market Attractiveness Analysis by Region
  • Figure 32: Latin America Market Value Share and BPS Analysis by Country, 2025 and 2035
  • Figure 33: Latin America Market Value Share and BPS Analysis by Form , 2025 and 2035
  • Figure 34: Latin America Market Y-o-Y Growth Comparison by Form , 2025-2035
  • Figure 35: Latin America Market Attractiveness Analysis by Form
  • Figure 36: Latin America Market Value Share and BPS Analysis by Distribution Channel, 2025 and 2035
  • Figure 37: Latin America Market Y-o-Y Growth Comparison by Distribution Channel, 2025-2035
  • Figure 38: Latin America Market Attractiveness Analysis by Distribution Channel
  • Figure 39: Latin America Market Value Share and BPS Analysis by Region, 2025 and 2035
  • Figure 40: Latin America Market Y-o-Y Growth Comparison by Region, 2025-2035
  • Figure 41: Latin America Market Attractiveness Analysis by Region
  • Figure 42: Western Europe Market Value Share and BPS Analysis by Country, 2025 and 2035
  • Figure 43: Western Europe Market Value Share and BPS Analysis by Form , 2025 and 2035
  • Figure 44: Western Europe Market Y-o-Y Growth Comparison by Form , 2025-2035
  • Figure 45: Western Europe Market Attractiveness Analysis by Form
  • Figure 46: Western Europe Market Value Share and BPS Analysis by Distribution Channel, 2025 and 2035
  • Figure 47: Western Europe Market Y-o-Y Growth Comparison by Distribution Channel, 2025-2035
  • Figure 48: Western Europe Market Attractiveness Analysis by Distribution Channel
  • Figure 49: Western Europe Market Value Share and BPS Analysis by Region, 2025 and 2035
  • Figure 50: Western Europe Market Y-o-Y Growth Comparison by Region, 2025-2035
  • Figure 51: Western Europe Market Attractiveness Analysis by Region
  • Figure 52: Eastern Europe Market Value Share and BPS Analysis by Country, 2025 and 2035
  • Figure 53: Eastern Europe Market Value Share and BPS Analysis by Form , 2025 and 2035
  • Figure 54: Eastern Europe Market Y-o-Y Growth Comparison by Form , 2025-2035
  • Figure 55: Eastern Europe Market Attractiveness Analysis by Form
  • Figure 56: Eastern Europe Market Value Share and BPS Analysis by Distribution Channel, 2025 and 2035
  • Figure 57: Eastern Europe Market Y-o-Y Growth Comparison by Distribution Channel, 2025-2035
  • Figure 58: Eastern Europe Market Attractiveness Analysis by Distribution Channel
  • Figure 59: Eastern Europe Market Value Share and BPS Analysis by Region, 2025 and 2035
  • Figure 60: Eastern Europe Market Y-o-Y Growth Comparison by Region, 2025-2035
  • Figure 61: Eastern Europe Market Attractiveness Analysis by Region
  • Figure 62: East Asia Market Value Share and BPS Analysis by Country, 2025 and 2035
  • Figure 63: East Asia Market Value Share and BPS Analysis by Form , 2025 and 2035
  • Figure 64: East Asia Market Y-o-Y Growth Comparison by Form , 2025-2035
  • Figure 65: East Asia Market Attractiveness Analysis by Form
  • Figure 66: East Asia Market Value Share and BPS Analysis by Distribution Channel, 2025 and 2035
  • Figure 67: East Asia Market Y-o-Y Growth Comparison by Distribution Channel, 2025-2035
  • Figure 68: East Asia Market Attractiveness Analysis by Distribution Channel
  • Figure 69: East Asia Market Value Share and BPS Analysis by Region, 2025 and 2035
  • Figure 70: East Asia Market Y-o-Y Growth Comparison by Region, 2025-2035
  • Figure 71: East Asia Market Attractiveness Analysis by Region
  • Figure 72: South Asia and Pacific Market Value Share and BPS Analysis by Country, 2025 and 2035
  • Figure 73: South Asia and Pacific Market Value Share and BPS Analysis by Form , 2025 and 2035
  • Figure 74: South Asia and Pacific Market Y-o-Y Growth Comparison by Form , 2025-2035
  • Figure 75: South Asia and Pacific Market Attractiveness Analysis by Form
  • Figure 76: South Asia and Pacific Market Value Share and BPS Analysis by Distribution Channel, 2025 and 2035
  • Figure 77: South Asia and Pacific Market Y-o-Y Growth Comparison by Distribution Channel, 2025-2035
  • Figure 78: South Asia and Pacific Market Attractiveness Analysis by Distribution Channel
  • Figure 79: South Asia and Pacific Market Value Share and BPS Analysis by Region, 2025 and 2035
  • Figure 80: South Asia and Pacific Market Y-o-Y Growth Comparison by Region, 2025-2035
  • Figure 81: South Asia and Pacific Market Attractiveness Analysis by Region
  • Figure 82: Middle East & Africa Market Value Share and BPS Analysis by Country, 2025 and 2035
  • Figure 83: Middle East & Africa Market Value Share and BPS Analysis by Form , 2025 and 2035
  • Figure 84: Middle East & Africa Market Y-o-Y Growth Comparison by Form , 2025-2035
  • Figure 85: Middle East & Africa Market Attractiveness Analysis by Form
  • Figure 86: Middle East & Africa Market Value Share and BPS Analysis by Distribution Channel, 2025 and 2035
  • Figure 87: Middle East & Africa Market Y-o-Y Growth Comparison by Distribution Channel, 2025-2035
  • Figure 88: Middle East & Africa Market Attractiveness Analysis by Distribution Channel
  • Figure 89: Middle East & Africa Market Value Share and BPS Analysis by Region, 2025 and 2035
  • Figure 90: Middle East & Africa Market Y-o-Y Growth Comparison by Region, 2025-2035
  • Figure 91: Middle East & Africa Market Attractiveness Analysis by Region
  • Figure 92: Global Market - Tier Structure Analysis
  • Figure 93: Global Market - Company Share Analysis

Frequently Asked Questions

How big is the chromium polynicotinate market in 2025?

The global chromium polynicotinate market is estimated to be valued at USD 105.0 billion in 2025.

What will be the size of chromium polynicotinate market in 2035?

The market size for the chromium polynicotinate market is projected to reach USD 171.0 billion by 2035.

How much will be the chromium polynicotinate market growth between 2025 and 2035?

The chromium polynicotinate market is expected to grow at a 5.0% CAGR between 2025 and 2035.

What are the key product types in the chromium polynicotinate market?

The key product types in chromium polynicotinate market are capsule and liquid.

Which distribution channel segment to contribute significant share in the chromium polynicotinate market in 2025?

In terms of distribution channel, online stores segment to command 42.7% share in the chromium polynicotinate market in 2025.

Explore Similar Insights

Future Market Insights

Chromium Polynicotinate Market

Chat With MaRIA

Chat With

MaRIA

Hi There, I am MaRIA, Your Market Research Intelligence Assistant. How may I help you?