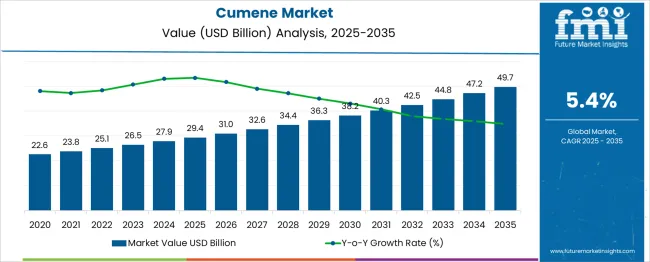
The Cumene Market is anticipated to register a CAGR of 5.4% during the period of 2022 to 2032. The cumene market is anticipated to reach USD 42.7 Billion in 2032, from USD 25.1 Billion in 2022. The market was valued at USD 23.5 Billion in 2021, and is expected to grow with a Y-O-Y growth rate of 6.8%.
Product innovations, such as the development of food-grade cumene for polycarbonate plastic-based containers and bottles are expected to extend profitable opportunities to the market players during the forecast period.
Attributes | Details |
---|---|
Cumene Market CAGR (2022 to 2032) | 5.4% |
Cumene Market (2022) | USD 25.1 Billion |
Cumene Market (2032) | USD 42.7 Billion |
Major factors that are expected to boost the growth of the cumene market in the forecast period are the rise in the demand for phenolic resins and bisphenol-A, and the increase in the consumption of acetone and its derivatives.
Increased Utilization of Cumenes across Various Industries spurring Demand
The growing utilization of the cumenes for various applications is estimated to boost the market growth over forecast period. Major factors that are expected to boost the growth of the cumene market in the forecast period are the rise in the demand for phenolic resins and bisphenol-A, and the increase in the consumption of acetone and its derivatives.
Furthermore, the rise in the usage of cumene in adhesives and sealant chemicals and the upsurge in the preference for the consumers towards high octane production are further propelling the growth of the cumene market.
The factors such as increased industrialization and rising consumer demand for high-octane cumene derivatives, are expected to further propel the growth rate of cumene market. In addition, the expansion of the end use industries which are projected to bolster the growth of the market over the analysis period.
Product Innovations and Developments paving way for New Launches
The product innovations, such as the development of food-grade cumene for polycarbonate plastic-based containers and bottles are expected to extend profitable opportunities to the market players during the forecast period.
Moreover, the rise in the development for chemical manufacturing will further expand the future growth of the cumene market.
Negative Impact on Health
Humans may experience headaches, dizziness, drowsiness, minor incoordination, and unconsciousness as a result of acute (short-term) inhalation exposure to cumene. Cumene has a depressive effect on the central nervous system (CNS).
Cumene vapors may cause mild discomfort and redness in the eyes. Prolonged or repeated skin contact may cause slight irritation, with local redness, and drying or flaking of the skin. Excessive inhalation of cumene vapors may cause irritation of the nose, throat and upper respiratory tract.
If ingested or swallowed in small amounts, cumene has a low order of toxicity, meaning that health effects will likely be minimal or mild. When swallowed in larger amounts, cumene may cause gastrointestinal irritation, and may be aspirated during vomiting.
These dangerous side effects on the human health will prove to be a demerit for the cumene market. Therefore, this factor will challenge the cumene market growth rate.
High Material Cost
An increase in the material cost is expected to put a mild restraint over the growth of the market in the next five years although, and is further responsible for the downfall of the cumene market during the forecast period.
Increasing Demand from Phenol Segment
One of the major applications of cumene is in the production of phenol. The liquid-phase oxidation of cumene with molecular oxygen forms cumene hydroperoxide, which is further decomposed into phenol and acetone using a catalyst. The oxidation process requires the use of purified cumene. The catalyst used to decompose cumene hydroperoxide into phenol and acetone is sulphuric acid.
Phenol plays a major role in many industries. Some of the common phenol applications include plywood, window glazing, DVDs and CDs, computers, sports equipment, fiberglass boats, automotive parts and accessories, circuit boards, and flat-panel televisions.
The largest single market for phenol is in the production of Bisphenol A (BPA), which is manufactured from phenol and acetone. BPA, in turn, is used in the manufacturing of epoxy and polycarbonate resins.
Both polycarbonate and epoxy resins are used in many different sectors, making phenol a major component or application for the cumene market. Therefore, all the aforementioned factors are likely to significantly impact demand for the market studied.
By production, zeolite segment is expected to hold the largest market share of 5.6%. There are several disadvantages of using aluminum chloride and solid phosphoric acid as catalysts for the production process of cumene such as high corrosion, environmental hazard and catalyst non-renewability. This has resulted growth in the use of Zeolite as catalysts for production.
Modern industrial processes employ the usage of zeolites as a catalyst for the production of cumene. Zeolites have various advantages over aluminum chloride. The use of zeolites helps to reduce the formation of olefin oligomers and polyalkylbenzenes, which thus enables attain a yield of 98%. The catalyst also enables to attain alkylation at lower pressure and temperatures.
By application, the phenol segment is expected to reach at the highest CAGR of 5.4%. This is attributed to increasing use phenol in various industries such as electrical & electronics, automotive, paints & coatings, cosmetics, and others. Furthermore, it is used as a solvent for paints, lacquers, and enamels, which find their uses in automotive and furniture.
The phenol resins derived using isopropyl benzene finds its usage in the home construction sector in the form of adhesives for structured wood panels, and in the production of mineral wool insulations as binders.
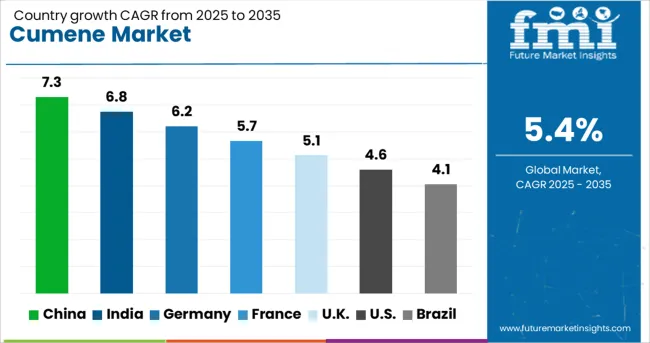
The Asia-Pacific region dominates the cumene market in terms of both consumption and production. The growing automotive industry in growing economies such as China, India, and South Korea. New product launches in consumer and cosmetics industry are expected to support the market growth for cumene market.
China accounts for more than one-fourth of the global coatings market presently. According to the China National Coatings Industry Association, the sector has been registering a growth of 7% in recent years.
Since 2019, the construction of at least ten large coatings investment projects in China has been reported publicly. Nippon has been tapping into this market by upgrading its coatings production process across its new plants in China. ?
China is expected to represent the highest CAGR of 4.6% in the cumene market during the forecast period, to reach USD 2.9 Billion. On the other hand, Japan is expected to represent the highest CAGR of 4.7% in the Cumene Market during the forecast period, to reach USD 2.4 Billion.
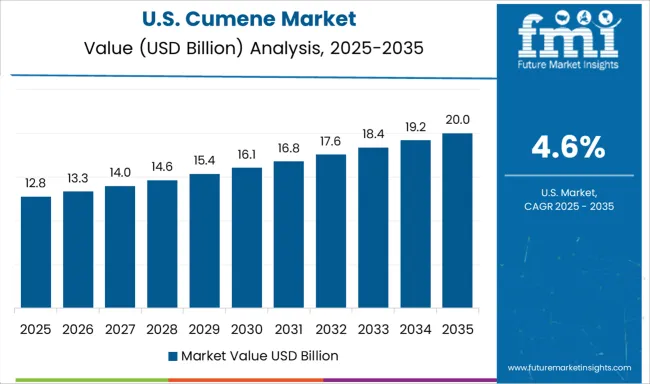
In North America, growing technological advancement in the region is augmenting the market growth. Established automotive industry and rising demand for growing lightweight automobiles are other major factors that are driving the market for cumene market. The US is expected to represent the highest CAGR of 5.0% in the cumene market during the forecast period, to reach USD 14.9 Billion.
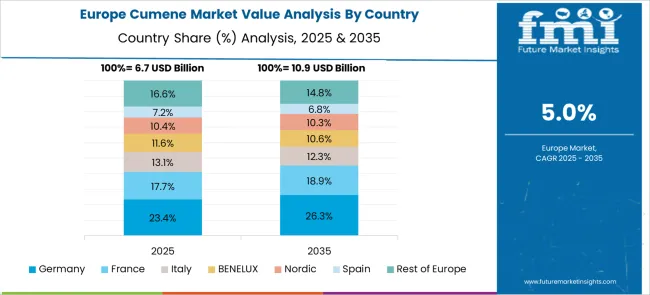
Cumene Market in UK to Witness Better Growth Opportunities
Established automobile market in Europe is expected to support the market growth for cumene. The consumption of cumene market is also increasing in the region due to growing urbanization and growing disposable income among the consumers to drive the market growth.
Easy availability of raw materials such as natural gas and crude oil is further expected to augment the market growth of cumene.UK is expected to hold a significant position in the global cumene market, experiencing a CAGR of 4.4% during the forecast period, to reach USD 1.9 Billion.
Braskem, Cepsa, Chang Chun Group, CITGO, Domo Chemicals, Dow, INEOS, Koch Industries Inc., Kumho P&B Chemicals Inc., Prasol Chemicals Pvt. Ltd., Royal Dutch Shell PLC., SABIC, and Versalis SpA, among others are the top companies in the global cumene market.
With a sizable cumene market share, these main firms are concentrating on growing their consumer base into new countries. These businesses are making use of strategic collaboration initiatives to grow their market share and profits.
Mid-size and smaller businesses, on the other hand, are expanding their market presence by gaining new contracts and entering new markets, thanks to technical developments and product innovations.
Table 01: Global Cumene Market Value (US$ Mn), By Production, 2015 – 2032
Table 02: Global Cumene Market Value (US$ Mn), By Production, 2022 – 2032
Table 03: Global Cumene Market Value (US$ Mn), By Application, 2015 – 2032
Table 04: Global Cumene Market Value (US$ Mn), By Application, 2022 – 2032
Table 05: Global Cumene Market, By Region, 2015 – 2032
Table 06: Global Cumene Market, By Region, 2022 – 2032
Table 07: North America Cumene Market Value (US$ Mn), By Production, 2015 – 2032
Table 08: North America Cumene Market Value (US$ Mn), By Production, 2022 – 2032
Table 09: North America Cumene Market Value (US$ Mn), By Application, 2015 – 2032
Table 10: North America Cumene Market Value (US$ Mn), By Application, 2022 – 2032
Table 11: North America Cumene Market, By Country, 2015 – 2032
Table 12: North America Cumene Market, By Country, 2022 – 2032
Table 13: Latin America Cumene Market Value (US$ Mn), By Production, 2015 – 2032
Table 14: Latin America Cumene Market Value (US$ Mn), By Production, 2022 – 2032
Table 15: Latin America Cumene Market Value (US$ Mn), By Application, 2015 – 2032
Table 16: Latin America Cumene Market Value (US$ Mn), By Application, 2022 – 2032
Table 17: Latin America Cumene Market, By Country, 2015 – 2032
Table 18: Latin America Cumene Market, By Country, 2022 – 2032
Table 19: Europe Cumene Market Value (US$ Mn), By Production, 2015 – 2032
Table 20: Europe Cumene Market Value (US$ Mn), By Production, 2022 – 2032
Table 21: Europe Cumene Market Value (US$ Mn), By Application, 2015 – 2032
Table 22: Europe Cumene Market Value (US$ Mn), By Application, 2022 – 2032
Table 23: Europe Cumene Market, By Country, 2015 – 2032
Table 24: Europe Cumene Market, By Country, 2022 – 2032
Table 25: Asia Pacific Cumene Market Value (US$ Mn), By Production, 2015 – 2032
Table 26: Asia Pacific Cumene Market Value (US$ Mn), By Production, 2022 – 2032
Table 27: Asia Pacific Cumene Market Value (US$ Mn), By Application, 2015 – 2032
Table 28: Asia Pacific Cumene Market Value (US$ Mn), By Application, 2022 – 2032
Table 29: Asia Pacific Cumene Market, By Country, 2015 – 2032
Table 30: Asia Pacific Cumene Market, By Country, 2022 – 2032
Table 31: MEA Cumene Market Value (US$ Mn), By Production, 2015 – 2032
Table 32: MEA Cumene Market Value (US$ Mn), By Production, 2022 – 2032
Table 33: MEA Cumene Market Value (US$ Mn), By Application, 2015 – 2032
Table 34: MEA Cumene Market Value (US$ Mn), By Application, 2022 – 2032
Table 35: MEA Cumene Market, By Country, 2015 – 2032
Table 36: MEA Cumene Market, By Country, 2022 – 2032
Table 37: Global Cumene Market Incremental $ Opportunity, By Production, 2022 - 2032
Table 38: Global Cumene Market Incremental $ Opportunity, By Application, 2022 – 2032
Table 39: Global Cumene Market Incremental $ Opportunity, By Region, 2022 – 2032
Table 40: North America Cumene Market Incremental $ Opportunity, By Production, 2022 - 2032
Table 41: North America Cumene Market Incremental $ Opportunity, By Application, 2022 – 2032
Table 42: North America Cumene Market Incremental $ Opportunity, By Country, 2022 – 2032
Table 43: Latin America Cumene Market Incremental $ Opportunity, By Production, 2022 - 2032
Table 44: Latin America Cumene Market Incremental $ Opportunity, By Application, 2022 – 2032
Table 45: Latin America Cumene Market Incremental $ Opportunity, By Country, 2022 – 2032
Table 46: Europe Cumene Market Incremental $ Opportunity, By Production, 2022 - 2032
Table 47: Europe Cumene Market Incremental $ Opportunity, By Application, 2022 – 2032
Table 48: Europe Cumene Market Incremental $ Opportunity, By Country, 2022 - 2032
Table 49: Asia Pacific Cumene Market Incremental $ Opportunity, By Production, 2022 - 2032
Table 50: Asia Pacific Cumene Market Incremental $ Opportunity, By Application, 2022 – 2032
Table 51: Asia Pacific Cumene Market Incremental $ Opportunity, By Country, 2022 – 2032
Table 52: MEA Cumene Market Incremental $ Opportunity, By Production, 2022 - 2032
Table 53: MEA Cumene Market Incremental $ Opportunity, By Application, 2022 – 2032
Table 54: MEA Cumene Market Incremental $ Opportunity, By Country, 2022 - 2032
Figure 01: Global Cumene Market Value (US$ Mn) and Year-on-Year Growth, 2022-2032
Figure 02: Global Cumene Market Absolute $ Historical Gain (2015 - 2021) and Opportunity (2022 – 2032), US$ Mn
Figure 03: Global Cumene Market Share, By Production, 2021 & 2032
Figure 04: Global Cumene Market Y-o-Y Growth Projections, By Production – 2022-2032
Figure 05: Global Cumene Market Attractiveness Index, By Production – 2022-2032
Figure 06: Global Cumene Market Share, By Application, 2021 & 2032
Figure 07: Global Cumene Market Y-o-Y Growth Projections, By Application – 2022-2032
Figure 08: Global Cumene Market Attractiveness Index, By Application – 2022-2032
Figure 09: Global Cumene Market Share, By Region, 2021 & 2032
Figure 10: Global Cumene Market Y-o-Y Growth Projections, By Region – 2022-2032
Figure 11: Global Cumene Market Attractiveness Index, By Region – 2022-2032
Figure 12: North America Cumene Market Value (US$ Mn) and Year-on-Year Growth, 2022-2032
Figure 13: North America Cumene Market Absolute $ Opportunity Historical (2015 - 2021) and Forecast Period (2022 – 2032), US$ Mn
Figure 14: North America Cumene Market Share, By Production, 2021 & 2032
Figure 15: North America Cumene Market Y-o-Y Growth Projections, By Production – 2022-2032
Figure 16: North America Cumene Market Attractiveness Index, By Production – 2022-2032
Figure 17: North America Cumene Market Share, By Application, 2021 & 2032
Figure 18: North America Cumene Market Y-o-Y Growth Projections, By Application – 2022-2032
Figure 19: North America Cumene Market Attractiveness Index, By Application – 2022-2032
Figure 20: North America Cumene Market Share, By Country, 2021 & 2032
Figure 21: North America Market Y-o-Y Growth Projections, By Country – 2022-2032
Figure 22: North America Market Attractiveness Index, By Country – 2022-2032
Figure 23: Latin America Cumene Market Value (US$ Mn) and Year-on-Year Growth, 2022-2032
Figure 24: Latin America Cumene Market Absolute $ Opportunity Historical (2015 - 2021) and Forecast Period (2022 – 2032), US$ Mn
Figure 25: Latin America Cumene Market Share, By Production, 2021 & 2032
Figure 26: Latin America Cumene Market Y-o-Y Growth Projections, By Production – 2022-2032
Figure 27: Latin America Cumene Market Attractiveness Index, By Production – 2022-2032
Figure 28: Latin America Cumene Market Share, By Application, 2021 & 2032
Figure 29: Latin America Cumene Market Y-o-Y Growth Projections, By Application – 2022-2032
Figure 30: Latin America Cumene Market Attractiveness Index, By Application – 2022-2032
Figure 31: Latin America Cumene Market Share, By Country, 2021 & 2032
Figure 32: Latin America Cumene Market Y-o-Y Growth Projections, By Country – 2022-2032
Figure 33: Latin America Cumene Market Attractiveness Index, By Country – 2022-2032
Figure 34: Europe Cumene Market Value (US$ Mn) and Year-on-Year Growth, 2022-2032
Figure 35: Europe Cumene Market Absolute $ Opportunity Historical (2015 - 2021) and Forecast Period (2022 – 2032), US$ Mn
Figure 36: Europe Cumene Market Share, By Production, 2021 & 2032
Figure 37: Europe Cumene Market Y-o-Y Growth Projections, By Production – 2022-2032
Figure 38: Europe Cumene Market Attractiveness Index, By Production – 2022-2032
Figure 39: Europe Cumene Market Share, By Application, 2021 & 2032
Figure 40: Europe Cumene Market Y-o-Y Growth Projections, By Application – 2022-2032
Figure 41: Europe Cumene Market Attractiveness Index, By Application – 2022-2032
Figure 42: Europe Cumene Market Share, By Country, 2021 & 2032
Figure 43: Europe Cumene Market Y-o-Y Growth Projections, By Country – 2022-2032
Figure 44: Europe Cumene Market Attractiveness Index, By Country – 2022-2032
Figure 45: MEA Cumene Market Value (US$ Mn) and Year-on-Year Growth, 2022-2032
Figure 46: MEA Cumene Market Absolute $ Opportunity Historical (2015 - 2021) and Forecast Period (2022 – 2032), US$ Mn
Figure 47: MEA Cumene Market Share, By Production, 2021 & 2032
Figure 48: MEA Cumene Market Y-o-Y Growth Projections, By Production – 2022-2032
Figure 49: MEA Cumene Market Attractiveness Index, By Production – 2022-2032
Figure 50: MEA Cumene Market Share, By Application, 2021 & 2032
Figure 51: MEA Cumene Market Y-o-Y Growth Projections, By Application – 2022-2032
Figure 52: MEA Cumene Market Attractiveness Index, By Application – 2022-2032
Figure 53: MEA Cumene Market Share, By Country, 2021 & 2032
Figure 54: MEA Cumene Market Y-o-Y Growth Projections, By Country – 2022-2032
Figure 55: MEA Cumene Market Attractiveness Index, By Country – 2022-2032
Figure 56: Asia Pacific Cumene Market Value (US$ Mn) and Year-on-Year Growth, 2022-2032
Figure 57: Asia Pacific Cumene Market Absolute $ Opportunity Historical (2015 - 2021) and Forecast Period (2022 – 2032), US$ Mn
Figure 58: Asia Pacific Cumene Market Share, By Production, 2021 & 2032
Figure 59: Asia Pacific Cumene Market Y-o-Y Growth Projections, By Production – 2022-2032
Figure 60: Asia Pacific Cumene Market Attractiveness Index, By Production – 2022-2032
Figure 61: Asia Pacific Cumene Market Share, By Application, 2021 & 2032
Figure 62: Asia Pacific Cumene Market Y-o-Y Growth Projections, By Application – 2022-2032
Figure 63: Asia Pacific Cumene Market Attractiveness Index, By Application – 2022-2032
Figure 64: Asia Pacific Cumene Market Share, By Country, 2021 & 2032
Figure 65: Asia Pacific Cumene Market Y-o-Y Growth Projections, By Country – 2022-2032
Figure 66: Asia Pacific Cumene Market Attractiveness Index, By Country – 2022-2032
Figure 67: US Cumene Market Value (US$ Mn) and Forecast, 2022 - 2032
Figure 68: US Cumene Market Share, By Production,2021 & 2032
Figure 69: US Cumene Market Share, By Application,2021 & 2032
Figure 70: Canada Cumene Market Value (US$ Mn) and Forecast, 2022 - 2032
Figure 71: Canada Cumene Market Share, By Production,2021 & 2032
Figure 72: Canada Cumene Market Share, By Application,2021 & 2032
Figure 73: Brazil Cumene Market Value (US$ Mn) and Forecast, 2022 - 2032
Figure 74: Brazil Cumene Market Share, By Production,2021 & 2032
Figure 75: Brazil Cumene Market Share, By Application,2021 & 2032
Figure 76: Mexico Cumene Market Value (US$ Mn) and Forecast, 2022 - 2032
Figure 77: Mexico Cumene Market Share, By Production,2021 & 2032
Figure 78: Mexico Cumene Market Share, By Application,2021 & 2032
Figure 79: Germany Cumene Market Value (US$ Mn) and Forecast, 2022 - 2032
Figure 80: Germany Cumene Market Share, By Production,2021 & 2032
Figure 81: Germany Cumene Market Share, By Application,2021 & 2032
Figure 82: U.K. Cumene Market Value (US$ Mn) and Forecast, 2022 - 2032
Figure 83: U.K. Cumene Market Share, By Production,2021 & 2032
Figure 84: U.K. Cumene Market Share, By Application,2021 & 2032
Figure 85: France Cumene Market Value (US$ Mn) and Forecast, 2022 - 2032
Figure 86: France Cumene Market Share, By Production,2021 & 2032
Figure 87: France Cumene Market Share, By Application,2021 & 2032
Figure 88: Italy Cumene Market Value (US$ Mn) and Forecast, 2022 - 2032
Figure 89: Italy Cumene Market Share, By Production,2021 & 2032
Figure 90: Italy Cumene Market Share, By Application,2021 & 2032
Figure 91: BENELUX Cumene Market Value (US$ Mn) and Forecast, 2022 - 2032
Figure 92: BENELUX Cumene Market Share, By Production,2021 & 2032
Figure 93: BENELUX Cumene Market Share, By Application,2021 & 2032
Figure 94: Nordic Countries Cumene Market Value (US$ Mn) and Forecast, 2022 - 2032
Figure 95: Nordic Countries Cumene Market Share, By Production,2021 & 2032
Figure 96: Nordic Countries Cumene Market Share, By Application,2021 & 2032
Figure 97: China Cumene Market Value (US$ Mn) and Forecast, 2022 - 2032
Figure 98: China Cumene Market Share, By Production,2021 & 2032
Figure 99: China Cumene Market Share, By Application,2021 & 2032
Figure 100: Japan Cumene Market Value (US$ Mn) and Forecast, 2022 - 2032
Figure 101: Japan Cumene Market Share, By Production,2021 & 2032
Figure 102: Japan Cumene Market Share, By Application,2021 & 2032
Figure 103: South Korea Cumene Market Value (US$ Mn) and Forecast, 2022 - 2032
Figure 104: South Korea Cumene Market Share, By Production,2021 & 2032
Figure 105: South Korea Cumene Market Share, By Application,2021 & 2032
Figure 106: GCC Countries Cumene Market Value (US$ Mn) and Forecast, 2022 - 2032
Figure 107: GCC Countries Cumene Market Share, By Production,2021 & 2032
Figure 108: GCC Countries Cumene Market Share, By Application,2021 & 2032
Figure 109: South Africa Cumene Market Value (US$ Mn) and Forecast, 2022 - 2032
Figure 110: South Africa Cumene Market Share, By Production,2021 & 2032
Figure 111: South Africa Cumene Market Share, By Application,2021 & 2032
Figure 112: Turkey Cumene Market Value (US$ Mn) and Forecast, 2022 - 2032
Figure 113: Turkey Cumene Market Share, By Production,2021 & 2032
Figure 114: Turkey Cumene Market Share, By Application,2021 & 2032
As of 2021, the market for cumene was valued at USD 23.5 Billion, as per FMI
By 2022-end, sales of cumenes closed at a value of USD 25.1 Billion
From 2015 to 2021, cumene demand expanded at a CAGR of 6.3%
From 2022 to 2032, cumene sales are expected to flourish at a CAGR of 5.4%
By 2032, the market value of cumene is expected to reach USD 42.7 Billion.
From 2022 to 2032, cumene demand in the US is expected to surge at a CAGR of 5.0%
By production, the zeolite category constitutes the bulk of market share with a CAGR of 5.6%.
By application, the phenol category of cumene is expected to dominate the market with a CAGR of 5.4%.
Thank you!
You will receive an email from our Business Development Manager. Please be sure to check your SPAM/JUNK folder too.