The cylindrical grinders market worldwide is basing its expanded growth on its ability to provide industries with high-precision tooling helping in manufacturing in an efficient manner. Cylindrical grinders are a type of physical grater that specializes in creating smooth, precise surfaces in various cylindrical parts making them indispensable in the automotive, aerospace, general engineering, and industrial machinery sectors.
With the stringent manufacturing requirements and a surge in demand for quality, defect-free components has led to the adoption of advanced cylindrical grinding machines. Machine tools have the remarkable ability to define their own position and require very skilled operators to enjoy the benefits of the machines.
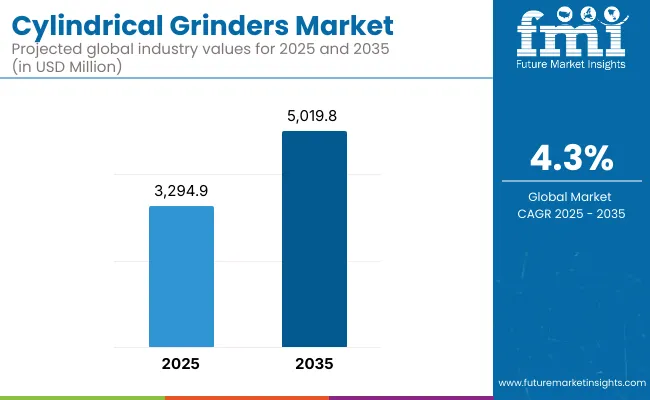
With steady demand both from established as well as emerging markets, the cylindrical grinders market is projected to witness an average but steady growth through 2035. The cylindrical grinders market is estimated to be worth approximately USD 3,294.9 Million in the year 2025. (CAGR of 4.3%) from 2023 to 2035, the market was valued at approximately USD 5,019.8 Million in 2035.
It is this consistent expansion that is fueled by growing demand for precision machining, technological advancements, and continued manufacturing investments.

| Metric | Value |
|---|---|
| Market Size in 2025 | USD 3,294.9 Million |
| Projected Market Size in 2035 | USD 5,019.8 Million |
| CAGR (2025 to 2035) | 4.3% |
Owing to established industries including aerospace, automotive, and general engineering, North America also accounts for a significant share of the total cylindrical grinder market.
The USA and Canada, especially the USA and Canadian large manufacturers, make a huge contribution to the market, as they are still focusing on updating manufacturing technologies and producing high-precision components. Demand for cylindrical grinders is further driven by the region's focus on comparatively more advanced methods of manufacturing and innovation.
Europe is another vitally important market and one that has an emphasis on quality manufacturing and advanced engineering. Germany, Italy, and Switzerland among others are also prominent adopters of cylindrical grinders owing to their long-standing expertise in high-precision machining.
Demand for advanced grinding solutions from the region’s strong automotive and aerospace sectors continues to motivate demand, with strict quality standards providing a steady market force for cylindrical grinders.
The growth of the cylindrical grinder market in the Asia Pacific is mainly due to the rapid industrialization and increasing manufacturing bases, as well as the rising adoption of automation. Significant demand for cylindrical grinders in countries such as China, Japan, and South Korea is observed with their increased production and more precise machining. Strong market growth is backed by the burgeoning automotive industry in the region, an expanding general engineering and infrastructure projects.
Challenges
High Initial Investment, Skilled Labor Shortage, and Competition from CNC Machining Centers
One of the major factors obstructing the growth of the cylindrical grinders market is the high initial cost of precision grinding equipment. Driven by the demand for high-tolerance components and the need for automated control systems with CNC integration, advanced cylindrical grinders, are out of reach for small-to-medium manufacturers.
Moreover, manual and CNC grinding operations require skilled workers and little programming and tool selection experience, which is another substantial challenge. Moreover, threat from other machining processes like precision CNC turning and milling are periodically restraining the market growth. These multi-function machining centers are typically preferred for complex-part production and minimize dependence on standalone cylindrical grinders.
Opportunities
Growth in Aerospace, Automotive, and Smart Manufacturing Innovations
Nevertheless, the demand for high-precision machining in different industries like aerospace, automotive, and medical device manufacturing enhances the cylinder grinders market growth. As industries pivot toward lightweight materials, tighter tolerances and improved surface finishes, cylindrical grinding has a critical role to play in next-generation engine components, transmission systems and industrial tools.
Growing implementation of advanced AI-based automation, predictive maintenance, and IoT powered smart grinding solutions are helping in improving productivity, decreasing downtime, and optimizing energy efficiency. And to stay in line with Industry 4.0, robotics integration and real-time process monitoring all contribute to the expanding market of smart cylindrical grinders.
| Market Shift | 2020 to 2024 Trends |
|---|---|
| Regulatory Landscape | Compliance with ISO 9001 precision machining standards and workplace safety regulations. |
| Consumer Trends | Demand for high-precision grinding solutions in automotive, aerospace, and industrial machining. |
| Industry Adoption | Use in metalworking, tooling, and bearing manufacturing industries. |
| Supply Chain and Sourcing | Dependence on high-strength alloy components and precision tool manufacturers. |
| Market Competition | Dominated by traditional machine tool manufacturers and precision grinding specialists. |
| Market Growth Drivers | Growth fueled by automotive lightweighting, aerospace precision machining, and demand for ultra-fine surface finishes. |
| Sustainability and Environmental Impact | Moderate adoption of low-energy grinding solutions and waste-reduction initiatives. |
| Integration of Smart Technologies | Early adoption of CNC-integrated grinders and automation-assisted machining. |
| Advancements in Machining Technology | Development of high-speed grinding spindles and precision tool wear monitoring. |
| Market Shift | 2025 to 2035 Projections |
|---|---|
| Regulatory Landscape | Stricter energy efficiency mandates, smart manufacturing certifications, and automated safety compliance. |
| Consumer Trends | Growth in AI-powered grinders, automated tool calibration, and robotic-assisted grinding solutions. |
| Industry Adoption | Expansion into smart machining, IoT-enabled grinders, and fully autonomous precision grinding. |
| Supply Chain and Sourcing | Shift toward sustainable material sourcing, AI-driven supply chain optimization, and eco-friendly machining fluids. |
| Market Competition | Entry of AI-driven automation firms, robotics-integrated grinding startups, and cloud-based process monitoring providers. |
| Market Growth Drivers | Accelerated by digital twin technology, real-time quality inspection, and AI-driven production line optimization. |
| Sustainability and Environmental Impact | Large-scale shift toward carbon-neutral manufacturing, water-based coolant systems, and eco-friendly abrasives. |
| Integration of Smart Technologies | Expansion into AI-powered predictive maintenance, IoT-enabled real-time process adjustments, and self-learning grinding machines. |
| Advancements in Machining Technology | Evolution toward self-optimizing grinding tools, AI-driven accuracy enhancements, and next-gen superfinishing processes. |

The USA cylindrical grinders market has been a steady market, with growing demand from aerospace, automotive, and precision engineering. The growing adoption of CNC-based cylindrical grinding machines for high-precision machining is driving the expansion of the market. Furthermore, the growing trend toward automation in manufacturing processes is significantly influencing the need for high-performance grinding technologies.
| Country | CAGR (2025 to 2035) |
|---|---|
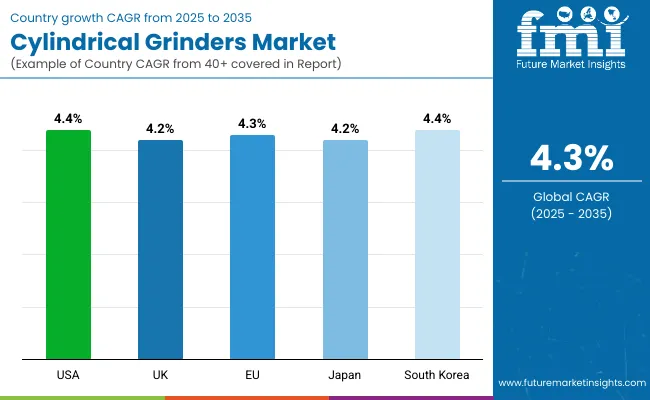
| USA | 4.4% |
The cylindrical grinders market in the United Kingdom is driven by the increasing need for precision manufacturing and industrial automation. Market growth is propelled by the demand for high-accuracy grinding machines in the automotive and defense sectors. The growing trend of smart manufacturing and Industry 4.0 technologies have also driven up investment in grinding solutions.
| Country | CAGR (2025 to 2035) |
|---|---|
| UK | 4.2% |
The cylindrical grinders market is increasing steadily owing to the presence of well-established industries such as automotive, aerospace, and heavy machinery.
The demand for high-performance grinding machines for complex machining applications and high-tolerance machining processes is increasing, which is creating the demand on the high-performance machine market. The next-generation cylindrical grinders market is also gaining momentum across the world due to various government-led programs promoting automation and smart manufacturing.
| Country | CAGR (2025 to 2035) |
|---|---|
| European Union (EU) | 4.3% |
The cylindrical grinders market in Japan is expected to grow at a steady pace, driven by the country's leadership in precision engineering and high-quality machine tool production. The growth of the market is being driven by the increasing need for ultra-precise grinding solutions in electronics, robotics, and medical device manufacturing. Moreover, continuous advancements in CNC grinding technology as well as automation are fueling the demand of the market.
| Country | CAGR (2025 to 2035) |
|---|---|
| Japan | 4.2% |
The South Korea section of the cylindrical grinders market is also expected to witness growth as more advanced grinding solutions are utilized in the semiconductor, automotive, and industrial machinery industries. CNC cylindrical grinders are being increasingly used now due to the rising demand for high-efficiency machining or automated machining. Moreover, increasing love of smart factory and AI with precision manufacturing is helping global market growth.
| Country | CAGR (2025 to 2035) |
|---|---|
| South Korea | 4.4% |
Cylindrical grinders market acquires growing attention with industries targeting precise grinding solutions for metal fabrication, glass engraving and other industrial components cylindrical grinders are essential in the automotive, aerospace, tool & die, and other general engineering applications requiring high accuracy, high efficiency, and high automation.
Examples of the types of this market could be global laser market breakdown by type (CNC, Manually-Controlled, PLC-Controlled), and By Application (Metal, Glass, Granite, Wood, Others).
The largest segment of the cylindrical grinders market is the CNC cylindrical grinders segment, with industries gradually utilizing computerized, high pruning grinders for automated manufacturing and efficient machining. CNC cylindrical grinders provide greater accuracy, repeatability, and efficiency, which is why they are often used for automotive engine components, aerospace parts, and high-precision tooling.
As cyber-physical systems continue to be explored, the demand for CNC cylindrical grinders that are capable of real-time monitoring, adaptive controls, and cloud connectivity are increasing with the trend of Industry 4.0, smart manufacturing, and AI machining processes. Manufacturers are adopting advanced CNC grinding technologies that offer productivity enhancements and shorter cycle times, while also taking process automation to the next level.
Manual cylindrical grinders remain an important segment of the market, particularly in small-scale machining workshops, custom part manufacturers, and specialized tool grinding. Operator-controlled, cost-efficient precision grinding, these grinders are often used for low-volume production applications and repair applications.
And, in many industries where flexibility, hands-on machining, and custom work piece finishing are needed, manually-controlled grinders are still relevant despite growing automation.
The segment of application of metal accounts for the largest share of the global market, since cylindrical grinders are extensively used in precision machining, automotive part manufacturing, and tool & die making and industrial component finishing. Grinding is a must for hardened steel parts, high precision shafts, bearings, gears, and hydraulic components, providing required tolerances tightness, surface smoothness, and dimensional accuracy.
Aerospace, medical devices and automotive market segments generate a demand for lightweight, high-strength metal components, advanced grinding technologies are required to improve material properties and machining productivity. Market growth is also influenced by the increasing focus on automated production, high-speed grinding, and sophisticated material coatings.
In particular, the demand for glass application is quite high from the architectural glass finishing, optical lens manufacturing, and precision mirror fabrication segment. They are used for shaping, polishing and refining high-quality glass surfaces, ensuring scratch-free precision-ground optical components.
However, the rising demand for cutting-edge optical systems, smartphone displays, and automotive glass coatings in various industries has provided momentum to the advanced grinding systems for effective glass fabricating.
The cylindrical grinders market is anticipated to witness growth due to the growing need for high precision machining, the trend of automation of grinding processes and development in CNC grinding technology.
Due to their accuracy, durability, and ability to handle complex grinding operations, these machines are widely employed by automotive, aerospace, tool manufacturing, and general metalworking industries. With an aim to drive the productivity, cost-efficiency, and performance, companies are emphasizing on AI-based machine optimization, CNC controlled precision grinding, and energy efficient grinding solutions.
Market Share Analysis by Key Players & Cylindrical Grinder Manufacturers
| Company Name | Estimated Market Share (%) |
|---|---|
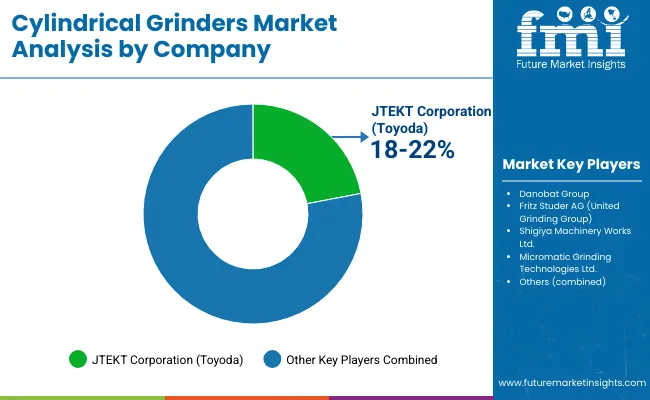
| JTEKT Corporation (Toyoda) | 18-22% |
| Danobat Group | 12-16% |
| Fritz Studer AG (United Grinding Group) | 10-14% |
| Shigiya Machinery Works Ltd. | 8-12% |
| Micromatic Grinding Technologies Ltd. | 5-9% |
| Other Precision Grinding Machine Suppliers (combined) | 30-40% |
| Company Name | Key Offerings/Activities |
|---|---|
| JTEKT Corporation (Toyoda) | Develops high-precision CNC cylindrical grinders, AI-driven process automation, and energy-efficient grinding technology. |
| Danobat Group | Specializes in customized high-precision cylindrical grinding machines, AI-powered adaptive control, and integrated automation solutions. |
| Fritz Studer AG (United Grinding Group) | Provides CNC-controlled cylindrical grinders, AI-enhanced surface finish optimization, and smart grinding process monitoring. |
| Shigiya Machinery Works Ltd. | Focuses on ultra-precision cylindrical grinding machines, AI-assisted wear detection, and advanced machine rigidity. |
| Micromatic Grinding Technologies Ltd. | Offers cost-effective cylindrical grinding machines, AI-powered parameter adjustments, and automated grinding accuracy improvements. |
Key Market Insights

JTEKT Corporation (Toyoda) (18-22%)
JTEKT is the market leader in cylindrical grinders, providing high-precision, CNC-controlled grinding solutions featuring AI-driven laboratory surface quality improvement and pick-up productivity optimization.
Danobat Group (12-16%)
Danobat is focused on customizable cylindrical grinding machines, with AI-powered real-time process monitoring, high-rigidity grinding accuracy, and automation integration.
Fritz Studer AG (United Grinding Group) (10-14%)
Fritz Studer supplies a wide range of high-performance CNC cylindrical grinders, leveraging such features as AI-assisted tool wear detection, process corrections via machine learning and energy-optimized operation.
Shigiya Machinery Works Ltd. (8-12%)
Shigiya is dedicated to advanced cylindrical grinding technologies, including AI-enabled vibration reduction, ultra-precision surface finishes, and ergonomically minded automation.
Micromatic Grinding Technologies Ltd. (5-9%)
Micromatic builds robust and cost-effective cylindrical grinders with AI integrated features for parameter tuning, machine stability, and quality checking automations
Other Key Players (30-40% Combined)
Several precision machinery manufacturers, CNC grinding machine providers, and industrial automation firms contribute to next-generation cylindrical grinding innovations, AI-powered automation, and ultra-precision machining advancements. These include:
The overall market size for cylindrical grinders market was USD 3,294.9 Million in 2025.
Cylindrical grinders market is expected to reach USD 5,019.8 Million in 2035.
The demand for cylindrical grinders is expected to rise due to increasing adoption in precision manufacturing, growing demand from the automotive and aerospace industries, and advancements in CNC grinding technologies.
The top 5 countries which drives the development of cylindrical grinders market are USA, UK, Europe Union, Japan and South Korea.
CNC cylindrical grinders and metal applications to command significant share over the assessment period.


Our Research Products

The "Full Research Suite" delivers actionable market intel, deep dives on markets or technologies, so clients act faster, cut risk, and unlock growth.

The Leaderboard benchmarks and ranks top vendors, classifying them as Established Leaders, Leading Challengers, or Disruptors & Challengers.

Locates where complements amplify value and substitutes erode it, forecasting net impact by horizon

We deliver granular, decision-grade intel: market sizing, 5-year forecasts, pricing, adoption, usage, revenue, and operational KPIs—plus competitor tracking, regulation, and value chains—across 60 countries broadly.

Spot the shifts before they hit your P&L. We track inflection points, adoption curves, pricing moves, and ecosystem plays to show where demand is heading, why it is changing, and what to do next across high-growth markets and disruptive tech

Real-time reads of user behavior. We track shifting priorities, perceptions of today’s and next-gen services, and provider experience, then pace how fast tech moves from trial to adoption, blending buyer, consumer, and channel inputs with social signals (#WhySwitch, #UX).

Partner with our analyst team to build a custom report designed around your business priorities. From analysing market trends to assessing competitors or crafting bespoke datasets, we tailor insights to your needs.
Supplier Intelligence
Discovery & Profiling
Capacity & Footprint
Performance & Risk
Compliance & Governance
Commercial Readiness
Who Supplies Whom
Scorecards & Shortlists
Playbooks & Docs
Category Intelligence
Definition & Scope
Demand & Use Cases
Cost Drivers
Market Structure
Supply Chain Map
Trade & Policy
Operating Norms
Deliverables
Buyer Intelligence
Account Basics
Spend & Scope
Procurement Model
Vendor Requirements
Terms & Policies
Entry Strategy
Pain Points & Triggers
Outputs
Pricing Analysis
Benchmarks
Trends
Should-Cost
Indexation
Landed Cost
Commercial Terms
Deliverables
Brand Analysis
Positioning & Value Prop
Share & Presence
Customer Evidence
Go-to-Market
Digital & Reputation
Compliance & Trust
KPIs & Gaps
Outputs
Full Research Suite comprises of:
Market outlook & trends analysis
Interviews & case studies
Strategic recommendations
Vendor profiles & capabilities analysis
5-year forecasts
8 regions and 60+ country-level data splits
Market segment data splits
12 months of continuous data updates
DELIVERED AS:
PDF EXCEL ONLINE
Cylindrical Cans Market Size and Share Forecast Outlook 2025 to 2035
Laboratory Grinders Market Size and Share Forecast Outlook 2025 to 2035

Thank you!
You will receive an email from our Business Development Manager. Please be sure to check your SPAM/JUNK folder too.
Chat With
MaRIA