Dentures Market Size and Share Forecast Outlook (2022 to 2032)

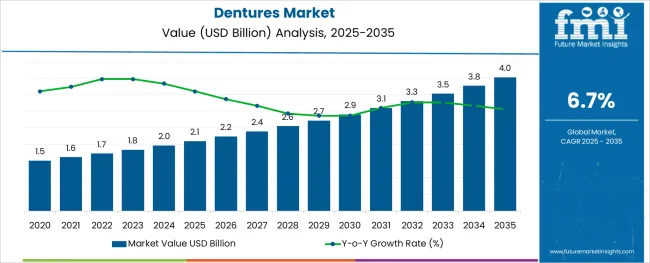
By the end of 2022, the global dentures market is anticipated to be worth USD 1.7 Billion, and it will grow at a CAGR of 6.7% to reach an expected valuation of around USD 3.2 Billion by the year 2032.

Complete dentures dominate the worldwide market in 2021, with a share of around 76.5%, according to a recent analysis by Future Market Insights.

Market Outlook:

Data Points Market Insights
Market Value 2021 USD 1.6 Billion
Market Value 2022 USD 1.7 Billion
Market Value 2032 USD 3.2 Billion
CAGR 2022 to 2032 6.7%
Market Share of Top 5 Countries 56.6%
Key Market Players DENTSPLY SIRONA Inc., COLTENE Holding AG, GC dental, Amann Girrbach AG, Ivoclar Vivadent AG, Zimmer Biomet Holdings Inc., Mitsui Chemicals Inc., Keystone Dental, Inc., Align Technology, Inc., and VOCO GmbH

Complete dentures are seen to be the least expensive and invasive alternative for the rehabilitation of edentulous people. The denture fit is a crucial aspect that determines how well a detachable prosthesis performs. Dentures that fit properly provide more comfort and reduce the occurrence of traumatic ulcers.

Sales Comparison (2012 to 2021) vs Forecast to 2032

The market value for dentures was approximately 13.7% of the overall ~USD 11.4 Billion of the global dental implants and prosthetics market in 2021.

The sale of dentures expanded at a CAGR of 5.0% from 2012 to 2021.

Edentulousness is a multifaceted phenomenon with an effect on people's quality of life. Efficient rehabilitation and restoration are essential for maintaining the continuity of the chewing and swallowing process and removing any cosmetic or phonetic issues. A removable partial denture is designed for partially edentulous patients who want replacement teeth for function but are unable to get a bridge or an implant because they lack the necessary teeth to support the bridge, the procedure is expensive, or other factors.

A well-designed partial detachable dental prosthesis is still one of the most often-used treatment modalities, meeting the needs of millions of people worldwide or being used for aesthetic purposes, among the different partial edentulism treatment strategies such as implant- and tooth-supported fixed prostheses.

Many elderly individuals require dental care, which includes removable partial dentures. According to studies, there are a variety of reasons why older individuals do not properly clean their dentures and do not develop good oral hygiene practices, including socioeconomic position, age, education, systemic diseases, and tobacco consumption. Additionally, lack of knowledge about maintaining dental health and recurring recalls are crucial factors in the situation described above. This presents propulsion in the demand for dentures and dental implants and prosthetics, thus driving the overall market for dentures.

Because of the aforementioned factors, it is anticipated that from 2022 to 2032, the global dentures market will expand at a CAGR of 6.7%.

Opportunities for Growth in the Global Dentures Market

Recent advancements have made it possible to manufacture completely removable dental prostheses (CRDPs) using computer-aided design and manufacturing (CAD/CAM) technologies. Evidence suggests that CRDPs produced using CAD/CAM techniques have enhanced material characteristics and are as accurate as or better than CRDPs produced using traditional manufacturing techniques.

Numerous studies have shown that CRDPs made using CAD/CAM techniques greatly increase patient satisfaction. With the advent of CAD/CAM technology, both the clinical protocols necessary for denture construction and the production processes for CRDPs are revolutionized.

Furthermore, CAD/CAM manufacture of removable full dentures is less expensive in terms of laboratory and overall costs when compared to conventional removable complete dentures.

The adoption of digital solutions for the design and development of dentures will thus provide the key competitors within the dentures market with lucrative opportunities for expansion over the forecast period.

Restraints Limiting Demand for Dentures Worldwide

For patients with missing teeth or who are partially toothless, removable dentures are still a popular and affordable treatment option. However, there are a number of potential issues with these dentures. Since many physicians entrust planning to technicians, it is considered that failures are caused by the destructive impact of poorly planned and constructed dentures.

Since surgical and prosthodontic procedures are carried out to increase patients' satisfaction, it is reasonable to believe that the quality of prosthetic treatment may also have an impact on oral health. As a result, oral health and quality of life are related.

The potential impact of a decreased quality of life includes a decrease in demand for procedures involving the adoption or replacement of dentures. This is a consequence of lower patient satisfaction, thus restraining the overall market.
Country-wise Insights in the Denture Manufacturing Industry

What Makes the USA a Large Market for Dentures?

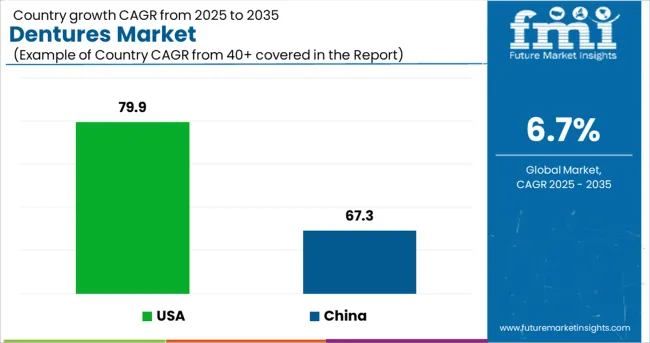
With a market share of 79.9% in all of North America in 2021, the US presently dominates the region and is expected to sustain this growth throughout the forecast period. According to the United States Census Bureau and the Simmons National Consumer Survey (NHCS), about 40.99 million Americans used dentures in 2020. This high rate of adoption for dentures is set to propel the overall market growth during the forecasted years.

What Makes China a Highly Lucrative Market for Dentures?

China represents roughly 67.3% of the East Asia market in 2021, with growth at a lucrative CAGR of 6.5% throughout the forecast period. Varieties of denture and medical dental materials have entered the market as consumer awareness of oral health and aesthetics has grown. This is propelled by the high demand for facial aesthetics within the country, thus promoting sales within the overall global dentures market over the forecasted years.

What is the Outlook of Germany in the Dentures Market?

During the forecast years, Germany is projected to grow at a CAGR of nearly 5.1% in the global dentures market. Germany has transformed into a hub for dental tourism. With the presence of several established and independent dental clinics and services, the market for dentures within the country is set to present lucrative growth over the forecasted years.

Category-wise Insights in the Dentures Market

Which Material is Widely Adopted for the Production of Dentures?

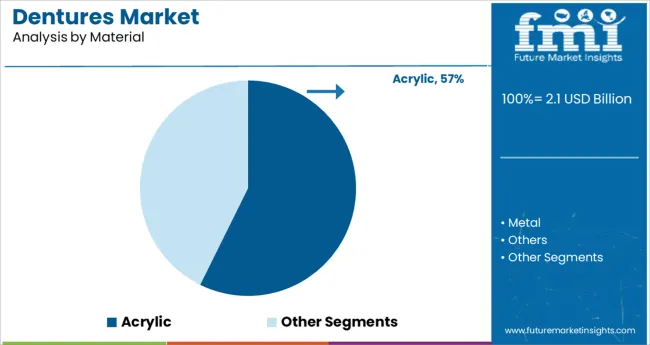
Acrylic dentures are expected to present high growth at a CAGR of 6.5% throughout the forecast period. Directly following tooth removal, acrylic dentures are typically used as interim or temporary dentures to fill in any gaps left by missing teeth.

Acrylic dentures, like metal clasps and component pieces, look great and can be produced in a variety of colors to complement the gums. In addition, compared to metal frame dentures, the length of treatment for acrylic dentures is shorter.

Which Types of Dentures and Widely Produced Globally?

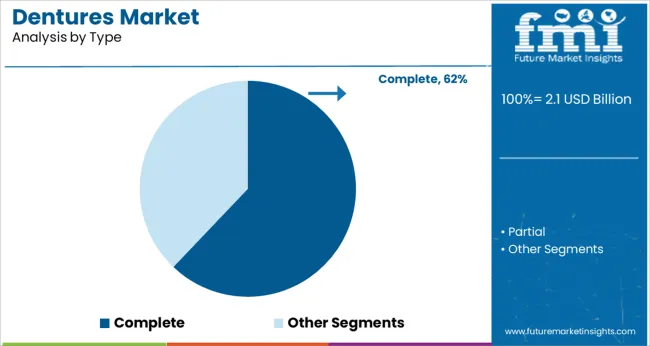
Complete dentures hold a share of around 76.5% in 2021, and this segment is expected to display gradual growth over the forecast period. Complete dentures offer a degree of aesthetics and functionality that is acceptable to many patients, are reasonably affordable, simple to construct and maintain, and are therefore boosting sales in this market segment worldwide.

What Usage of Dentures is Largely Prevalent in the Global Dentures Market?

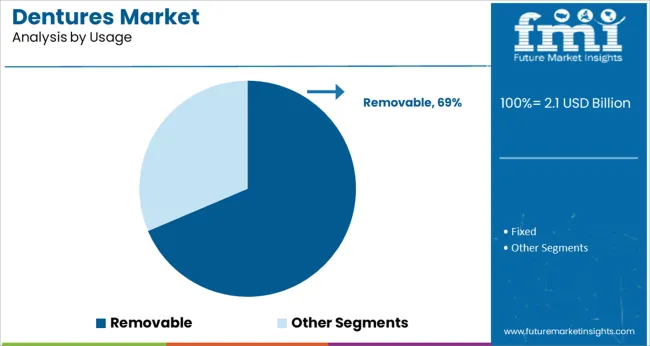
Removable dentures hold a market share of around 63.4% in the global dentures market in 2021. One of the most affordable options for replacing missing teeth is removable dentures. The removable denture helps maintain the shape of the face while giving the mouth it's original functioning. Thus, many patients opt for a removable denture over fixed dentures.

How are Dental Clinics a Major End User for Dentures?

Dental clinics hold the highest market share value of 41.6% during the year 2021. With the presence of skilled dental professionals, as well as the presence of a proper treatment plan, dental clinics take the lead as end users within the global dentures market. The segment is further set to present growth at a CAGR of 7.8% over the span of the projected years.
Competitive Landscape of the Dentures Market

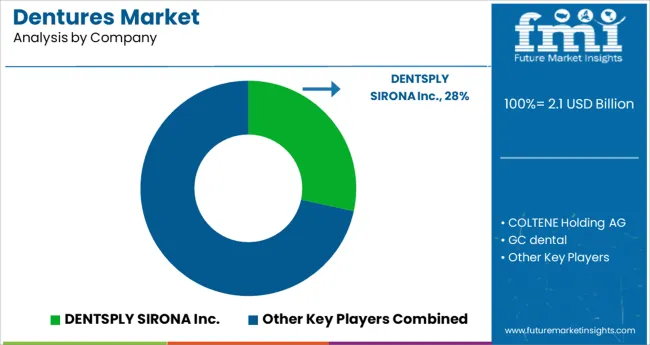
Due to the rapidly advancing state of technology, major corporations like Dentsply Sirona are focusing on developing dental implants using digital dentistry. In order to gain a competitive edge in the dentures market, numerous businesses are now pursuing strategic alliances.

  • Zimmer Biomet announced the debut of OverdenSURE®, a novel overdenture attachment method for Zimmer Biomet dental implants, in North America and Europe in February 2022.
  • Exocad GmbH (exocad), an Align Technology, Inc. firm, announced the launch of PartialCAD 3.0 Galway, a removable partial denture frameworks module, in June 2021. This version includes new and cutting-edge features for the design of premium partial dentures.

Similarly, recent developments related to companies manufacturing dentures have been tracked by the team at Future Market Insights, which are available in the full report.

Scope and Coverage of the Dentures Market Report

Attribute Details
Forecast Period 2022 to 2032
Historical Data Available for 2012 to 2021
Market Analysis USD Million for Value
Key Regions Covered North America, Latin America, Europe, South Asia, East Asia, Oceania, and Middle East & Africa
Key Countries Covered USA, Canada, Brazil, Mexico, Argentina, UK, Germany, Italy, Russia, Spain, France, BENELUX, India, Thailand, Indonesia, Malaysia, Japan, China, South Korea, Australia, New Zealand, Turkey, GCC Countries, North Africa, and South Africa
Key Market Segments Covered Material, Type, Usage, End User, and Region
Key Companies Profiled

DENTSPLY SIRONA Inc.; COLTENE Holding AG; GC dental; Amann Girrbach AG; Ivoclar Vivadent AG; Zimmer Biomet Holdings Inc.; Mitsui Chemicals Inc.; Keystone Dental, Inc.; Align Technology, Inc.; VOCO GmbH

Pricing Available upon Request

Top Segments Studied in the Dentures Market Research Report

By Material:

  • Acrylic
  • Metal
  • Others

By Type:

  • Complete
  • Partial

By Usage:

  • Removable
  • Fixed

By End User:

  • Dental Clinics
  • Hospitals
  • Dental Group Practices

By Region:

  • North America
  • Latin America
  • Europe
  • South Asia
  • East Asia
  • Oceania
  • Middle East and Africa (MEA)

Table of Content

  • 1. Executive Summary 
  • 2. Market Overview
  • 3. Key Market Trends
  • 4. Key Success Factors
  • 5. Market Background
  • 6. COVID-19 Crisis Analysis
  • 7. Global Dentures Market - Pricing Analysis
  • 8. Global Dentures Market Volume (Units) Analysis 2012 to 2021 and Forecast, 2022 to 2032
  • 9. Global Dentures Market Demand (in Value or Size in USD Million) Analysis 2012 to 2021 and Forecast, 2022 to 2032
  • 10. Global Dentures Market Analysis 2012 to 2021 and Forecast 2022 to 2032, By Material
    • 10.1. Acrylic
    • 10.2. Metal
    • 10.3. Others
  • 11. Global Dentures Market Analysis 2012 to 2021 and Forecast 2022 to 2032, By Type
    • 11.1. Complete
    • 11.2. Partial
  • 12. Global Dentures Market Analysis 2012 to 2021 and Forecast 2022 to 2032, By Usage
    • 12.1. Removable
    • 12.2. Fixed
  • 13. Global Dentures Market Analysis 2012 to 2021 and Forecast 2022 to 2032, By End User
    • 13.1. Dental Clinics
    • 13.2. Hospitals
    • 13.3. Dental Group Practices
  • 14. Global Dentures Market Analysis 2012 to 2021 and Forecast 2022 to 2032, By Region
    • 14.1. North America
    • 14.2. Latin America
    • 14.3. Europe
    • 14.4. East Asia
    • 14.5. South Asia
    • 14.6. Oceania
    • 14.7. Middle East and Africa (MEA)
  • 15. North America Dentures Market Analysis 2012 to 2021 and Forecast 2022 to 2032
  • 16. Latin America Dentures Market Analysis 2012 to 2021 and Forecast 2022 to 2032
  • 17. Europe Dentures Market Analysis 2012 to 2021 and Forecast 2022 to 2032
  • 18. East Asia Dentures Market Analysis 2012 to 2021 and Forecast 2022 to 2032
  • 19. South Asia Dentures Market Analysis 2012 to 2021 and Forecast 2022 to 2032
  • 20. Oceania Dentures Market 2012-2021 and Forecast 2022-2032
  • 21. Middle East and Africa (MEA) Dentures Market Analysis 2012 to 2021 and Forecast 2022 to 2032
  • 22. Market Structure Analysis
  • 23. Competition Analysis
    • 23.1. DENTSPLY SIRONA Inc.
    • 23.2. COLTENE Holding AG
    • 23.3. GC dental
    • 23.4. Amann Girrbach AG
    • 23.5. Ivoclar Vivadent AG
    • 23.6. Zimmer Biomet Holdings Inc.
    • 23.7. Mitsui Chemicals Inc.
    • 23.8. Keystone Dental, Inc.
    • 23.9. Align Technology, Inc.
    • 23.10. VOCO GmbH
  • 24. Assumptions and Acronyms Used
  • 25. Research Methodology

List of Tables

Table 01: Global Dentures Market Value (US$ Million) Analysis and Forecast 2012 to 2032, by Material

Table 02: Global Dentures Market Volume (Units) Analysis and Forecast 2012 to 2032, by Material

Table 03: Global Dentures Market Value (US$ Million) Analysis and Forecast 2012 to 2032, by Type

Table 04: Global Dentures Market Value (US$ Million) Analysis and Forecast 2012 to 2032, by Usage

Table 05: Global Dentures Market Value (US$ Million) Analysis and Forecast 2012 to 2032, by End User

Table 06: North America Dentures Market Value (US$ Million) Analysis 2012 to 2021 and Forecast 2022 to 2032, by Country

Table 07: North America Dentures Market Value (US$ Million) Analysis and Forecast 2012 to 2032, by Material

Table 08: North America Dentures Market Volume (Units) Analysis and Forecast 2012 to 2032, by Material

Table 09: North America Dentures Market Value (US$ Million) Analysis and Forecast 2012 to 2032, by Type

Table 10: North America Dentures Market Value (US$ Million) Analysis and Forecast 2012 to 2032, by Usage

Table 11: North America Dentures Market Value (US$ Million) Analysis and Forecast 2012 to 2032, by End User

Table 12: Latin America Dentures Market Value (US$ Million) Analysis 2012 to 2021 and Forecast 2022 to 2032, by Country

Table 13: Latin America Dentures Market Value (US$ Million) Analysis and Forecast 2012 to 2032, by Material

Table 14: Latin America Dentures Market Volume (Units) Analysis and Forecast 2012 to 2032, by Material

Table 15: Latin America Dentures Market Value (US$ Million) Analysis and Forecast 2012 to 2032, by Type

Table 16: Latin America Dentures Market Value (US$ Million) Analysis and Forecast 2012 to 2032, by Usage

Table 17: Latin America Dentures Market Value (US$ Million) Analysis and Forecast 2012 to 2032, by End User

Table 18: Europe Dentures Market Value (US$ Million) Analysis 2012 to 2021 and Forecast 2022 to 2032, by Country

Table 19: Europe Dentures Market Value (US$ Million) Analysis and Forecast 2012 to 2032, by Material

Table 20: Europe Dentures Market Volume (Units) Analysis and Forecast 2012 to 2032, by Material

Table 21: Europe Dentures Market Value (US$ Million) Analysis and Forecast 2012 to 2032, by Type

Table 22: Europe Dentures Market Value (US$ Million) Analysis and Forecast 2012 to 2032, by Usage

Table 23: Europe Dentures Market Value (US$ Million) Analysis and Forecast 2012 to 2032, by End User

Table 24: South Asia Dentures Market Value (US$ Million) Analysis 2012 to 2021 and Forecast 2022 to 2032, by Country

Table 25: South Asia Dentures Market Value (US$ Million) Analysis and Forecast 2012 to 2032, by Material

Table 26: South Asia Dentures Market Volume (Units) Analysis and Forecast 2012 to 2032, by Material

Table 27: South Asia Dentures Market Value (US$ Million) Analysis and Forecast 2012 to 2032, by Type

Table 28: South Asia Dentures Market Value (US$ Million) Analysis and Forecast 2012 to 2032, by Usage

Table 29: South Asia Dentures Market Value (US$ Million) Analysis and Forecast 2012 to 2032, by End User

Table 30: East Asia Dentures Market Value (US$ Million) Analysis 2012 to 2021 and Forecast 2022 to 2032, by Country

Table 31: East Asia Dentures Market Value (US$ Million) Analysis and Forecast 2012 to 2032, by Material

Table 32: East Asia Dentures Market Volume (Units) Analysis and Forecast 2012 to 2032, by Material

Table 33: East Asia Dentures Market Value (US$ Million) Analysis and Forecast 2012 to 2032, by Type

Table 34: East Asia Dentures Market Value (US$ Million) Analysis and Forecast 2012 to 2032, by Usage

Table 35: East Asia Dentures Market Value (US$ Million) Analysis and Forecast 2012 to 2032, by End User

Table 36: Oceania Dentures Market Value (US$ Million) Analysis 2012 to 2021 and Forecast 2022 to 2032, by Country

Table 37: Oceania Dentures Market Value (US$ Million) Analysis and Forecast 2012 to 2032, by Material

Table 38: Oceania Dentures Market Volume (Units) Analysis and Forecast 2012 to 2032, by Material

Table 39: Oceania Dentures Market Value (US$ Million) Analysis and Forecast 2012 to 2032, by Type

Table 40: Oceania Dentures Market Value (US$ Million) Analysis and Forecast 2012 to 2032, by Usage

Table 41: Oceania Dentures Market Value (US$ Million) Analysis and Forecast 2012 to 2032, by End User

Table 42: MEA Dentures Market Value (US$ Million) Analysis 2012 to 2021 and Forecast 2022 to 2032, by Country

Table 43: MEA Dentures Market Value (US$ Million) Analysis and Forecast 2012 to 2032, by Material

Table 44: MEA Dentures Market Volume (Units) Analysis and Forecast 2012 to 2032, by Material

Table 45: MEA Dentures Market Value (US$ Million) Analysis and Forecast 2012 to 2032, by Type

Table 46: MEA Dentures Market Value (US$ Million) Analysis and Forecast 2012 to 2032, by Usage

Table 47: MEA Dentures Market Value (US$ Million) Analysis and Forecast 2012 to 2032, by End User

List of Figures

Figure 01: Global Dentures Market Volume (Units), 2012 to 2021

Figure 02: Global Dentures Market Volume (Units) & Y-o-Y Growth (%) Analysis,

Figure 03: Dentures, Pricing Analysis per unit (US$), in 2022

Figure 04: Dentures, Pricing Forecast per unit (US$), in 2032

Figure 05: Global Dentures Market Value (US$ Million) Analysis, 2012 to 2021

Figure 06: Global Dentures Market Forecast & Y-o-Y Growth, 2022 to 2032

Figure 07: Global Dentures Market Absolute $ Opportunity (US$ Million) Analysis, 2021 to 2032

Figure 08: Global Dentures Market Value Share (%) Analysis 2022 and 2032, by Material

Figure 09: Global Dentures Market Y-o-Y Growth (%) Analysis 2021 to 2032, by Material

Figure 10: Global Dentures Market Attractiveness Analysis 2022 to 2032, by Material

Figure 11: Global Dentures Market Value Share (%) Analysis 2022 and 2032, by Type

Figure 12: Global Dentures Market Y-o-Y Growth (%) Analysis 2021 to 2032, by Type

Figure 13: Global Dentures Market Attractiveness Analysis 2022 to 2032, by Type

Figure 14: Global Dentures Market Value Share (%) Analysis 2022 and 2032, by Usage

Figure 15: Global Dentures Market Y-o-Y Growth (%) Analysis 2021 to 2032, by Usage

Figure 16: Global Dentures Market Attractiveness Analysis 2022 to 2032, by Usage

Figure 17: Global Dentures Market Value Share (%) Analysis 2022 and 2032, by End User

Figure 18: Global Dentures Market Y-o-Y Growth (%) Analysis 2021 to 2032, by End User

Figure 19: Global Dentures Market Attractiveness Analysis 2022 to 2032, by End User

Figure 20: Global Dentures Market Value Share (%) Analysis 2022 and 2032, by Region

Figure 21: Global Dentures Market Y-o-Y Growth (%) Analysis 2021 to 2032, by Region

Figure 22: Global Dentures Market Attractiveness Analysis 2022 to 2032, by Region

Figure 23: North America Dentures Market Value (US$ Million) Analysis, 2012 to 2021

Figure 24: North America Dentures Market Value (US$ Million) Forecast, 2022 to 2032

Figure 25: North America Dentures Market Value Share, by Material (2022 E)

Figure 26: North America Dentures Market Value Share, by Type (2022 E)

Figure 27: North America Dentures Market Value Share, by Usage (2022 E)

Figure 28: North America Dentures Market Value Share, by End User (2022 E)

Figure 29: North America Dentures Market Value Share, by Country (2022 E)

Figure 30: North America Dentures Market Attractiveness Analysis by Material, 2022 to 2032

Figure 31: North America Dentures Market Attractiveness Analysis by Type, 2022 to 2032

Figure 32: North America Dentures Market Attractiveness Analysis by Usage, 2022 to 2032

Figure 33: North America Dentures Market Attractiveness Analysis by End User, 2022 to 2032

Figure 34: North America Dentures Market Attractiveness Analysis by Country, 2022 to 2032

Figure 35: US Dentures Market Value Proportion Analysis, 2021

Figure 36: Global Vs. The US Growth Comparison

Figure 37: US Dentures Market Share Analysis (%) by Material, 2021 to 2032

Figure 38: US Dentures Market Share Analysis (%) by Type, 2021 to 2032

Figure 39: US Dentures Market Share Analysis (%) by Usage, 2021 to 2032

Figure 40: US Dentures Market Share Analysis (%) by End User, 2021 to 2032

Figure 41: Canada Dentures Market Value Proportion Analysis, 2021

Figure 42: Global Vs. Canada. Growth Comparison

Figure 43: Canada Dentures Market Share Analysis (%) by Material, 2021 to 2032

Figure 44: Canada Dentures Market Share Analysis (%) by Type, 2021 to 2032

Figure 45: Canada Dentures Market Share Analysis (%) by Usage, 2021 to 2032

Figure 46: Canada Dentures Market Share Analysis (%) by End User, 2021 to 2032

Figure 47: Latin America Dentures Market Value (US$ Million) Analysis, 2012 to 2021

Figure 48: Latin America Dentures Market Value (US$ Million) Forecast, 2022 to 2032

Figure 49: Latin America Dentures Market Value Share, by Material (2022 E)

Figure 50: Latin America Dentures Market Value Share, by Type (2022 E)

Figure 51: Latin America Dentures Market Value Share, by Usage (2022 E)

Figure 52: Latin America Dentures Market Value Share, by End User (2022 E)

Figure 53: Latin America Dentures Market Value Share, by Country (2022 E)

Figure 54: Latin America Dentures Market Attractiveness Analysis by Material, 2022 to 2032

Figure 55: Latin America Dentures Market Attractiveness Analysis by Type, 2022 to 2032

Figure 56: Latin America Dentures Market Attractiveness Analysis by Usage, 2022 to 2032

Figure 57: Latin America Dentures Market Attractiveness Analysis by End User, 2022 to 2032

Figure 58: Latin America Dentures Market Attractiveness Analysis by Country, 2022 to 2032

Figure 59: Mexico Dentures Market Value Proportion Analysis, 2021

Figure 60: Global Vs Mexico Growth Comparison

Figure 61: Mexico Dentures Market Share Analysis (%) by Material, 2021 to 2032

Figure 62: Mexico Dentures Market Share Analysis (%) by Type, 2021 to 2032

Figure 63: Mexico Dentures Market Share Analysis (%) by Usage, 2021 to 2032

Figure 64: Mexico Dentures Market Share Analysis (%) by End User, 2021 to 2032

Figure 65: Brazil Dentures Market Value Proportion Analysis, 2021

Figure 66: Global Vs. Brazil. Growth Comparison

Figure 67: Brazil Dentures Market Share Analysis (%) by Material, 2021 to 2032

Figure 68: Brazil Dentures Market Share Analysis (%) by Type, 2021 to 2032

Figure 69: Brazil Dentures Market Share Analysis (%) by Usage, 2021 to 2032

Figure 70: Brazil Dentures Market Share Analysis (%) by End User, 2021 to 2032

Figure 71: Argentina Dentures Market Value Proportion Analysis, 2021

Figure 72: Global Vs Argentina Growth Comparison

Figure 73: Argentina Dentures Market Share Analysis (%) by Material, 2021 to 2032

Figure 74: Argentina Dentures Market Share Analysis (%) by Type, 2021 to 2032

Figure 75: Argentina Dentures Market Share Analysis (%) by Usage, 2021 to 2032

Figure 76: Argentina Dentures Market Share Analysis (%) by End User, 2021 to 2032

Figure 77: Europe Dentures Market Value (US$ Million) Analysis, 2012 to 2021

Figure 78: Europe Dentures Market Value (US$ Million) Forecast, 2022 to 2032

Figure 79: Europe Dentures Market Value Share, by Material (2022 E)

Figure 80: Europe Dentures Market Value Share, by Type (2022 E)

Figure 81: Europe Dentures Market Value Share, by Usage (2022 E)

Figure 82: Europe Dentures Market Value Share, by End User (2022 E)

Figure 83: Europe Dentures Market Value Share, by Country (2022 E)

Figure 84: Europe Dentures Market Attractiveness Analysis by Material, 2022 to 2032

Figure 85: Europe Dentures Market Attractiveness Analysis by Type, 2022 to 2032

Figure 86: Europe Dentures Market Attractiveness Analysis by Usage, 2022 to 2032

Figure 87: Europe Dentures Market Attractiveness Analysis by End User, 2022 to 2032

Figure 88: Europe Dentures Market Attractiveness Analysis by Country, 2022 to 2032

Figure 89: UK Dentures Market Value Proportion Analysis, 2021

Figure 90: Global Vs. UK Growth Comparison

Figure 91: UK Dentures Market Share Analysis (%) by Material, 2021 to 2032

Figure 92: UK Dentures Market Share Analysis (%) by Type, 2021 to 2032

Figure 93: UK Dentures Market Share Analysis (%) by Usage, 2021 to 2032

Figure 94: UK Dentures Market Share Analysis (%) by End User, 2021 to 2032

Figure 95: Germany Dentures Market Value Proportion Analysis, 2021

Figure 96: Global Vs. Germany Growth Comparison

Figure 97: Germany Dentures Market Share Analysis (%) by Material, 2021 to 2032

Figure 98: Germany Dentures Market Share Analysis (%) by Type, 2021 to 2032

Figure 99: Germany Dentures Market Share Analysis (%) by Usage, 2021 to 2032

Figure 100: Germany Dentures Market Share Analysis (%) by End User, 2021 to 2032

Figure 101: Italy Dentures Market Value Proportion Analysis, 2021

Figure 102: Global Vs. Italy Growth Comparison

Figure 103: Italy Dentures Market Share Analysis (%) by Material, 2021 to 2032

Figure 104: Italy Dentures Market Share Analysis (%) by Type, 2021 to 2032

Figure 105: Italy Dentures Market Share Analysis (%) by Usage, 2021 to 2032

Figure 106: Italy Dentures Market Share Analysis (%) by End User, 2021 to 2032

Figure 107: France Dentures Market Value Proportion Analysis, 2021

Figure 108: Global Vs France Growth Comparison

Figure 109: France Dentures Market Share Analysis (%) by Material, 2021 to 2032

Figure 110: France Dentures Market Share Analysis (%) by Type, 2021 to 2032

Figure 111: France Dentures Market Share Analysis (%) by Usage, 2021 to 2032

Figure 112: France Dentures Market Share Analysis (%) by End User, 2021 to 2032

Figure 113: Spain Dentures Market Value Proportion Analysis, 2021

Figure 114: Global Vs Spain Growth Comparison

Figure 115: Spain Dentures Market Share Analysis (%) by Material, 2021 to 2032

Figure 116: Spain Dentures Market Share Analysis (%) by Type, 2021 to 2032

Figure 117: Spain Dentures Market Share Analysis (%) by Usage, 2021 to 2032

Figure 118: Spain Dentures Market Share Analysis (%) by End User, 2021 to 2032

Figure 119: Russia Dentures Market Value Proportion Analysis, 2021

Figure 120: Global Vs Russia Growth Comparison

Figure 121: Russia Dentures Market Share Analysis (%) by Material, 2021 to 2032

Figure 122: Russia Dentures Market Share Analysis (%) by Type, 2021 to 2032

Figure 123: Russia Dentures Market Share Analysis (%) by Usage, 2021 to 2032

Figure 124: Russia Dentures Market Share Analysis (%) by End User, 2021 to 2032

Figure 125: BENELUX Dentures Market Value Proportion Analysis, 2021

Figure 126: Global Vs BENELUX Growth Comparison

Figure 127: BENELUX Dentures Market Share Analysis (%) by Material, 2021 to 2032

Figure 128: BENELUX Dentures Market Share Analysis (%) by Type, 2021 to 2032

Figure 129: BENELUX Dentures Market Share Analysis (%) by Usage, 2021 to 2032

Figure 130: BENELUX Dentures Market Share Analysis (%) by End User, 2021 to 2032

Figure 131: East Asia Dentures Market Value (US$ Million) Analysis, 2012 to 2021

Figure 132: East Asia Dentures Market Value (US$ Million) Forecast, 2022 to 2032

Figure 133: East Asia Dentures Market Value Share, by Material (2022 E)

Figure 134: East Asia Dentures Market Value Share, by Type (2022 E)

Figure 135: East Asia Dentures Market Value Share, by Usage (2022 E)

Figure 136: East Asia Dentures Market Value Share, by End User (2022 E)

Figure 137: East Asia Dentures Market Value Share, by Country (2022 E)

Figure 138: East Asia Dentures Market Attractiveness Analysis by Material, 2022 to 2032

Figure 139: East Asia Dentures Market Attractiveness Analysis by Type, 2022 to 2032

Figure 140: East Asia Dentures Market Attractiveness Analysis by Usage, 2022 to 2032

Figure 141: East Asia Dentures Market Attractiveness Analysis by End User, 2022 to 2032

Figure 142: East Asia Dentures Market Attractiveness Analysis by Country, 2022 to 2032

Figure 143: China Dentures Market Value Proportion Analysis, 2021

Figure 144: Global Vs. China Growth Comparison

Figure 145: China Dentures Market Share Analysis (%) by Material, 2021 to 2032

Figure 146: China Dentures Market Share Analysis (%) by Type, 2021 to 2032

Figure 147: China Dentures Market Share Analysis (%) by Usage, 2021 to 2032

Figure 148: China Dentures Market Share Analysis (%) by End User, 2021 to 2032

Figure 149: Japan Dentures Market Value Proportion Analysis, 2021

Figure 150: Global Vs. Japan Growth Comparison

Figure 151: Japan Dentures Market Share Analysis (%) by Material, 2021 to 2032

Figure 152: Japan Dentures Market Share Analysis (%) by Type, 2021 to 2032

Figure 153: Japan Dentures Market Share Analysis (%) by Usage, 2021 to 2032

Figure 154: Japan Dentures Market Share Analysis (%) by End User, 2021 to 2032

Figure 155: South Korea Dentures Market Value Proportion Analysis, 2021

Figure 156: Global Vs South Korea Growth Comparison

Figure 157: South Korea Dentures Market Share Analysis (%) by Material, 2021 to 2032

Figure 158: South Korea Dentures Market Share Analysis (%) by Type, 2021 to 2032

Figure 159: South Korea Dentures Market Share Analysis (%) by Usage, 2021 to 2032

Figure 160: South Korea Dentures Market Share Analysis (%) by End User, 2021 to 2032

Figure 161: South Asia Dentures Market Value (US$ Million) Analysis, 2012 to 2021

Figure 162: South Asia Dentures Market Value (US$ Million) Forecast, 2022 to 2032

Figure 163: South Asia Dentures Market Value Share, by Material (2022 E)

Figure 164: South Asia Dentures Market Value Share, by Type (2022 E)

Figure 165: South Asia Dentures Market Value Share, by Usage (2022 E)

Figure 166: South Asia Dentures Market Value Share, by End User (2022 E)

Figure 167: South Asia Dentures Market Value Share, by Country (2022 E)

Figure 168: South Asia Dentures Market Attractiveness Analysis by Material, 2022 to 2032

Figure 169: South Asia Dentures Market Attractiveness Analysis by Type, 2022 to 2032

Figure 170: South Asia Dentures Market Attractiveness Analysis by Usage, 2022 to 2032

Figure 171: South Asia Dentures Market Attractiveness Analysis by End User, 2022 to 2032

Figure 172: South Asia Dentures Market Attractiveness Analysis by Country, 2022 to 2032

Figure 173: India Dentures Market Value Proportion Analysis, 2021

Figure 174: Global Vs. India Growth Comparison

Figure 175: India Dentures Market Share Analysis (%) by Material, 2021 to 2032

Figure 176: India Dentures Market Share Analysis (%) by Type, 2021 to 2032

Figure 177: India Dentures Market Share Analysis (%) by Usage, 2021 to 2032

Figure 178: India Dentures Market Share Analysis (%) by End User, 2021 to 2032

Figure 179: Indonesia Dentures Market Value Proportion Analysis, 2021

Figure 180: Global Vs. Indonesia Growth Comparison

Figure 181: Indonesia Dentures Market Share Analysis (%) by Material, 2021 to 2032

Figure 182: Indonesia Dentures Market Share Analysis (%) by Type, 2021 to 2032

Figure 183: Indonesia Dentures Market Share Analysis (%) by Usage, 2021 to 2032

Figure 184: Indonesia Dentures Market Share Analysis (%) by End User, 2021 to 2032

Figure 185: Malaysia Dentures Market Value Proportion Analysis, 2021

Figure 186: Global Vs. Malaysia Growth Comparison

Figure 187: Malaysia Dentures Market Share Analysis (%) by Material, 2021 to 2032

Figure 188: Malaysia Dentures Market Share Analysis (%) by Type, 2021 to 2032

Figure 189: Malaysia Dentures Market Share Analysis (%) by Usage, 2021 to 2032

Figure 190: Malaysia Dentures Market Share Analysis (%) by End User, 2021 to 2032

Figure 191: Thailand Dentures Market Value Proportion Analysis, 2021

Figure 192: Global Vs. Thailand Growth Comparison

Figure 193: Thailand Dentures Market Share Analysis (%) by Material, 2021 to 2032

Figure 194: Thailand Dentures Market Share Analysis (%) by Type, 2021 to 2032

Figure 195: Thailand Dentures Market Share Analysis (%) by Usage, 2021 to 2032

Figure 196: Thailand Dentures Market Share Analysis (%) by End User, 2021 to 2032

Figure 197: Oceania Dentures Market Value (US$ Million) Analysis, 2012 to 2021

Figure 198: Oceania Dentures Market Value (US$ Million) Forecast, 2022 to 2032

Figure 199: Oceania Dentures Market Value Share, by Material (2022 E)

Figure 200: Oceania Dentures Market Value Share, by Type (2022 E)

Figure 201: Oceania Dentures Market Value Share, by Usage (2022 E)

Figure 202: Oceania Dentures Market Value Share, by End User (2022 E)

Figure 203: Oceania Dentures Market Value Share, by Country (2022 E)

Figure 204: Oceania Dentures Market Attractiveness Analysis by Material, 2022 to 2032

Figure 205: Oceania Dentures Market Attractiveness Analysis by Type, 2022 to 2032

Figure 206: Oceania Dentures Market Attractiveness Analysis by Usage, 2022 to 2032

Figure 207: Oceania Dentures Market Attractiveness Analysis by End User, 2022 to 2032

Figure 208: Oceania Dentures Market Attractiveness Analysis by Country, 2022 to 2032

Figure 209: Australia Dentures Market Value Proportion Analysis, 2021

Figure 210: Global Vs. Australia Growth Comparison

Figure 211: Australia Dentures Market Share Analysis (%) by Material, 2021 to 2032

Figure 212: Australia Dentures Market Share Analysis (%) by Type, 2021 to 2032

Figure 213: Australia Dentures Market Share Analysis (%) by Usage, 2021 to 2032

Figure 214: Australia Dentures Market Share Analysis (%) by End User, 2021 to 2032

Figure 215: New Zealand Dentures Market Value Proportion Analysis, 2021

Figure 216: Global Vs New Zealand Growth Comparison

Figure 217: New Zealand Dentures Market Share Analysis (%) by Material, 2021 to 2032

Figure 218: New Zealand Dentures Market Share Analysis (%) by Type, 2021 to 2032

Figure 219: New Zealand Dentures Market Share Analysis (%) by Usage, 2021 to 2032

Figure 220: New Zealand Dentures Market Share Analysis (%) by End User, 2021 to 2032

Figure 221: Middle East & Africa Dentures Market Value (US$ Million) Analysis, 2012 to 2021

Figure 222: Middle East & Africa Dentures Market Value (US$ Million) Forecast, 2022 to 2032

Figure 223: Middle East & Africa Dentures Market Value Share, by Material (2022 E)

Figure 224: Middle East & Africa Dentures Market Value Share, by Type (2022 E)

Figure 225: Middle East & Africa Dentures Market Value Share, by Usage (2022 E)

Figure 226: Middle East & Africa Dentures Market Value Share, by End User (2022 E)

Figure 227: Middle East & Africa Dentures Market Value Share, by Country (2022 E)

Figure 228: Middle East & Africa Dentures Market Attractiveness Analysis by Material, 2022 to 2032

Figure 229: Middle East & Africa Dentures Market Attractiveness Analysis by Type, 2022 to 2032

Figure 230: Middle East & Africa Dentures Market Attractiveness Analysis by Usage, 2022 to 2032

Figure 231: Middle East & Africa Dentures Market Attractiveness Analysis by End User, 2022 to 2032

Figure 232: Middle East & Africa Dentures Market Attractiveness Analysis by Country, 2022 to 2032

Figure 233: GCC Countries Dentures Market Value Proportion Analysis, 2021

Figure 234: Global Vs GCC Countries Growth Comparison

Figure 235: GCC Countries Dentures Market Share Analysis (%) by Material, 2021 to 2032

Figure 236: GCC Countries Dentures Market Share Analysis (%) by Type, 2021 to 2032

Figure 237: GCC Countries Dentures Market Share Analysis (%) by Usage, 2021 to 2032

Figure 238: GCC Countries Dentures Market Share Analysis (%) by End User, 2021 to 2032

Figure 239: Turkey Dentures Market Value Proportion Analysis, 2021

Figure 240: Global Vs. Turkey Growth Comparison

Figure 241: Turkey Dentures Market Share Analysis (%) by Material, 2021 to 2032

Figure 242: Turkey Dentures Market Share Analysis (%) by Type, 2021 to 2032

Figure 243: Turkey Dentures Market Share Analysis (%) by Usage, 2021 to 2032

Figure 244: Turkey Dentures Market Share Analysis (%) by End User, 2021 to 2032

Figure 245: South Africa Dentures Market Value Proportion Analysis, 2021

Figure 246: Global Vs. South Africa Growth Comparison

Figure 247: South Africa Dentures Market Share Analysis (%) by Material, 2021 to 2032

Figure 248: South Africa Dentures Market Share Analysis (%) by Type, 2021 to 2032

Figure 249: South Africa Dentures Market Share Analysis (%) by Usage, 2021 to 2032

Figure 250: South Africa Dentures Market Share Analysis (%) by End User, 2021 to 2032

Figure 251: North Africa Dentures Market Value Proportion Analysis, 2021

Figure 252: Global Vs North Africa Growth Comparison

Figure 253: North Africa Dentures Market Share Analysis (%) by Material, 2021 to 2032

Figure 254: North Africa Dentures Market Share Analysis (%) by Type, 2021 to 2032

Figure 255: North Africa Dentures Market Share Analysis (%) by Usage, 2021 to 2032

Figure 256: North Africa Dentures Market Share Analysis (%) by End User, 2021 to 2032

Frequently Asked Questions

How much is the dentures market currently worth?

The global dentures market is worth USD 1.6 Billion at present (2021), and is set to expand 1.9X over the next ten years.

What is the sales forecast for dentures through 2032?

The dentures market is expected to reach USD 3.2 Billion by end of 2032 at a CAGR of 6.7%.

What are the trends driving the demand outlook of the global dentures market?

The growing geriatric population, rising burden of periodontal diseases, and growing awareness regarding dental aesthetics are some of the key trends in this market.

Which region has the highest market share in the global dentures market?

By region, North America holds the highest market share of around 39.8% by value, in 2021, in the global dentures market.

How likely is the dentures market to grow in Europe?

Europe accounts for about 29.7% of the global dentures market in 2021 and is projected to grow with a CAGR of 6.5% during the forecast period.

Which are the top five countries driving demand for the dentures market?

The US, China, Japan, India, and Germany are the top five countries, which are expected to drive demand in the dentures market.

Who are the key manufacturers in the dentures market?

DENTSPLY SIRONA Inc., COLTENE Holding AG, GC dental, Amann Girrbach AG, Ivoclar Vivadent AG, Zimmer Biomet Holdings Inc., Mitsui Chemicals Inc., Keystone Dental, Inc., Align Technology, Inc., and VOCO GmbH, are some of the key players in the dentures industry.

What was the last 9 years’ CAGR value growth for the dentures market?

From 2012 to 2021, the market for dentures expanded at the rate of 5.0% CAGR.

What are the key market statistics for South Asia in the dentures market?

South Asia accounted for 9.3% market share by value in 2021. The dentures market in South Asia is expected to grow at 7.6% CAGR during the forecast period.

What is the outlook of East Asia in the dentures market?

East Asia displays a market share value of about 13.2% in 2021 and is set to present lucrative growth at a CAGR of 8.0% during the forecasted years.

Explore Similar Insights

Future Market Insights

Dentures Market