The e-rickshaw market is undergoing rapid expansion, fueled by growing urbanization, rising demand for cost-effective short-distance transport, and supportive government policies promoting electric mobility. National electric vehicle policies and local transport reforms have accelerated the replacement of conventional auto-rickshaws with battery-operated alternatives.
State-level subsidies, exemption from road taxes, and dedicated EV infrastructure development have further incentivized both manufacturers and consumers. Press releases and government updates have highlighted increased public-private collaborations aimed at expanding charging networks and streamlining vehicle financing schemes, improving the affordability and adoption of e-rickshaws.
Moreover, advancements in battery technologies and motor efficiency have extended vehicle range and performance, increasing the utility of e-rickshaws in urban and semi-urban transit. The market outlook remains optimistic as regional transport authorities continue to implement clean energy mandates and as shared mobility platforms integrate e-rickshaws into their fleets. Segmental growth is expected to be led by Passenger Carrier vehicles, >101 Ah battery capacity, and 1,000 to 1,500 W motor power due to their higher utility, performance, and payload efficiency.
| Metric | Value |
|---|---|
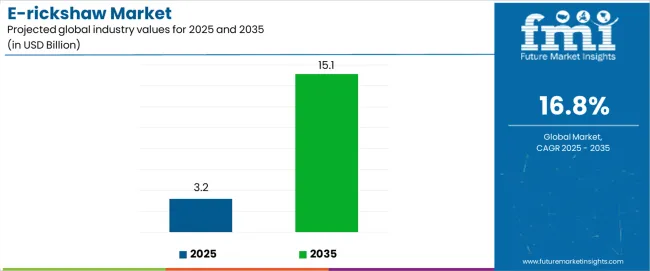
| E-rickshaw Market Estimated Value in (2025 E) | USD 3.2 billion |
| E-rickshaw Market Forecast Value in (2035 F) | USD 15.1 billion |
| Forecast CAGR (2025 to 2035) | 16.8% |
The market is segmented by Vehicle Type, Battery Capacity, Motor Power, and End-User and region. By Vehicle Type, the market is divided into Passenger Carrier and Load Carrier. In terms of Battery Capacity, the market is classified into >101 Ah and <101 Ah. Based on Motor Power, the market is segmented into 1,000 To 1,500 W, Up To 1,000 W, and More Than 1,500 W. By End-User, the market is divided into Original Equipment Manufacturer and Aftermarket. Regionally, the market is classified into North America, Latin America, Western Europe, Eastern Europe, Balkan & Baltic Countries, Russia & Belarus, Central Asia, East Asia, South Asia & Pacific, and the Middle East & Africa.
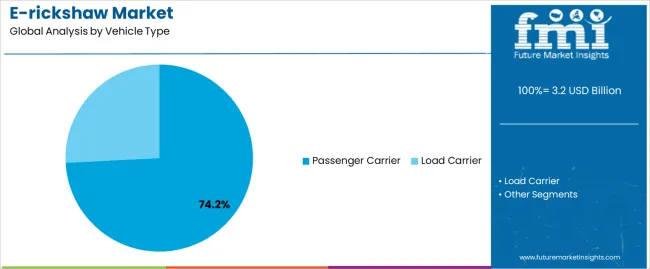
The Passenger Carrier segment is projected to contribute 74.2% of the e-rickshaw market revenue in 2025, securing its position as the leading vehicle type. Growth of this segment has been driven by the demand for affordable, last-mile transport solutions across urban and rural areas.
Passenger e-rickshaws have been widely adopted for public transportation due to their low operating cost, compact size, and ability to navigate congested routes. Transport department records and fleet operator reports have shown a steady rise in daily ridership and route penetration, especially in areas underserved by formal public transit.
In addition, government schemes promoting employment and self-sustaining mobility businesses have made passenger e-rickshaws a popular entrepreneurial option. As cities continue to invest in electric mobility and micro-transit networks, the Passenger Carrier segment is expected to remain dominant, benefiting from strong demand, regulatory support, and growing consumer trust in electric public transport options.
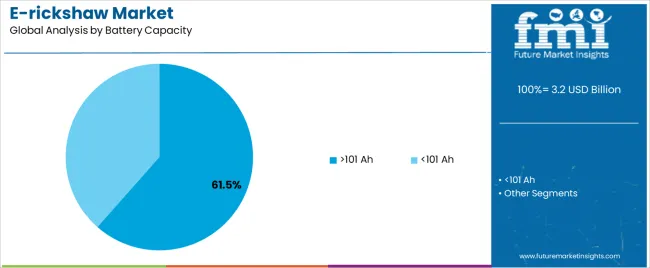
The >101 Ah segment is projected to account for 61.5% of the e-rickshaw market revenue in 2025, maintaining its leadership in battery capacity classification. This dominance has been attributed to the extended operational range and higher load-bearing capacity offered by high-capacity batteries.
E-rickshaws equipped with >101 Ah batteries have been preferred by drivers and fleet owners seeking longer daily usage with minimal charging downtime. Battery manufacturer announcements and energy storage studies have confirmed increased adoption of lithium-ion and advanced lead-acid battery technologies in this capacity range, enhancing overall performance, charging efficiency, and lifecycle cost-effectiveness.
Moreover, route operators and transport cooperatives have favored >101 Ah battery packs for their ability to support full-day operations without the need for intermediate charging. As government programs continue to support the adoption of high-efficiency electric vehicle batteries, the >101 Ah segment is expected to maintain strong market momentum.
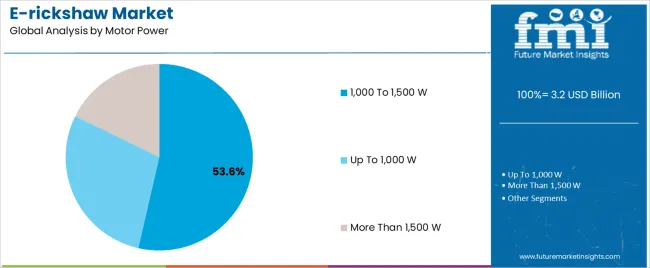
The 1,000 to 1,500 W segment is projected to contribute 53.6% of the e-rickshaw market revenue in 2025, positioning it as the leading motor power category. Growth of this segment has been supported by the optimal balance it offers between performance, energy consumption, and cost.
Motors within this power range have been widely adopted across commercial passenger e-rickshaws due to their ability to handle typical urban and peri-urban gradients and load requirements efficiently. Industry feedback and technical specifications released by manufacturers have indicated that these motors provide sufficient torque and acceleration while maintaining energy efficiency, making them ideal for densely populated transport routes.
Furthermore, 1,000 to 1,500 W motors have aligned well with current battery capacities and charging standards, allowing seamless integration into existing e-rickshaw platforms. As the market matures and operational expectations increase, this motor power segment is expected to retain its leadership based on its proven compatibility with daily mobility needs and infrastructure readiness.
The table below presents the expected CAGR for the global sector over several semi-annual periods spanning from 2025 to 2035. In the first half (H1) of the decade from 2025 to 2035, the business is predicted to surge at a CAGR of 31.5%, followed by a slightly higher growth rate of 31.8% in the second half (H2) of the same decade.
| Particular | Value CAGR |
|---|---|
| H1 | 31.5% (2025 to 2035) |
| H2 | 31.8% (2025 to 2035) |
| H1 | 31.4% (2025 to 2035) |
| H2 | 32.1% (2025 to 2035) |
Moving into the subsequent period, from H1 2025 to H2 2035, the CAGR is projected to decline slightly to 31.4% in the first half and remain relatively moderate at 32.1% in the second half.
The Use of E-rickshaws for Tourism Purposes to Bolster Demand
A prominent reason for the use of e-rickshaws for tourism purposes is due to eco-friendly nature that has zero tailpipe emissions. This makes these ideal for use, especially in areas that prioritize preserving the environment.
Electric rickshaws are compact and can thus navigate narrow streets and alleyways that are inaccessible to large vehicles. These allow tourists to explore hidden gems and local neighborhoods. E-rickshaws are cost-effective and provide flexibility while sightseeing. The only drawback of electric auto-rickshaws for use in tourism is the limited range.
The Role of E-rickshaws in Last-mile Connectivity
Electric rickshaws play a crucial role in providing last-mile connectivity in developing nations and urban regions where traditional transport systems like buses and metros don’t reach every corner of the city. However, electric rickshaws, with compact size, can navigate through every nook. The rides are cheaper, making these an affordable last-mile solution.
Electric rickshaws are able to operate in areas that restrict traditional rickshaws or taxi services, thereby readily catering to the transportation requirements of local communities.
Being ideal for short-distance travel within cities and providing door-to-door service, these provide flexibility and convenience to passengers, thereby making the role of e-rickshaws in last-mile connectivity more impactful.
The Impact of Battery Swapping Technology on E-rickshaw Profitability
Charging the battery of an electric rickshaw can take several hours. With battery-swapping technology, drivers don’t have to wait for the electric rickshaw battery to get fully charged. They can simply swap the existing depleted battery with a fully charged one within minutes. This maximized the operational time as well as the earning potential of electric rickshaws.
Battery swapping enables drivers to extend the battery range of electric auto-rickshaws beyond the limitation of a single battery. This also makes it possible to cover long routes and complete multiple trips without recharging.
Battery swapping stations utilize standardized batteries, eliminating all compatibility concerns. These can also handle battery maintenance and charging efficiently, thereby reducing wear and tear on personal batteries.
The availability of such e-rickshaw battery-swapping infrastructure reduces the charging cost for drivers as they won’t have to invest in charging stations at home or rely on public charging points.
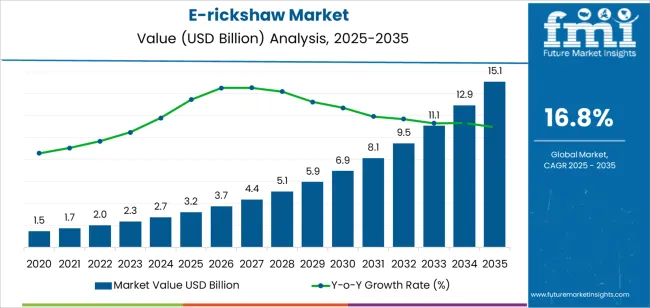
The global e-rickshaw market size was valued at USD 1.5 million in 2020. The industry grew at a CAGR of 9.2% through the historical period of 2020 to 2025, reaching a size of USD 3.2 million by 2025. This growth was driven by the rapidly increasing fuel prices of conventional fuels and gases such as diesel and CNG.
Electric rickshaws are an eco-friendly alternative to conventional rickshaws that are powered by fuel and gases, contributing to reduced air pollution in urban areas. Accelerated urbanization in developing countries has created a surging demand for affordable and efficient transport solutions, particularly for last-mile connectivity and short-distance travel.
Governments, particularly in Asian countries, have implemented various policies promoting the adoption of electric rickshaws. This is done by providing incentives, subsidies, tax breaks, or regulations on traditional rickshaws.
The electric rickshaw sector has witnessed robust growth in recent years and will continue rising with this momentum, thereby securing the future of e-rickshaws. The electric rickshaw industry is estimated to reach USD 3.2 million in 2025.
The industry is anticipated to further grow at a CAGR of 31.8% during the forecast period of 2025 to 2035. The sector is forecast to reach a value of USD 15.1 million by 2035. A prominent factor behind this growth is the decreasing battery prices for EVs.
The upfront cost of an electric rickshaw is lower compared to the price of traditional rickshaws. This is attributed to the constant technological innovations in the EV sector. Rising environmental concerns and demand for sustainable solutions for commute have led to a surge in the adoption of electric rickshaws.
Industry reports on the e-rickshaw market assure of continuous growth of the sector in coming years. With key players investing in the research and development of novel technologies for the EV sector, consumers are projected to have cost-competitive, sustainable, and speedy options in the electric vehicle industry.
Tier 1 companies in the electric tuk-tuk sector include Mahindra Electric Mobility Limited, Saera Electric Auto Pvt. Ltd., and Telco E-Vehicles Pvt. Ltd. These companies aim to launch new electronic rickshaws with innovative features and enhanced battery life to gain a significant portion of the global sector.
Mahindra Electric, for instance, joined hands with Reva Electricals to form a new company named Mahindra Reva Electricals, which was later rebranded to Mahindra Electric Mobility. Tier 1 players together hold around 45% of share worldwide.
Mid-sized companies or Tier 2 players in the sector include How Care Products Pvt. Ltd., Charuvikram Automobiles Pvt. Ltd., A G International Pvt. Ltd., Xuzhou Hongsengmeng Group Co., Ltd., Wuxi Weiyun Motor Co. Ltd., and Wuxi Berang International Trading Co., Ltd. These companies currently hold about 30% of share.
Tianjin Xingangyun Technology Co., Ltd. has a wide network across North America, Oceania, South America, Southeast Asia, and Eastern Europe. The firm specializes in offering electrical tricycles and spare parts. Anhui Zhengmin Vehicle Industry Co., Ltd., on the other hand, follows stringent quality control procedures and embraces unique production equipment.
Local or Tier 3 companies in the market include Gauri Auto India Pvt. Ltd., Yuva E Rickshaw, and Charuvikram Automobiles Pvt. Ltd. Gauri Auto India Pvt. Ltd., for instance, offers high-quality e-scooters, e-loaders, and e-auto rickshaws.
Few of the key features of the company’s rickshaw include central and steering lock, embedded tool kit, ball guard, and powerful chassis. All the Tier 3 player, together, hold around 25% of share.
The following section provides details regarding the dominant countries in the electric auto-rickshaw industry. The section provides information regarding anticipated e-rickshaw market share by region.
It also evaluates e-rickshaw sales trends in leading countries and future opportunities. These details will help companies identify the prominent regions for industry growth and invest accordingly.
India and China are estimated to emerge as the dominant countries in the electric rickshaw sector during the assessment period of 2025 to 2035. Spain, France, and Italy are following closely behind with a promising growth rate of 23.9%, 22.3%, and 20.7%, respectively.
The electric rickshaw sector is experiencing robust growth. This growth is attributed to various factors such as rising demand for sustainable options, government policies promoting e-rickshaw adoption, demand for cost-effective transport solutions, and regulations on e-rickshaw operation, licensing, and safety standards.
| Countries | CAGR 2025 to 2035 |
|---|---|
| France | 22.3% |
| Spain | 23.9% |
| China | 35.6% |
| Italy | 20.7% |
| India | 47.4% |
India is a fast-growing EV industry, attributed to rapid urbanization and last-mile connectivity. The country has a growing demand for affordable, flexible, and efficient transport solutions, and electric rickshaws perfectly fit this need.
India is the ideal sector for leading e-rickshaw manufacturers and consumers owing to the favorable production environment and market dynamics of the country. Rising fuel costs are anticipated to lead to a high demand for electric rickshaws, as these provide a cost-effective and sustainable alternative compared to traditional rickshaws.
India has a well-established automotive industry with a strong network of manufacturers. This existing infrastructure can be easily adapted for electric auto-rickshaw production. The country has relatively low labor costs that facilitate the production of cost-competitive electric auto-rickshaws. Government policies promoting e-rickshaw adoption are also prominent for industry growth.
China is a strong contender for having a dominant e-rickshaw market share in Asia Pacific by region. The country’s established production base and massive manufacturing infrastructure for EVs allow for large-scale production of electric rickshaws, potentially lowering costs compared to other countries.
A robust supply chain for EV components like batteries, motors, and controllers enables quick production and additional e-rickshaw manufacturing opportunities.
Chinese automotive manufacturers are known for actively investing in research and development, leading to advanced battery technologies and motor efficiency. The country is prominently focused on the export of electric auto-rickshaws in countries. Government policies promoting electric vehicles (EVs) and clean transportation are incentivizing e-rickshaw adoption across the country.
E-rickshaw technology advancements are driving demand for electric rickshaws in Spain. These are primarily being used for tourist experiences and rental options. Declining battery prices have made electric rickshaws more affordable. These are the backbone of last-mile mobility, perfectly fitting Spain’s travel requirements.
Tourists are looking for cost-effective and flexible solutions. Electric rickshaw are not only affordable and flexible, but the compact nature enables these to reach every corner. Tourist destinations having regulations on the use of traditional vehicles can be easily reached by an electric rickshaw owing to high sustainable footprint.
The below section provides information related to the leading segments in the battery rickshaw industry. It holds details of the anticipated growth rates that will assist businesses in identifying the dominating sectors and investing accordingly.
Based on vehicle type, passenger carriers are leading with a value share of 64.4% in 2025. By motor power, the 1,000 to 1,500 W category is dominating the industry with a share of 57.4% in 2025.
| Segment | Passenger Carrier (Vehicle Type) |
|---|---|
| Value Share (2025) | 64.4% |
Passengers are looking for individual, convenient, and economical travel options for short trips. Passenger carrier e-three-wheelers perfectly fit into this demand.
E-passenger carriers are less expensive to maintain and operate compared to conventional fuel-powered vehicles. Manufacturers offer a wide variety of passenger carrier models that cater to different passenger capacities and comfort levels.
E-carriers have higher earning potential and lower operational costs compared to cargo e-three-wheelers. Manufacturers are increasingly investing in the design and development of cost-effective and efficient e-three-wheelers. This will be beneficial for companies, consumers as well as passengers, thereby boosting growth.
| Segment | 1,000 to 1,500 W (Motor Power) |
|---|---|
| Value Share (2025) | 57.4% |
Motor powers in the range of 1000 to 1500 W are gaining prominence as these are able to achieve good performance while maintaining reasonable battery consumption.
This enables long-range travel on a single charge. High-powered motors facilitate fast speeds but also increase risks, thereby raising safety concerns. Electric rickshaws with moderate power prioritize safe operations in the urban speed limits.
Several regions have restrictions on maximum motor power allowed for electric auto-rickshaws. The 1000 to 1500 W motor power ranges fall within the regulatory limits, ensuring compliance.
This motor range offers a good balance between performance, efficiency, affordability, and safety. These features are making the motor power the most suitable option for most of the electric auto-rickshaw sector, especially in developing countries.
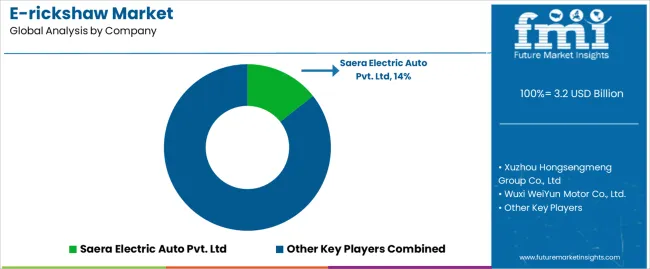
Ongoing growth in the electric rickshaw sector will drive competition between manufacturers. Key players in the industry will be required to focus on offering cost-effective models, catering to price-sensitive consumers from developing countries.
New technological innovations in the sector are set to bring a competitive edge. Manufacturers who offer a good battery range and efficiency, e-rickshaw battery swapping infrastructure, and integration of features such as GPS tracking, infotainment systems, or digital payments will see a rise in sales.
Factors influencing competition in the e-rickshaw market are pricing pressure and industry consolidation. The competitive landscape of the e-rickshaw market will most likely lower the prices of the product. This will likely benefit consumers but might cause a deficit for manufacturers, potentially pressurizing profit margins.
The strategy is also projected to pave the way for new innovations, making electric rickshaws more efficient, user-friendly, and rich in features. With such intense competition, the electric auto-rickshaw sector will experience consolidation, with only the leading players dominating the industry.
Industry Updates
By vehicle type, the sector is divided into passenger carriers and load carriers.
Based on battery capacity, the industry is segmented into >101 Ah and <101 Ah.
By motor power, the industry is divided into up to 1,000 W, 1,000 to 1,500 W, and more than 1,500 W.
Based on end-users, the sector is segmented into original equipment manufacturers and aftermarket.
By region, the e-rickshaw industry is spread across North America, Western Europe, Eastern Europe, the Middle East, Africa, ASEAN, South Asia, Australia, Asia, and New Zealand.
The global e-rickshaw market is estimated to be valued at USD 3.2 billion in 2025.
The market size for the e-rickshaw market is projected to reach USD 15.1 billion by 2035.
The e-rickshaw market is expected to grow at a 16.8% CAGR between 2025 and 2035.
The key product types in e-rickshaw market are passenger carrier and load carrier.
In terms of battery capacity, >101 ah segment to command 61.5% share in the e-rickshaw market in 2025.


Full Research Suite comprises of:
Market outlook & trends analysis
Interviews & case studies
Strategic recommendations
Vendor profiles & capabilities analysis
5-year forecasts
8 regions and 60+ country-level data splits
Market segment data splits
12 months of continuous data updates
DELIVERED AS:
PDF EXCEL ONLINE

Thank you!
You will receive an email from our Business Development Manager. Please be sure to check your SPAM/JUNK folder too.
Chat With
MaRIA