The E-scooter Sharing Market is estimated to be valued at USD 1.8 billion in 2025 and is projected to reach USD 9.4 billion by 2035, registering a compound annual growth rate (CAGR) of 17.9% over the forecast period.
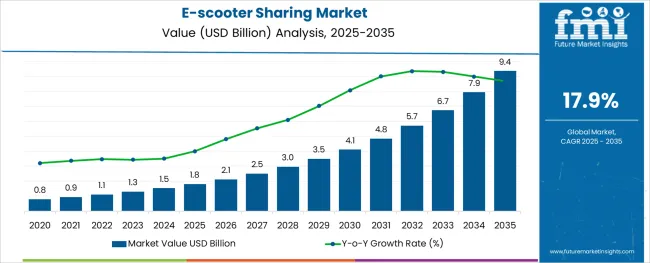
The e-scooter sharing market is expanding rapidly as urban centers seek sustainable and efficient micro-mobility solutions. The growing focus on reducing traffic congestion and lowering carbon emissions has driven cities to integrate shared electric scooters into their public transport networks. Consumer preference for convenient and affordable last-mile transportation has further accelerated adoption.
Investments in digital platforms that enable easy scooter access and payment have enhanced user experience. Regulatory frameworks have gradually evolved to accommodate shared mobility services, balancing safety with innovation.
Additionally, the rise in environmentally conscious commuting has favored electric scooters over traditional gasoline-powered vehicles. The future outlook remains positive with ongoing expansions into new cities and improvements in battery technology and scooter durability. Segmental growth is expected to be driven by the Free-Floating model type, which offers flexible usage, and Kick Scooters, preferred for their lightweight design and ease of use.
The market is segmented by Type and Scooter Type and region. By Type, the market is divided into Free-Floating and Station-Bound. In terms of Scooter Type, the market is classified into Kick scooters and Smart scooters. Regionally, the market is classified into North America, Latin America, Western Europe, Eastern Europe, Balkan & Baltic Countries, Russia & Belarus, Central Asia, East Asia, South Asia & Pacific, and the Middle East & Africa.
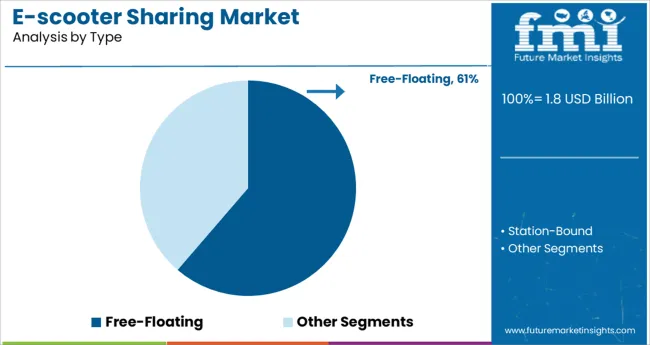
The Free-Floating segment is projected to hold 61.3% of the e-scooter sharing market revenue in 2025, maintaining its dominance in the market. The free-floating model allows users to pick up and drop off scooters anywhere within a designated service area, providing unmatched flexibility and convenience.
This system supports spontaneous, short-distance trips and adapts well to varying urban layouts. Operators benefit from reduced infrastructure costs since docking stations are not required.
The scalability of free-floating fleets and user-friendly app interfaces have further propelled growth. Additionally, the model aligns with shifting consumer behaviors that favor on-demand mobility over fixed-route transportation options. As cities expand their shared mobility frameworks, the free-floating model is expected to retain its leadership.
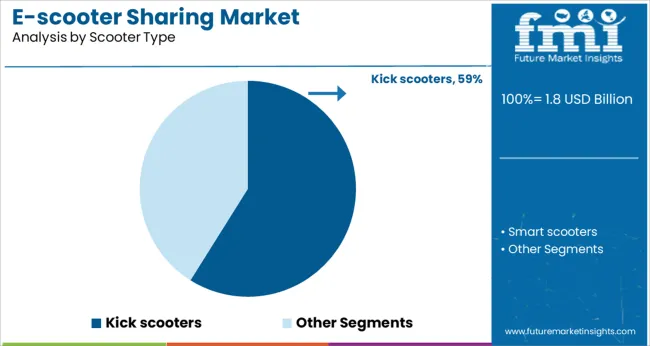
The Kick Scooters segment is expected to contribute 58.9% of the market revenue in 2025, establishing it as the leading scooter type. Kick scooters are favored for their lightweight build, simplicity, and ease of maneuvering, making them accessible to a broad demographic including casual riders and commuters.
Their compact size enables convenient storage and portability, enhancing user appeal. Advances in scooter design have improved safety features and battery efficiency, supporting longer rides and increased durability.
Kick scooters also offer lower maintenance costs compared to other electric mobility devices, appealing to operators managing large shared fleets. With ongoing urbanization and a push for active transportation modes, the kick scooter segment is anticipated to remain dominant in the e-scooter sharing market.
The global market for E-scooter sharing raised to 18.8% CAGR over the last five years (2020 to 2024). The market growth is forecasted to reach USD 9.4 Bn in the coming ten years.
In 2024, the global market size for E scooter sharing was valued at USD 1.8 Mn and is expected to increase to a valuation of USD 1.1 Bn in 2025. This is due to the increasing demand for shared micro-mobility. The favorable cost structure, flexibility, and user-friendly characteristics are some of the factors that contribute to the growth of the E-scooter-sharing market. E-scooters are small in size and consume less space for parking, hence, the E-scooter sharing providers and governments are encouraging travellers to use E-scooter sharing. Most of the service providers provide free-floating services in which the customers need to pick up and return the scooters to specific locations.
Millennials currently are the prominent end-users of E-scooter sharing owing to their growing spending power. With the surge in worldwide urbanization, people from other age groups will also start to use E-scooter sharing to make the demand more mainstream.
The global E-scooter-sharing market is predicted to surge ahead at a CAGR of 17.9% and sales worth USD 9.4 Bn by the end of 2035. he USA will continue to be the largest user of E scooter sharing throughout the analysis period accounting for over USD 1.5 Bn absolute dollar opportunity in the coming 10 years.
Since E-scooter sharing engages only half of the space of a pedestrian, it becomes more space-effective. Since e-scooter sharing is more feasible during peak hours, if more people use them the number of vehicles plying on the roads will decrease thereby reducing traffic congestion. In the USA, nearly 46% of all vehicle traffic congestion is caused by driving within a 0-3 miles radius and 60% of the car trips are micro-mobility. If people substitute their trips for micro-mobility with E-scooter sharing, it will reduce the traffic congestion in the cities.
“E-scooter sharing a good substitute over public transport for short-term distance”
E-scooter sharing is more eco-friendly as compared to cars. Commuters in several Tier 2 cities are becoming more eco-conscious and they are inclined to use E-scooter sharing. Besides, their affordability against personal vehicles further makes them sought-after service. In the US, it only cost USD 1 to unlock and thereafter USD 0.15 per minute pricing structure by Bird and Lime.
Most companies in the E-scooter sharing market provide an app-based system. During 2020 to 2020 the monthly installation of e-scooter sharing apps from both Bird and Lime combined, increased by 580%. Most of the apps provide services like users can book their E-scooter from a different place and can start the ride at another place. These apps also include a GPS system through which the riders can understand if there are any allotted ways in the area in which they travel.
The GPS also helps them to find parking spots. In Lime E-scooters, there is a QR code on the handle and users can scan the QR code through the scanner in their phone to unlock and lock the E-scooter. Also, these QR codes are also used for payment options.
Most E-scooter sharing provides rental or purchasing options. While most of the companies offer rental services as they charge users per minute. These hassle-free options make access to E-scooter sharing easy for the riders.
E-scooter sharing has gained significant attention all over the globe. However, governments across the world are formulating policies around it. The UK government is planning to legalize riding privately owned E-scooters. Of this, many riders will buy their own E-scooters, which will reduce the demand for E-scooter sharing.
In Atlanta, USA, the government banned riding E-scooters during nighttime as a string of deaths was reported in the summer. In North Carolina, the government tried to overcome the situation with the help of companies by installing a GPS system in the scooter so that they cannot block the pedestrian walkway. These strict regulations will alert the users to use the E-scooter sharing properly, or else the government will be forced to ban the E-scooters from the street which will hold back the E-scooter sharing market as the ridership rates per city fall drastically.
In Madrid, Spain, the providers must acquire a license to operate in specified areas and they have to provide usage data to the government. Besides, several governments are planning to legalize the usage of helmets while riding and also to license the E-scooter used for E-scooter sharing.
The Chinese government is planning to invest more than USD2 Bn for the development of charging infrastructure for e-scooters. This will promote the growth of the E-scooter sharing market.
An average E-scooter has a life span of three months. Since they are used for rental purposes, the rough handling and heavy usage have cut down their durability. Even without adding overhead expenses and not counting marketing, it would take about four months for an E-scooter sharing company to break even on its investment.
For an E-scooter sharing provider, most of the cost is incurred through charging and operation. They have to collect E-scooters and transport them to their charging stations for battery charging, and maintenance of the scooter and then to place it again in the locations for the riders to use. Another challenge is the dumping or misplacing of the E-scooters.
In June 2020 Multnomah County Sheriff's Office (MSCO) divers picked up about 57 shared E-scooters from Willamette River in Portland, Oregon USA. In several cities, E-sharing scooters are rising concerns over the safety of people walking using it. According to a study conducted in Finland, about 331 people were admitted to emergency rooms from occurring accidents while riding an E-scooter from April 2020 to April 2024. Another challenge faced by E-scooter sharing is that due to the disturbance caused by them to the pedestrians who are using the sidewalks governments all over the world are bringing in restrictions for the usage of them in sidewalks.
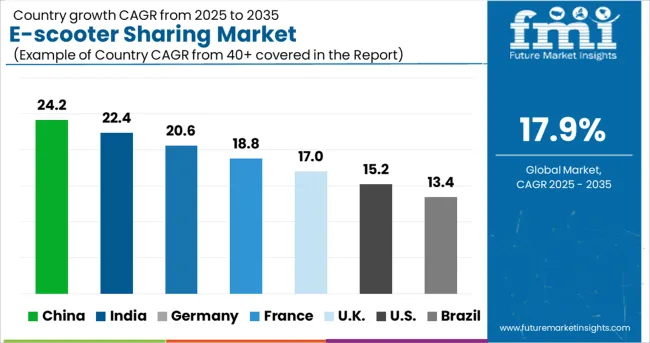
The USA accounted for over 89% of the E-scooter sharing market in 2024. The user penetration for E-scooter sharing is 1.1% in the USA in 2025. The USA market is expected to continue its dominance in the global E-scooter sharing with a valuation of USD 1.8 Million in 2025. The USA E-scooter sharing market is expected to account for a USD1.9 Billion absolute dollar opportunity between 2025 to 2035.
In 2024, China was the second-largest E-scooter sharing consumer after USA, with a market value of USD 70.5 Million . The E-scooter sharing market value is expected to increase to USD 81.3 Million in 2025 and is forecasted to reach a valuation of USD 9.4 Million by the end of 2035. The recent planning of the Chinese government to invest more than USD 2 Billion for the development of charging infrastructure is expected to attract E-scooter sharing companies to set up their operations in China. This will increase the demand for E-scooter sharing in China.
Free-floating systems provide a dockless free system, which helps the riders to pick and drop their E-scooter sharing from anywhere. Riders can book their ride through apps on mobile. Since it has no docking station, it is more feasible for direct trips compared to station-bound. Free-floating segment accounted for a CAGR of 18.6% from 2020 to 2024.
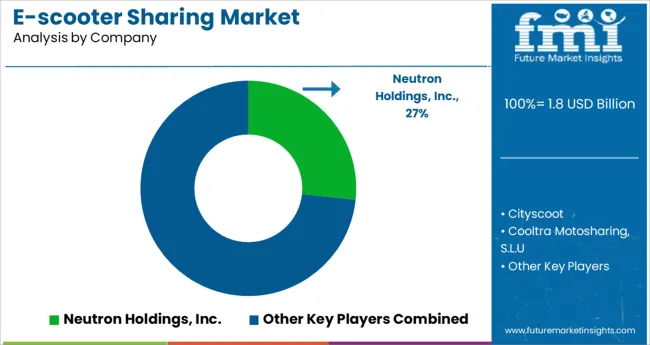
At present, E-scooter sharing manufacturers are largely aiming at raising funds and gaining more customers. The key companies operating in the E-scooter sharing market are Neutron Holdings, Inc. (Lime) Cityscoot, Cooltra Motosharing, S.L.U, Bird Global Inc., Vogo Automotive Pvt. Ltd., TIER Mobility AG, Voi Technology AB, Wind Mobility, Beam Mobility Holdings Pte. Ltd.
Some of the recent developments by key providers of E-scooter sharing are as follows:
Similarly, recent developments related to companies manufacturing E-scooter sharing have been tracked by the team at Future Market Insights, which is available in the full report.
| Attributes | Details |
|---|---|
| Forecast Period | 2025 to 2035 |
| Historical Data Available for | 2020 to 2024 |
| Market Analysis | million for Value |
| Key Countries Covered | USA, Canada, Brazil, Mexico, Germany, UK, France, Spain, Italy, Russia, China, Japan, South Korea, India, Australia, South Africa, Saudi Arabia, United Arab Emirates(UAE), and Israel. |
| Key Market Segments Covered | Type, Distribution channel, Region |
| Key Companies Profiled | Neutron Holdings, Inc.,; Cityscoot,; Cooltra Motosharing, S.L.U,; Bird Global Inc.,; Vogo Automotive Pvt. Ltd.; TIER Mobility AG; Voi Technology AB; Wind Mobility; Beam Mobility Holdings Pte. Ltd |
| Report Coverage | Value (In billion) |
The global e-scooter sharing market is estimated to be valued at USD 1.8 billion in 2025.
It is projected to reach USD 9.4 billion by 2035.
The market is expected to grow at a 17.9% CAGR between 2025 and 2035.
The key product types are free-floating and station-bound.
kick scooters segment is expected to dominate with a 58.9% industry share in 2025.


Our Research Products

The "Full Research Suite" delivers actionable market intel, deep dives on markets or technologies, so clients act faster, cut risk, and unlock growth.

The Leaderboard benchmarks and ranks top vendors, classifying them as Established Leaders, Leading Challengers, or Disruptors & Challengers.

Locates where complements amplify value and substitutes erode it, forecasting net impact by horizon

We deliver granular, decision-grade intel: market sizing, 5-year forecasts, pricing, adoption, usage, revenue, and operational KPIs—plus competitor tracking, regulation, and value chains—across 60 countries broadly.

Spot the shifts before they hit your P&L. We track inflection points, adoption curves, pricing moves, and ecosystem plays to show where demand is heading, why it is changing, and what to do next across high-growth markets and disruptive tech

Real-time reads of user behavior. We track shifting priorities, perceptions of today’s and next-gen services, and provider experience, then pace how fast tech moves from trial to adoption, blending buyer, consumer, and channel inputs with social signals (#WhySwitch, #UX).

Partner with our analyst team to build a custom report designed around your business priorities. From analysing market trends to assessing competitors or crafting bespoke datasets, we tailor insights to your needs.
Supplier Intelligence
Discovery & Profiling
Capacity & Footprint
Performance & Risk
Compliance & Governance
Commercial Readiness
Who Supplies Whom
Scorecards & Shortlists
Playbooks & Docs
Category Intelligence
Definition & Scope
Demand & Use Cases
Cost Drivers
Market Structure
Supply Chain Map
Trade & Policy
Operating Norms
Deliverables
Buyer Intelligence
Account Basics
Spend & Scope
Procurement Model
Vendor Requirements
Terms & Policies
Entry Strategy
Pain Points & Triggers
Outputs
Pricing Analysis
Benchmarks
Trends
Should-Cost
Indexation
Landed Cost
Commercial Terms
Deliverables
Brand Analysis
Positioning & Value Prop
Share & Presence
Customer Evidence
Go-to-Market
Digital & Reputation
Compliance & Trust
KPIs & Gaps
Outputs
Full Research Suite comprises of:
Market outlook & trends analysis
Interviews & case studies
Strategic recommendations
Vendor profiles & capabilities analysis
5-year forecasts
8 regions and 60+ country-level data splits
Market segment data splits
12 months of continuous data updates
DELIVERED AS:
PDF EXCEL ONLINE
Car Sharing Market Size and Share Forecast Outlook 2025 to 2035
Bike Sharing Market Size and Share Forecast Outlook 2025 to 2035
Photo Sharing Market Report - Growth, Demand & Forecast through 2035
Enterprise File Sharing And Synchronization Market

Thank you!
You will receive an email from our Business Development Manager. Please be sure to check your SPAM/JUNK folder too.
Chat With
MaRIA