Reports

- Global Locations -

Headquarters

Future Market Insights, Inc.

Christiana Corporate, 200
Continental Drive, Suite 401,
Newark, Delaware - 19713,
United States

T: +1-845-579-5705

Americas

Future Market Insights, Inc.

616 Corporate Way, Suite 2-9018,
Valley Cottage, NY 10989, United States

T: +1-347-918-3531

MEA

Future Market Insights

1602-6 Jumeirah Bay X2 Tower, Plot No: JLT-PH2-X2A,
Jumeirah Lakes Towers, Dubai,
United Arab Emirates

Europe

Future Market Insights

3rd Floor, 207 Regent Street,
W1B 3HH London
United Kingdom

T: + 44 (0) 20 8123 9659
D: +44 (0) 20 3287 4268

Asia Pacific

Future Market Insights

Office No. 401-A, 4th Floor,
VANTAGE 9, S.No. 36/1/1,
Baner, Pune 411045, India

Electrophysiology Market Outlook

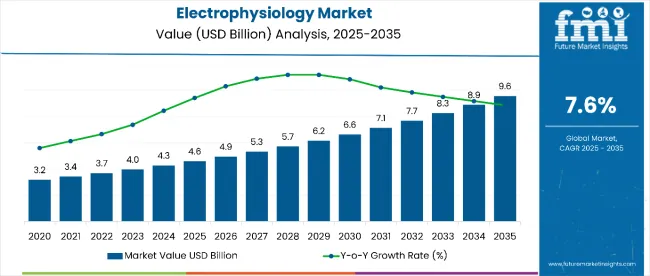
FMI forecasts the electrophysiology market valuation of US$ 22.67 billion by 2033, with a CAGR of 11.6%. The market is growing rapidly and is expected to be worth US$ 7.57 billion in 2023.

The demand for high precision and controlled cardiac diagnostic and ablation procedures has enabled the massive adoption of minimally invasive electrophysiology therapies. The interventionists have shifted towards adopting disposable catheters for the intermittent cardiac procedure, which offer better sterility and safety and are cost-effective. The market is expected to strengthen at a steady pace with the incoming innovative electrophysiology devices, increasing ratio of cardiac ablation procedures, and conducive reimbursement policies.

How are Innovations Driving the Electrophysiology Sector?

Manufacturers focus on alleviating issues associated with conventional cardiac ablation catheters, diagnostic catheters, cardiac mapping machine, and access devices. The electrophysiology sector has been introduced with next-generation devices loaded with advanced features that offer elevated safety and precision.

Conventional ablation catheters have been associated with off-targeting ablations, burns, and limited flexibility to access the target tissue site. The latest ablation catheters include:

  • Contact force-sensing technology, which provides control and precision for ablation
  • Balloon inflation pulmonary vein isolation that allows access to the challenging anatomy of the target tissue
  • Irrigated tip technology that avoids ablation-induced burns to the healthy cardiac tissues.

Such advanced technology elevates the adoption of catheter ablation procedures by nullifying the potential risks.

The cardiac electro-mapping machines are loaded with next-generation basket catheters, rapidly scanning cardiac tissues point-by-point. Also, a magnetic sensor or multiple ultrasound electrode baskets are used for expedited and precise scanning.

Electrophysiology medical devices in this decade are getting smarter, which are not just technological advancements, but also essentiality amid the challenges of the pandemic. The interventionists cannot afford to delay the cardiac therapies, and at the same time, the hospital visits are also needed to be restricted to avoid hospital-acquired infection.

Manufacturers have started including digital cloud technology to access and manage electrophysiology data to monitor cardiac rhythm data. This nullifies the need to physically visit the interventionalist.

Attributes Details (Values)
Electrophysiology Market CAGR (2023 to 2033) 11.6%
Electrophysiology Market Size (2023) US$ 7.57 billion
Electrophysiology Market Size (2033) US$ 22.67 billion

Don't pay for what you don't need

Customize your report by selecting specific countries or regions and save 30%!

What is the Future Outlook for Electrophysiology Industry in Comparison to Historic Pattern of Growth?

The global electrophysiology industry experienced significant growth between 2018 and 2022, with a CAGR of 9.3%. Initially, the market had a worth of US$ 6.80 billion in 2022.

Cardiac ablation procedures have witnessed a surge in application in a volume of procedures in various geographies. For instance, the Japanese Catheter Ablation Registry conducted a registry in August 2017, covering over 250 hospitals, which targeted over 70 000 ablation procedures per year in Japan alone.

The Registry Data for Arrhythmia Interventional Treatments in Mainland China has recorded that over 170,000 cardiac radiofrequency ablation procedures were carried out in 2019 only. These escalating rationales of the electrophysiology procedures depict the spurring expansion of the adoption of electrophysiology.

Short-term growth (2023 to 2026): The next-generation technologies of advanced cardiac mapping and telerobotics, remote, and real-time monitoring are shaping the legacy of electrophysiology devices, therapies, and procedures.

Medium-term growth (2027 to 2030): The digital health and telemedicine equipped the electrophysiology catheters, and devices offer real-time monitoring through a secured cloud server. This eliminates needing a physical visit to hospitals and clinics for electrophysiology monitoring.

Long-term growth (2031 to 2033): The updated safety strategies, advanced electrophysiology devices, and their increasing adoption guarantee a steady outlook for growth.

Due to these factors, the market is likely to have an absolute dollar opportunity of US$ 896.8 million during the forecast period

What is the Extent of the Minimal Invasive Electrophysiology Procedure Impacting the Market?

The invasive surgical interventions are associated with several risks for patients with pre-existing medical comorbidities, such as hypertension, diabetes, etc. Also, the prevalence of cardiac arrhythmias, including atrial fibrillation, atrial flutter, Wolff-Parkinson-White syndrome, and others, is rising.

It necessitates a safer, cost-effective, and minimally invasive interventional procedure for cardiac arrhythmia. The cardiac electrophysiology devices market, which includes those for diagnosing and treating various cardiac arrhythmias, accounts for a sizable portion of the entire electrophysiology market.

The market is expanding due to the rising use of minimally invasive procedures and the rising prevalence of cardiovascular illnesses. The American Heart Association has stated that over 2.7 million Americans suffer from atrial fibrillation.

The minimally invasive technology offered by cardiac ablation catheters and diagnostic catheters imperatively drives the market’s growth spurt. The manufacturers are focused on providing advanced ablation and diagnostic catheters and devices that are minimally invasive and offer a short recovery period.

Sabyasachi Ghosh
Sabyasachi Ghosh

Principal Consultant

Talk to Analyst

Find your sweet spots for generating winning opportunities in this market.

What is the Commercial Potential of Smart Technologies in Electrophysiology Devices?

  • Manufacturers are increasingly including smart and next-generation technologies. The advanced cardiac electro-mapping machines equipped with next-generation basket catheter scanning offer expedited, detailed, and efficient cardiac tissue mapping.
  • The advanced technology of contact force-sensing ablation catheters offers high-precision lesion formation.
  • Manufacturers have been seen at the forefront of strengthening their electrophysiology portfolio. Several companies have undergone acquisitions to expand their electrophysiology offerings.
  • On June 05, 2018, Philips Healthcare acquired EPD to strengthen the electrophysiology ablation image-guiding systems. Baylis Medical and Japan Lifeline collaborated to penetrate their advanced electrophysiology procedure solutions in Europe and North American regions.
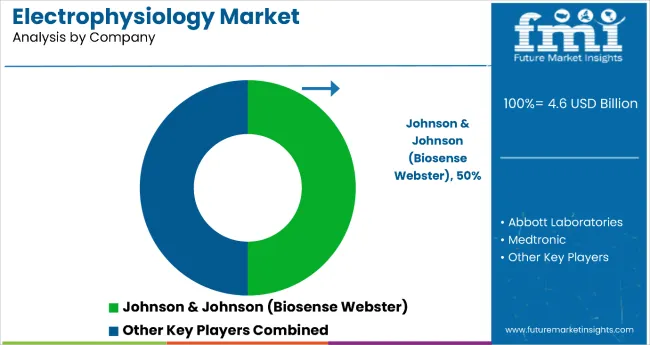
  • Several players, such as Johnson & Johnson (Biosense Webster, Inc.), Abbott Laboratories, Acutus Medical Inc., and Microport Scientific Corporation, have recently earned approvals and launched multiple electrophysiology catheters and mapping systems.

What is the Regulatory Impact on Global Electrophysiology Sales?

The World Health Organization (WHO) has highlighted the dire scenario of the causality and risk posed by cardiovascular diseases. The WHO has stated that cardiac diseases are the number one cause of global deaths, claiming over 17.9 million lives every year. Out of which, heart attacks and strokes are the reason for 80% of the deaths caused by cardiovascular diseases.

The standard healthcare system and the conducive reimbursement policies are impeding the electrophysiology sector. The healthcare system has witnessed several improvements to make it more accessible to the public.

For instance, the Affordable Care Act in the United States was implemented that allows 40 million uninsured United States citizens to have access to healthcare facilities.

England provides a large portion of its healthcare facilities for free to its citizens. The National Health Service (NHS) offers hospital services, preventive medicines, and primary care to ordinary residents.

Several radical changes were introduced into the NHS to offer social care leaders to devise facilities for individual patients formally, and it has been made available at the hospital.

Reprocessing catheters in the electrophysiology interventions helps curb the expenses of the diagnosis and procedure, thus increasing the affordability of the electrophysiology therapies.

Such a conducive healthcare system, along with the reimbursement policies covering the wide spectrum of the electrophysiology devices, widens the horizon of growth for the electrophysiology demand.

Get the data you need at a Fraction of the cost

Personalize your report by choosing insights you need
and save 40%!

Comparative View of Electrophysiology Market

Electrophysiology Market:

Attributes Electrophysiology Market
CAGR (2023 to 2033) 11.6%
Market Value (2033) US$ 22.67 billion
Growth Factor Demand for effective cardiac diagnostics
Opportunity Surging minimal invasive electrophysiology procedure
Key Trends Introduction of smart technologies

Electrophysiology Equipment and Recording Systems Market:

Attributes Electrophysiology Equipment and Recording Systems Market
CAGR (2023 to 2033) 10.94%
Market Value (2033) US$ 19.47 billion
Growth Factor Surging demand for cardiac rhythm management devices
Opportunity Rising need for diagnostics and ablation catheters
Key Trends Technological improvements like electrophysiology devices

Visual Electrophysiology Market:

Attributes Visual Electrophysiology Market
CAGR (2023 to 2033) 7.3%
Market Value (2033) US$ 509.52 million
Growth Factor Growing awareness about the visual disorders
Opportunity Increasing investment by key players
Key Trends Development of innovative practice solutions

Country-wise Insights

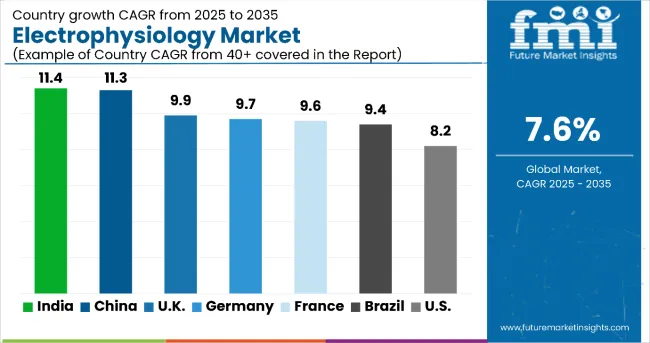
Country United States
CAGR (2018 to 2022) 10.4%
CAGR (2023 to 2033) 12.0%
Country United Kingdom
CAGR (2018 to 2022) 10.4%
CAGR (2023 to 2033) 12.1%
Country Germany
CAGR (2018 to 2022) 9.7%
CAGR (2023 to 2033) 13.2%
Country Canada
CAGR (2018 to 2022) 10%
CAGR (2023 to 2033) 12%
Country China
CAGR (2018 to 2022) 12.5%
CAGR (2023 to 2033) 15.9%

How Huge is the Opportunity in the United States?

The United States is expected to have a leading market size of US$ 10.56 billion by 2033. This is owing to the substantial healthcare expenditure and infrastructure. The preliminary forecasts by CMS’ Office of the Actuary have stated that the overall healthcare expenditure of the United States alone is likely to increase to 5.4% from 2019 to 2028, outpacing the nation’s GDP by 4.3%.

The United States stands out as the leading medical device market globally and the invariably lucrative pocket for the electrophysiology sector. Select USA has stated that the United States medical devices market accounted for 40% of the global market in 2017 and is expected to reach US$ 203 billion by 2023.

According to the Centers for Medicare & Medicaid Services (CMS), the United States recorded a retail expenditure of US$ 54.4 billion for durable medical equipment in 2017. This medical device expenditure is anticipated to elevate further, thus creating a remarkable scope and absolute dollar opportunity of US$ 442.9 million for the market.

The massive population base and expanding geriatric population promise strong growth for the United States market. The robust healthcare infrastructure has 17% of its hospitals equipped with EP lab facilities, such as cardiac stimulators, EP recording systems, RF ablation generators, 3D mapping systems, and intracardiac echocardiography (ICE) systems.

The country also has a diagnosis rate of atrial fibrillation cases of 37%, and 90% of its AF studies underwent ablation procedures in 2019.

How Electrophysiology Labs In Germany Are Influencing Its Dominance in Europe?

Germany is expected to have a significant market size of US$ 2.33 billion by 2033. In Germany, the Federal Statistical Office has reported the spike in the healthcare expenditure by 4% from 2017 to 2018. Germany has recorded a healthcare expenditure of 11.7% of the GDP, in 2018.

Germany has an impressive healthcare infrastructure equipped with the latest technological facilities for its electrophysiology labs. Germany has EP lab facilities in over 30% of its total hospitals. The potential patient base, advanced healthcare infrastructure, high-tech interventional procedures, and well ample trained medical staff are driving the growth of the Germany electrophysiology sector.

Germany had over 55% of its atrial fibrillation cases diagnosed, and over 81% of its AF studies have undergone ablation procedures, in 2019. The impressive diagnosis rate, advanced electrophysiology lab facilities, and the awareness of the cardiac arrhythmias and electrophysiological interventions are driving the dominance of Germany in the Europe market.

How Big is the Opportunity for Electrophysiology Business in France?

France has electrophysiology labs in over 8% of its hospitals. The country has a prevalence rate of 1.8% of atrial fibrillation. The research and therapeutic interventions in the domain of cardiac arrhythmias are advanced in France.

It has been recorded that over 9% of the atrial fibrillation cases have undergone the electrophysiology procedures in 2019. Over 41% of its atrial fibrillation cases are diagnosed and 87% of its AF studies have undergone ablation procedures, in 2019.

France spends 11.25% of its GDP into its healthcare expenditure in 2018, as recorded by the World Bank. France prioritizes healthcare as the national responsibility in the country.

Also the favorable government policies and the massive incidence rates of the cardiac arrhythmias in France are flourishing the electrophysiology market in the nation.

What Forces are Driving the Market for Electrophysiology in China?

Cardiac arrhythmias, such as atrial fibrillation, have a prevalence rate of 0.70% in China. China has 23% of its atrial fibrillation cases receiving the diagnosis, and 87% of its AF studies have undergone ablation procedures, in 2019.

The increasing adoption of latest technology, the presence of key players, and the massive burden of cardiac arrhythmias are driving the growth spurt of the electrophysiology business in China. The expanding graying population is also fueling the growth spurt of the market in China, which leads to a valuation of US$ 2.95 billion by 2033.

Category-wise Insights

What Factors Supporting Uptake Of Electrophysiology Ablation Catheters?

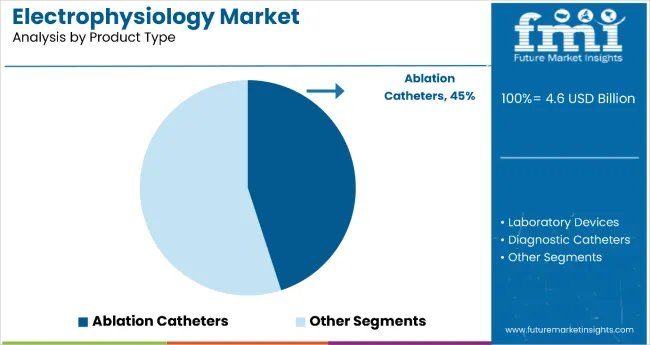
The precision in ablation is elevated with the technology of contact-force monitoring and irrigated tip ablation catheters and balloon catheters. These factors are fueling the massive and dominating share of the electrophysiology ablation catheters, with a market CAGR of 11.4% during 2018 to 2022, and are expected to elevate further by 2033, to reach the CAGR of 12.7%.

In the global market, the segment of electrophysiology laboratory devices occupies a sizable share. The use of these devices in the identification and treatment of various cardiac arrhythmias is credited with the increase.

Why Atrial Fibrillation Holds Accounts for High Share in the Market?

Atrial fibrillation held the leading share of 48% in 2020, and the share is expected to further escalate to 52.6% by 2033. The increasing prevalence rate of atrial fibrillation impacted by the demographic changes in regions like Europe has expanded its dominance in the market.

The United States has a prevalence of 1.45% for atrial fibrillation in 2019. Over 3,586,878 of atrial fibrillation in the United States have been estimated in the research conducted by FMI for the electrophysiology market. Out of which, over 34.50% of the atrial fibrillation cases are diagnosed, and 25% of the cases undergo electrophysiology studies.

The diagnosis rate and protocols for atrial fibrillation are well established. The incoming advanced technologies of cardiac electro mapping, ablation, and diagnostic catheterization have also rocketed the atrial fibrillation share in the market.

Lucrative Opportunities Abound for the Hospitals

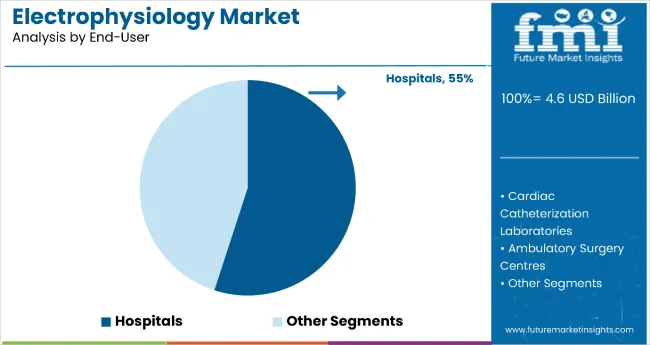
According to FMI, hospitals hold a substantial share in the electrophysiology market owing to its advanced electrophysiology lab facilities that thrive to provide cardiac stimulators. Hospitals are expected to increase from a 9.4% CAGR between 2018 and 2022 to an 11.2% CAGR by 2033.

Electrophysiology recording systems, radiofrequency (RF) ablation generators, 3D mapping systems and intracardiac echocardiography (ICE) systems are further expanding the market.

The advanced infrastructure, well-trained interventionists, and the advanced expenditure of the diagnosis, therapy and prescription for the electrophysiology procedures drive the growth of the hospital segment in the electrophysiology market.

Competitive Landscape

Manufacturers Focus on Smart Electrophysiology Solutions for High Profit Margins

Manufacturers in the electrophysiology market are aiming at strategic collaborations with other key players of the electrophysiology domain to strengthen their offerings of the ablation catheters, diagnostic catheters, electrophysiology laboratory devices and access devices. The manufacturers have also collaborated with regional players to elevate their penetration into other geographies.

The focus on product launches of electrophysiology devices has been highly progressive. The market has witnessed the debut of several electrophysiology devices loaded with advanced technologies. The distribution networks have been targeted for reaching the potential markets.

For instance,

  • Medtronic Plc has been observed to have an aggressive venture in the approval and launching of over 12 of its proprietary electrophysiology catheters and other devices in Indonesia, Uzbekistan, and two catheters in Australia, from 2017 to 2020.
  • Baylis Medical Japan Lifeline came under the collaboration in November 2020, for the launching of advanced electrophysiology procedure solutions, such as 2F micro catheter and 6F guiding catheters, in the Europe region.

Acutus Medical and Biotronik partnered to offer comprehensive electrophysiology solutions for catheter-based therapy of cardiac arrhythmias in regions of Europe and Asia. This resulted in the integration of the AcQMap system of Acutus Medical with the SuperMap multi-mode mapping facilities by Biotronik for the non-contact mapping of the irregular cardiac rhythms.

There has been a deliberate focus on the technological advancements to bear the edge in the electrophysiology interventional products. Manufacturers have infused remote access monitoring, telerobotics in ablation, digital cloud services for data access, and advanced software and algorithms for electro mapping of the heart.

  • Johnson & Johnson (Biosense Webster, Inc.) has recently launched Cartonet Analytics Software in 2019, which offers real-time monitoring of cardiac data through its cloud server.
  • Stereotaxis and Acutus Medical collaborated to launch the first Integrated Cardiac Ablation Procedure, having AcQMap systems of Acutus Medical and Stereotaxis Robotic Magnetic Navigation for the arrhythmia treatment.

Key Players

  • Abbott Laboratories
  • Johnson & Johnson (Biosense Webster, Inc.)
  • Medtronic Plc
  • Boston Scientific Corporation
  • Japan Lifeline
  • Koninklijke Philips N.V.
  • Merit Medical Systems
  • Biotronik SE & Co. KG
  • Microport Scientific Corporation
  • APN Health, LLC
  • Baylis Medical Company, Inc.

Key segments

By Product Type:

  • Electrophysiology Laboratory Devices
    • 3D Mapping Systems
    • Electrophysiology Recording Systems
    • Radiofrequency (RF) Ablation Systems
    • Intracardiac Echocardiography (Ice) Ultrasound Imaging Systems
    • Cardiac Stimulators
    • Others
  • Electrophysiology Ablation Catheters
    • Cryoablation Electrophysiology Catheters
    • Radiofrequency (RF) Ablation Catheters
    • Irrigated Tip RF Ablation Catheters
    • Laser Ablation Catheters
  • Electrophysiology Diagnostic Catheters
    • Conventional Electrophysiology Diagnostic Catheters
    • Advanced Electrophysiology Diagnostic Catheters
    • Ultrasound Electrophysiology Diagnostic Catheters
  • Access Devices

By Indication:

  • Atrial Fibrillation
  • Atrial Flutter
  • Wolff-Parkinson-White Syndrome (WPW)
  • Atrioventricular Nodal Reentry Tachycardia (AVNRT)
  • Ventricular tachycardia (VT)
  • Others

By End-User:

  • Hospitals
  • Cardiac Catheterization Laboratories
  • Ambulatory Surgery Centers

By Region:

  • North America
  • Latin America
  • Europe
  • East Asia
  • South Asia
  • Oceania
  • The Middle East and Africa (MEA)

Frequently Asked Questions

The electrophysiology market is expected to be valued at US$ 7.57 billion in 2023.

Abbott Laboratories, Johnson & Johnson (Biosense Webster, Inc.), and Medtronic Pl., are the key market players

The ectrophysiology industry is set to surge at a CAGR of 11.6% from 2023 to 2033.

The United States is anticipated to generate US$ 10.56 billion revenue by 2033.

Demanding a safe, affordable, and less invasive approach for heart arrhythmia drives the market growth until 2033.

Table of Content

1. Executive Summary | Electrophysiology Market 

    1.1. Global Market Outlook

    1.2. Demand-side Trends

    1.3. Supply-side Trends

    1.4. Technology Roadmap Analysis

    1.5. Analysis and Recommendations

2. Market Overview

    2.1. Market Coverage / Taxonomy

    2.2. Market Definition / Scope / Limitations

3. Market Background

    3.1. Market Dynamics

        3.1.1. Drivers

        3.1.2. Restraints

        3.1.3. Opportunity

        3.1.4. Trends

    3.2. Scenario Forecast

        3.2.1. Demand in Optimistic Scenario

        3.2.2. Demand in Likely Scenario

        3.2.3. Demand in Conservative Scenario

    3.3. Opportunity Map Analysis

    3.4. Investment Feasibility Matrix

    3.5. PESTLE and Porter’s Analysis

    3.6. Regulatory Landscape

        3.6.1. By Key Regions

        3.6.2. By Key Countries

    3.7. Regional Parent Market Outlook

4. Global Market Analysis 2018 to 2022 and Forecast, 2023 to 2033

    4.1. Historical Market Size Value (US$ Million) Analysis, 2018 to 2022

    4.2. Current and Future Market Size Value (US$ Million) Projections, 2023 to 2033

        4.2.1. Y-o-Y Growth Trend Analysis

        4.2.2. Absolute $ Opportunity Analysis

5. Global Market Analysis 2018 to 2022 and Forecast 2023 to 2033, By Product Type

    5.1. Introduction / Key Findings

    5.2. Historical Market Size Value (US$ Million) Analysis By Product Type, 2018 to 2022

    5.3. Current and Future Market Size Value (US$ Million) Analysis and Forecast By Product Type, 2023 to 2033

        5.3.1. Laboratory Devices

            5.3.1.1. 3D Mapping Systems

            5.3.1.2. Recording Systems

            5.3.1.3. Radiofrequency Ablation Systems

            5.3.1.4. Intracardiac Echocardiography Ultrasound Imaging Systems

            5.3.1.5. Cardiac Stimulators

            5.3.1.6. Others

        5.3.2. Ablation Catheters

            5.3.2.1. Cryoablation Catheters

            5.3.2.2. Radiofrequency Ablation Catheters

            5.3.2.3. Irrigated Tip RF Ablation Catheters

            5.3.2.4. Laser Ablation Catheters

        5.3.3. Diagnostic Catheters

            5.3.3.1. Conventional Diagnostic Catheters

            5.3.3.2. Advanced Diagnostic Catheters

            5.3.3.3. Ultrasound Diagnostic Catheters

        5.3.4. Access Devices

    5.4. Y-o-Y Growth Trend Analysis By Product Type, 2018 to 2022

    5.5. Absolute $ Opportunity Analysis By Product Type, 2023 to 2033

6. Global Market Analysis 2018 to 2022 and Forecast 2023 to 2033, By Indication

    6.1. Introduction / Key Findings

    6.2. Historical Market Size Value (US$ Million) Analysis By Indication, 2018 to 2022

    6.3. Current and Future Market Size Value (US$ Million) Analysis and Forecast By Indication, 2023 to 2033

        6.3.1. Atrial Fibrillation

        6.3.2. Atrial Flutter

        6.3.3. Wolff-Parkinson-White Syndrome

        6.3.4. Atrioventricular Nodal Reentry Tachycardia

        6.3.5. Ventricular Tachycardia

        6.3.6. Other Indications

    6.4. Y-o-Y Growth Trend Analysis By Indication, 2018 to 2022

    6.5. Absolute $ Opportunity Analysis By Indication, 2023 to 2033

7. Global Market Analysis 2018 to 2022 and Forecast 2023 to 2033, By End-User 

    7.1. Introduction / Key Findings

    7.2. Historical Market Size Value (US$ Million) Analysis By End-User , 2018 to 2022

    7.3. Current and Future Market Size Value (US$ Million) Analysis and Forecast By End-User , 2023 to 2033

        7.3.1. Hospitals

        7.3.2. Cardiac Catheterization Laboratories

        7.3.3. Ambulatory Surgery Centers

    7.4. Y-o-Y Growth Trend Analysis By End-User , 2018 to 2022

    7.5. Absolute $ Opportunity Analysis By End-User , 2023 to 2033

8. Global Market Analysis 2018 to 2022 and Forecast 2023 to 2033, By Region

    8.1. Introduction

    8.2. Historical Market Size Value (US$ Million) Analysis By Region, 2018 to 2022

    8.3. Current Market Size Value (US$ Million) Analysis and Forecast By Region, 2023 to 2033

        8.3.1. North America

        8.3.2. Latin America

        8.3.3. Europe

        8.3.4. South Asia

        8.3.5. East Asia

        8.3.6. Oceania

        8.3.7. Middle East and Africa

    8.4. Market Attractiveness Analysis By Region

9. North America Market Analysis 2018 to 2022 and Forecast 2023 to 2033, By Country

    9.1. Historical Market Size Value (US$ Million) Trend Analysis By Market Taxonomy, 2018 to 2022

    9.2. Market Size Value (US$ Million) Forecast By Market Taxonomy, 2023 to 2033

        9.2.1. By Country

            9.2.1.1. USA

            9.2.1.2. Canada

        9.2.2. By Product Type

        9.2.3. By Indication

        9.2.4. By End-User

    9.3. Market Attractiveness Analysis

        9.3.1. By Country

        9.3.2. By Product Type

        9.3.3. By Indication

        9.3.4. By End-User

    9.4. Key Takeaways

10. Latin America Market Analysis 2018 to 2022 and Forecast 2023 to 2033, By Country

    10.1. Historical Market Size Value (US$ Million) Trend Analysis By Market Taxonomy, 2018 to 2022

    10.2. Market Size Value (US$ Million) Forecast By Market Taxonomy, 2023 to 2033

        10.2.1. By Country

            10.2.1.1. Brazil

            10.2.1.2. Mexico

            10.2.1.3. Rest of Latin America

        10.2.2. By Product Type

        10.2.3. By Indication

        10.2.4. By End-User

    10.3. Market Attractiveness Analysis

        10.3.1. By Country

        10.3.2. By Product Type

        10.3.3. By Indication

        10.3.4. By End-User

    10.4. Key Takeaways

11. Europe Market Analysis 2018 to 2022 and Forecast 2023 to 2033, By Country

    11.1. Historical Market Size Value (US$ Million) Trend Analysis By Market Taxonomy, 2018 to 2022

    11.2. Market Size Value (US$ Million) Forecast By Market Taxonomy, 2023 to 2033

        11.2.1. By Country

            11.2.1.1. United Kingdom

            11.2.1.2. Spain

            11.2.1.3. Germany

            11.2.1.4. Italy

            11.2.1.5. France

            11.2.1.6. Rest of Europe

        11.2.2. By Product Type

        11.2.3. By Indication

        11.2.4. By End-User

    11.3. Market Attractiveness Analysis

        11.3.1. By Country

        11.3.2. By Product Type

        11.3.3. By Indication

        11.3.4. By End-User

    11.4. Key Takeaways

12. South Asia Market Analysis 2018 to 2022 and Forecast 2023 to 2033, By Country

    12.1. Historical Market Size Value (US$ Million) Trend Analysis By Market Taxonomy, 2018 to 2022

    12.2. Market Size Value (US$ Million) Forecast By Market Taxonomy, 2023 to 2033

        12.2.1. By Country

            12.2.1.1. India

            12.2.1.2. Malaysia

            12.2.1.3. Indonesia

            12.2.1.4. Thailand

            12.2.1.5. Rest of South Asia

        12.2.2. By Product Type

        12.2.3. By Indication

        12.2.4. By End-User

    12.3. Market Attractiveness Analysis

        12.3.1. By Country

        12.3.2. By Product Type

        12.3.3. By Indication

        12.3.4. By End-User

    12.4. Key Takeaways

13. East Asia Market Analysis 2018 to 2022 and Forecast 2023 to 2033, By Country

    13.1. Historical Market Size Value (US$ Million) Trend Analysis By Market Taxonomy, 2018 to 2022

    13.2. Market Size Value (US$ Million) Forecast By Market Taxonomy, 2023 to 2033

        13.2.1. By Country

            13.2.1.1. China

            13.2.1.2. Japan

            13.2.1.3. South Korea

        13.2.2. By Product Type

        13.2.3. By Indication

        13.2.4. By End-User

    13.3. Market Attractiveness Analysis

        13.3.1. By Country

        13.3.2. By Product Type

        13.3.3. By Indication

        13.3.4. By End-User

    13.4. Key Takeaways

14. Oceania Market Analysis 2018 to 2022 and Forecast 2023 to 2033, By Country

    14.1. Historical Market Size Value (US$ Million) Trend Analysis By Market Taxonomy, 2018 to 2022

    14.2. Market Size Value (US$ Million) Forecast By Market Taxonomy, 2023 to 2033

        14.2.1. By Country

            14.2.1.1. Australia

            14.2.1.2. New Zealand

        14.2.2. By Product Type

        14.2.3. By Indication

        14.2.4. By End-User

    14.3. Market Attractiveness Analysis

        14.3.1. By Country

        14.3.2. By Product Type

        14.3.3. By Indication

        14.3.4. By End-User

    14.4. Key Takeaways

15. Middle East and Africa Market Analysis 2018 to 2022 and Forecast 2023 to 2033, By Country

    15.1. Historical Market Size Value (US$ Million) Trend Analysis By Market Taxonomy, 2018 to 2022

    15.2. Market Size Value (US$ Million) Forecast By Market Taxonomy, 2023 to 2033

        15.2.1. By Country

            15.2.1.1. South Africa

            15.2.1.2. GCC Countries

            15.2.1.3. Rest of Middle East and Africa

        15.2.2. By Product Type

        15.2.3. By Indication

        15.2.4. By End-User

    15.3. Market Attractiveness Analysis

        15.3.1. By Country

        15.3.2. By Product Type

        15.3.3. By Indication

        15.3.4. By End-User

    15.4. Key Takeaways

16. Key Countries Market Analysis

    16.1. USA

        16.1.1. Pricing Analysis

        16.1.2. Market Share Analysis, 2022

            16.1.2.1. By Product Type

            16.1.2.2. By Indication

            16.1.2.3. By End-User

    16.2. Canada

        16.2.1. Pricing Analysis

        16.2.2. Market Share Analysis, 2022

            16.2.2.1. By Product Type

            16.2.2.2. By Indication

            16.2.2.3. By End-User

    16.3. Brazil

        16.3.1. Pricing Analysis

        16.3.2. Market Share Analysis, 2022

            16.3.2.1. By Product Type

            16.3.2.2. By Indication

            16.3.2.3. By End-User

    16.4. Mexico

        16.4.1. Pricing Analysis

        16.4.2. Market Share Analysis, 2022

            16.4.2.1. By Product Type

            16.4.2.2. By Indication

            16.4.2.3. By End-User

    16.5. United Kingdom

        16.5.1. Pricing Analysis

        16.5.2. Market Share Analysis, 2022

            16.5.2.1. By Product Type

            16.5.2.2. By Indication

            16.5.2.3. By End-User

    16.6. Spain

        16.6.1. Pricing Analysis

        16.6.2. Market Share Analysis, 2022

            16.6.2.1. By Product Type

            16.6.2.2. By Indication

            16.6.2.3. By End-User

    16.7. Germany

        16.7.1. Pricing Analysis

        16.7.2. Market Share Analysis, 2022

            16.7.2.1. By Product Type

            16.7.2.2. By Indication

            16.7.2.3. By End-User

    16.8. Italy

        16.8.1. Pricing Analysis

        16.8.2. Market Share Analysis, 2022

            16.8.2.1. By Product Type

            16.8.2.2. By Indication

            16.8.2.3. By End-User

    16.9. France

        16.9.1. Pricing Analysis

        16.9.2. Market Share Analysis, 2022

            16.9.2.1. By Product Type

            16.9.2.2. By Indication

            16.9.2.3. By End-User

    16.10. India

        16.10.1. Pricing Analysis

        16.10.2. Market Share Analysis, 2022

            16.10.2.1. By Product Type

            16.10.2.2. By Indication

            16.10.2.3. By End-User

    16.11. Malaysia

        16.11.1. Pricing Analysis

        16.11.2. Market Share Analysis, 2022

            16.11.2.1. By Product Type

            16.11.2.2. By Indication

            16.11.2.3. By End-User

    16.12. Indonesia

        16.12.1. Pricing Analysis

        16.12.2. Market Share Analysis, 2022

            16.12.2.1. By Product Type

            16.12.2.2. By Indication

            16.12.2.3. By End-User

    16.13. Thailand

        16.13.1. Pricing Analysis

        16.13.2. Market Share Analysis, 2022

            16.13.2.1. By Product Type

            16.13.2.2. By Indication

            16.13.2.3. By End-User

    16.14. China

        16.14.1. Pricing Analysis

        16.14.2. Market Share Analysis, 2022

            16.14.2.1. By Product Type

            16.14.2.2. By Indication

            16.14.2.3. By End-User

    16.15. Japan

        16.15.1. Pricing Analysis

        16.15.2. Market Share Analysis, 2022

            16.15.2.1. By Product Type

            16.15.2.2. By Indication

            16.15.2.3. By End-User

    16.16. South Korea

        16.16.1. Pricing Analysis

        16.16.2. Market Share Analysis, 2022

            16.16.2.1. By Product Type

            16.16.2.2. By Indication

            16.16.2.3. By End-User

    16.17. Australia

        16.17.1. Pricing Analysis

        16.17.2. Market Share Analysis, 2022

            16.17.2.1. By Product Type

            16.17.2.2. By Indication

            16.17.2.3. By End-User

    16.18. New Zealand

        16.18.1. Pricing Analysis

        16.18.2. Market Share Analysis, 2022

            16.18.2.1. By Product Type

            16.18.2.2. By Indication

            16.18.2.3. By End-User

    16.19. South Africa

        16.19.1. Pricing Analysis

        16.19.2. Market Share Analysis, 2022

            16.19.2.1. By Product Type

            16.19.2.2. By Indication

            16.19.2.3. By End-User

    16.20. GCC Countries

        16.20.1. Pricing Analysis

        16.20.2. Market Share Analysis, 2022

            16.20.2.1. By Product Type

            16.20.2.2. By Indication

            16.20.2.3. By End-User

17. Market Structure Analysis

    17.1. Competition Dashboard

    17.2. Competition Benchmarking

    17.3. Market Share Analysis of Top Players

        17.3.1. By Regional

        17.3.2. By Product Type

        17.3.3. By Indication

        17.3.4. By End-User

18. Competition Analysis

    18.1. Competition Deep Dive

        18.1.1. Abbott Laboratories

            18.1.1.1. Overview

            18.1.1.2. Product Portfolio

            18.1.1.3. Profitability by Market Segments

            18.1.1.4. Sales Footprint

            18.1.1.5. Strategy Overview

                18.1.1.5.1. Marketing Strategy

        18.1.2. Johnson & Johnson

            18.1.2.1. Overview

            18.1.2.2. Product Portfolio

            18.1.2.3. Profitability by Market Segments

            18.1.2.4. Sales Footprint

            18.1.2.5. Strategy Overview

                18.1.2.5.1. Marketing Strategy

        18.1.3. Acutus Medical Inc.

            18.1.3.1. Overview

            18.1.3.2. Product Portfolio

            18.1.3.3. Profitability by Market Segments

            18.1.3.4. Sales Footprint

            18.1.3.5. Strategy Overview

                18.1.3.5.1. Marketing Strategy

        18.1.4. Japan Lifeline Co. Ltd.

            18.1.4.1. Overview

            18.1.4.2. Product Portfolio

            18.1.4.3. Profitability by Market Segments

            18.1.4.4. Sales Footprint

            18.1.4.5. Strategy Overview

                18.1.4.5.1. Marketing Strategy

        18.1.5. Boston Scientific Corporation

            18.1.5.1. Overview

            18.1.5.2. Product Portfolio

            18.1.5.3. Profitability by Market Segments

            18.1.5.4. Sales Footprint

            18.1.5.5. Strategy Overview

                18.1.5.5.1. Marketing Strategy

        18.1.6. Merit Medical Systems Inc.

            18.1.6.1. Overview

            18.1.6.2. Product Portfolio

            18.1.6.3. Profitability by Market Segments

            18.1.6.4. Sales Footprint

            18.1.6.5. Strategy Overview

                18.1.6.5.1. Marketing Strategy

        18.1.7. Teleflex

            18.1.7.1. Overview

            18.1.7.2. Product Portfolio

            18.1.7.3. Profitability by Market Segments

            18.1.7.4. Sales Footprint

            18.1.7.5. Strategy Overview

                18.1.7.5.1. Marketing Strategy

        18.1.8. EP Solutions

            18.1.8.1. Overview

            18.1.8.2. Product Portfolio

            18.1.8.3. Profitability by Market Segments

            18.1.8.4. Sales Footprint

            18.1.8.5. Strategy Overview

                18.1.8.5.1. Marketing Strategy

        18.1.9. Medtronic plc

            18.1.9.1. Overview

            18.1.9.2. Product Portfolio

            18.1.9.3. Profitability by Market Segments

            18.1.9.4. Sales Footprint

            18.1.9.5. Strategy Overview

                18.1.9.5.1. Marketing Strategy

        18.1.10. Microport Scientific Corporation

            18.1.10.1. Overview

            18.1.10.2. Product Portfolio

            18.1.10.3. Profitability by Market Segments

            18.1.10.4. Sales Footprint

            18.1.10.5. Strategy Overview

                18.1.10.5.1. Marketing Strategy

        18.1.11. Biotronik

            18.1.11.1. Overview

            18.1.11.2. Product Portfolio

            18.1.11.3. Profitability by Market Segments

            18.1.11.4. Sales Footprint

            18.1.11.5. Strategy Overview

                18.1.11.5.1. Marketing Strategy

        18.1.12. Baylis Medical

            18.1.12.1. Overview

            18.1.12.2. Product Portfolio

            18.1.12.3. Profitability by Market Segments

            18.1.12.4. Sales Footprint

            18.1.12.5. Strategy Overview

                18.1.12.5.1. Marketing Strategy

        18.1.13. Koninklijke Philips N.V.

            18.1.13.1. Overview

            18.1.13.2. Product Portfolio

            18.1.13.3. Profitability by Market Segments

            18.1.13.4. Sales Footprint

            18.1.13.5. Strategy Overview

                18.1.13.5.1. Marketing Strategy

        18.1.14. APN Health, LLC

            18.1.14.1. Overview

            18.1.14.2. Product Portfolio

            18.1.14.3. Profitability by Market Segments

            18.1.14.4. Sales Footprint

            18.1.14.5. Strategy Overview

                18.1.14.5.1. Marketing Strategy

        18.1.15. Stereotaxis Inc.

            18.1.15.1. Overview

            18.1.15.2. Product Portfolio

            18.1.15.3. Profitability by Market Segments

            18.1.15.4. Sales Footprint

            18.1.15.5. Strategy Overview

                18.1.15.5.1. Marketing Strategy

19. Assumptions & Acronyms Used

20. Research Methodology

Don't pay for what you don't need

Customize your report by selecting specific countries or regions and save 30%!

List of Tables

Table 1: Global Market Value (US$ Million) Forecast by Region, 2018 to 2033

Table 2: Global Market Value (US$ Million) Forecast by Product Type, 2018 to 2033

Table 3: Global Market Value (US$ Million) Forecast by Indication, 2018 to 2033

Table 4: Global Market Value (US$ Million) Forecast by End-User , 2018 to 2033

Table 5: North America Market Value (US$ Million) Forecast by Country, 2018 to 2033

Table 6: North America Market Value (US$ Million) Forecast by Product Type, 2018 to 2033

Table 7: North America Market Value (US$ Million) Forecast by Indication, 2018 to 2033

Table 8: North America Market Value (US$ Million) Forecast by End-User , 2018 to 2033

Table 9: Latin America Market Value (US$ Million) Forecast by Country, 2018 to 2033

Table 10: Latin America Market Value (US$ Million) Forecast by Product Type, 2018 to 2033

Table 11: Latin America Market Value (US$ Million) Forecast by Indication, 2018 to 2033

Table 12: Latin America Market Value (US$ Million) Forecast by End-User , 2018 to 2033

Table 13: Europe Market Value (US$ Million) Forecast by Country, 2018 to 2033

Table 14: Europe Market Value (US$ Million) Forecast by Product Type, 2018 to 2033

Table 15: Europe Market Value (US$ Million) Forecast by Indication, 2018 to 2033

Table 16: Europe Market Value (US$ Million) Forecast by End-User , 2018 to 2033

Table 17: South Asia Market Value (US$ Million) Forecast by Country, 2018 to 2033

Table 18: South Asia Market Value (US$ Million) Forecast by Product Type, 2018 to 2033

Table 19: South Asia Market Value (US$ Million) Forecast by Indication, 2018 to 2033

Table 20: South Asia Market Value (US$ Million) Forecast by End-User , 2018 to 2033

Table 21: East Asia Market Value (US$ Million) Forecast by Country, 2018 to 2033

Table 22: East Asia Market Value (US$ Million) Forecast by Product Type, 2018 to 2033

Table 23: East Asia Market Value (US$ Million) Forecast by Indication, 2018 to 2033

Table 24: East Asia Market Value (US$ Million) Forecast by End-User , 2018 to 2033

Table 25: Oceania Market Value (US$ Million) Forecast by Country, 2018 to 2033

Table 26: Oceania Market Value (US$ Million) Forecast by Product Type, 2018 to 2033

Table 27: Oceania Market Value (US$ Million) Forecast by Indication, 2018 to 2033

Table 28: Oceania Market Value (US$ Million) Forecast by End-User , 2018 to 2033

Table 29: Middle East and Africa Market Value (US$ Million) Forecast by Country, 2018 to 2033

Table 30: Middle East and Africa Market Value (US$ Million) Forecast by Product Type, 2018 to 2033

Table 31: Middle East and Africa Market Value (US$ Million) Forecast by Indication, 2018 to 2033

Table 32: Middle East and Africa Market Value (US$ Million) Forecast by End-User , 2018 to 2033
Sabyasachi Ghosh
Sabyasachi Ghosh

Principal Consultant

Talk to Analyst

Find your sweet spots for generating winning opportunities in this market.

List of Charts

Figure 1: Global Market Value (US$ Million) by Product Type, 2023 to 2033

Figure 2: Global Market Value (US$ Million) by Indication, 2023 to 2033

Figure 3: Global Market Value (US$ Million) by End-User , 2023 to 2033

Figure 4: Global Market Value (US$ Million) by Region, 2023 to 2033

Figure 5: Global Market Value (US$ Million) Analysis by Region, 2018 to 2033

Figure 6: Global Market Value Share (%) and BPS Analysis by Region, 2023 to 2033

Figure 7: Global Market Y-o-Y Growth (%) Projections by Region, 2023 to 2033

Figure 8: Global Market Value (US$ Million) Analysis by Product Type, 2018 to 2033

Figure 9: Global Market Value Share (%) and BPS Analysis by Product Type, 2023 to 2033

Figure 10: Global Market Y-o-Y Growth (%) Projections by Product Type, 2023 to 2033

Figure 11: Global Market Value (US$ Million) Analysis by Indication, 2018 to 2033

Figure 12: Global Market Value Share (%) and BPS Analysis by Indication, 2023 to 2033

Figure 13: Global Market Y-o-Y Growth (%) Projections by Indication, 2023 to 2033

Figure 14: Global Market Value (US$ Million) Analysis by End-User , 2018 to 2033

Figure 15: Global Market Value Share (%) and BPS Analysis by End-User , 2023 to 2033

Figure 16: Global Market Y-o-Y Growth (%) Projections by End-User , 2023 to 2033

Figure 17: Global Market Attractiveness by Product Type, 2023 to 2033

Figure 18: Global Market Attractiveness by Indication, 2023 to 2033

Figure 19: Global Market Attractiveness by End-User , 2023 to 2033

Figure 20: Global Market Attractiveness by Region, 2023 to 2033

Figure 21: North America Market Value (US$ Million) by Product Type, 2023 to 2033

Figure 22: North America Market Value (US$ Million) by Indication, 2023 to 2033

Figure 23: North America Market Value (US$ Million) by End-User , 2023 to 2033

Figure 24: North America Market Value (US$ Million) by Country, 2023 to 2033

Figure 25: North America Market Value (US$ Million) Analysis by Country, 2018 to 2033

Figure 26: North America Market Value Share (%) and BPS Analysis by Country, 2023 to 2033

Figure 27: North America Market Y-o-Y Growth (%) Projections by Country, 2023 to 2033

Figure 28: North America Market Value (US$ Million) Analysis by Product Type, 2018 to 2033

Figure 29: North America Market Value Share (%) and BPS Analysis by Product Type, 2023 to 2033

Figure 30: North America Market Y-o-Y Growth (%) Projections by Product Type, 2023 to 2033

Figure 31: North America Market Value (US$ Million) Analysis by Indication, 2018 to 2033

Figure 32: North America Market Value Share (%) and BPS Analysis by Indication, 2023 to 2033

Figure 33: North America Market Y-o-Y Growth (%) Projections by Indication, 2023 to 2033

Figure 34: North America Market Value (US$ Million) Analysis by End-User , 2018 to 2033

Figure 35: North America Market Value Share (%) and BPS Analysis by End-User , 2023 to 2033

Figure 36: North America Market Y-o-Y Growth (%) Projections by End-User , 2023 to 2033

Figure 37: North America Market Attractiveness by Product Type, 2023 to 2033

Figure 38: North America Market Attractiveness by Indication, 2023 to 2033

Figure 39: North America Market Attractiveness by End-User , 2023 to 2033

Figure 40: North America Market Attractiveness by Country, 2023 to 2033

Figure 41: Latin America Market Value (US$ Million) by Product Type, 2023 to 2033

Figure 42: Latin America Market Value (US$ Million) by Indication, 2023 to 2033

Figure 43: Latin America Market Value (US$ Million) by End-User , 2023 to 2033

Figure 44: Latin America Market Value (US$ Million) by Country, 2023 to 2033

Figure 45: Latin America Market Value (US$ Million) Analysis by Country, 2018 to 2033

Figure 46: Latin America Market Value Share (%) and BPS Analysis by Country, 2023 to 2033

Figure 47: Latin America Market Y-o-Y Growth (%) Projections by Country, 2023 to 2033

Figure 48: Latin America Market Value (US$ Million) Analysis by Product Type, 2018 to 2033

Figure 49: Latin America Market Value Share (%) and BPS Analysis by Product Type, 2023 to 2033

Figure 50: Latin America Market Y-o-Y Growth (%) Projections by Product Type, 2023 to 2033

Figure 51: Latin America Market Value (US$ Million) Analysis by Indication, 2018 to 2033

Figure 52: Latin America Market Value Share (%) and BPS Analysis by Indication, 2023 to 2033

Figure 53: Latin America Market Y-o-Y Growth (%) Projections by Indication, 2023 to 2033

Figure 54: Latin America Market Value (US$ Million) Analysis by End-User , 2018 to 2033

Figure 55: Latin America Market Value Share (%) and BPS Analysis by End-User , 2023 to 2033

Figure 56: Latin America Market Y-o-Y Growth (%) Projections by End-User , 2023 to 2033

Figure 57: Latin America Market Attractiveness by Product Type, 2023 to 2033

Figure 58: Latin America Market Attractiveness by Indication, 2023 to 2033

Figure 59: Latin America Market Attractiveness by End-User , 2023 to 2033

Figure 60: Latin America Market Attractiveness by Country, 2023 to 2033

Figure 61: Europe Market Value (US$ Million) by Product Type, 2023 to 2033

Figure 62: Europe Market Value (US$ Million) by Indication, 2023 to 2033

Figure 63: Europe Market Value (US$ Million) by End-User , 2023 to 2033

Figure 64: Europe Market Value (US$ Million) by Country, 2023 to 2033

Figure 65: Europe Market Value (US$ Million) Analysis by Country, 2018 to 2033

Figure 66: Europe Market Value Share (%) and BPS Analysis by Country, 2023 to 2033

Figure 67: Europe Market Y-o-Y Growth (%) Projections by Country, 2023 to 2033

Figure 68: Europe Market Value (US$ Million) Analysis by Product Type, 2018 to 2033

Figure 69: Europe Market Value Share (%) and BPS Analysis by Product Type, 2023 to 2033

Figure 70: Europe Market Y-o-Y Growth (%) Projections by Product Type, 2023 to 2033

Figure 71: Europe Market Value (US$ Million) Analysis by Indication, 2018 to 2033

Figure 72: Europe Market Value Share (%) and BPS Analysis by Indication, 2023 to 2033

Figure 73: Europe Market Y-o-Y Growth (%) Projections by Indication, 2023 to 2033

Figure 74: Europe Market Value (US$ Million) Analysis by End-User , 2018 to 2033

Figure 75: Europe Market Value Share (%) and BPS Analysis by End-User , 2023 to 2033

Figure 76: Europe Market Y-o-Y Growth (%) Projections by End-User , 2023 to 2033

Figure 77: Europe Market Attractiveness by Product Type, 2023 to 2033

Figure 78: Europe Market Attractiveness by Indication, 2023 to 2033

Figure 79: Europe Market Attractiveness by End-User , 2023 to 2033

Figure 80: Europe Market Attractiveness by Country, 2023 to 2033

Figure 81: South Asia Market Value (US$ Million) by Product Type, 2023 to 2033

Figure 82: South Asia Market Value (US$ Million) by Indication, 2023 to 2033

Figure 83: South Asia Market Value (US$ Million) by End-User , 2023 to 2033

Figure 84: South Asia Market Value (US$ Million) by Country, 2023 to 2033

Figure 85: South Asia Market Value (US$ Million) Analysis by Country, 2018 to 2033

Figure 86: South Asia Market Value Share (%) and BPS Analysis by Country, 2023 to 2033

Figure 87: South Asia Market Y-o-Y Growth (%) Projections by Country, 2023 to 2033

Figure 88: South Asia Market Value (US$ Million) Analysis by Product Type, 2018 to 2033

Figure 89: South Asia Market Value Share (%) and BPS Analysis by Product Type, 2023 to 2033

Figure 90: South Asia Market Y-o-Y Growth (%) Projections by Product Type, 2023 to 2033

Figure 91: South Asia Market Value (US$ Million) Analysis by Indication, 2018 to 2033

Figure 92: South Asia Market Value Share (%) and BPS Analysis by Indication, 2023 to 2033

Figure 93: South Asia Market Y-o-Y Growth (%) Projections by Indication, 2023 to 2033

Figure 94: South Asia Market Value (US$ Million) Analysis by End-User , 2018 to 2033

Figure 95: South Asia Market Value Share (%) and BPS Analysis by End-User , 2023 to 2033

Figure 96: South Asia Market Y-o-Y Growth (%) Projections by End-User , 2023 to 2033

Figure 97: South Asia Market Attractiveness by Product Type, 2023 to 2033

Figure 98: South Asia Market Attractiveness by Indication, 2023 to 2033

Figure 99: South Asia Market Attractiveness by End-User , 2023 to 2033

Figure 100: South Asia Market Attractiveness by Country, 2023 to 2033

Figure 101: East Asia Market Value (US$ Million) by Product Type, 2023 to 2033

Figure 102: East Asia Market Value (US$ Million) by Indication, 2023 to 2033

Figure 103: East Asia Market Value (US$ Million) by End-User , 2023 to 2033

Figure 104: East Asia Market Value (US$ Million) by Country, 2023 to 2033

Figure 105: East Asia Market Value (US$ Million) Analysis by Country, 2018 to 2033

Figure 106: East Asia Market Value Share (%) and BPS Analysis by Country, 2023 to 2033

Figure 107: East Asia Market Y-o-Y Growth (%) Projections by Country, 2023 to 2033

Figure 108: East Asia Market Value (US$ Million) Analysis by Product Type, 2018 to 2033

Figure 109: East Asia Market Value Share (%) and BPS Analysis by Product Type, 2023 to 2033

Figure 110: East Asia Market Y-o-Y Growth (%) Projections by Product Type, 2023 to 2033

Figure 111: East Asia Market Value (US$ Million) Analysis by Indication, 2018 to 2033

Figure 112: East Asia Market Value Share (%) and BPS Analysis by Indication, 2023 to 2033

Figure 113: East Asia Market Y-o-Y Growth (%) Projections by Indication, 2023 to 2033

Figure 114: East Asia Market Value (US$ Million) Analysis by End-User , 2018 to 2033

Figure 115: East Asia Market Value Share (%) and BPS Analysis by End-User , 2023 to 2033

Figure 116: East Asia Market Y-o-Y Growth (%) Projections by End-User , 2023 to 2033

Figure 117: East Asia Market Attractiveness by Product Type, 2023 to 2033

Figure 118: East Asia Market Attractiveness by Indication, 2023 to 2033

Figure 119: East Asia Market Attractiveness by End-User , 2023 to 2033

Figure 120: East Asia Market Attractiveness by Country, 2023 to 2033

Figure 121: Oceania Market Value (US$ Million) by Product Type, 2023 to 2033

Figure 122: Oceania Market Value (US$ Million) by Indication, 2023 to 2033

Figure 123: Oceania Market Value (US$ Million) by End-User , 2023 to 2033

Figure 124: Oceania Market Value (US$ Million) by Country, 2023 to 2033

Figure 125: Oceania Market Value (US$ Million) Analysis by Country, 2018 to 2033

Figure 126: Oceania Market Value Share (%) and BPS Analysis by Country, 2023 to 2033

Figure 127: Oceania Market Y-o-Y Growth (%) Projections by Country, 2023 to 2033

Figure 128: Oceania Market Value (US$ Million) Analysis by Product Type, 2018 to 2033

Figure 129: Oceania Market Value Share (%) and BPS Analysis by Product Type, 2023 to 2033

Figure 130: Oceania Market Y-o-Y Growth (%) Projections by Product Type, 2023 to 2033

Figure 131: Oceania Market Value (US$ Million) Analysis by Indication, 2018 to 2033

Figure 132: Oceania Market Value Share (%) and BPS Analysis by Indication, 2023 to 2033

Figure 133: Oceania Market Y-o-Y Growth (%) Projections by Indication, 2023 to 2033

Figure 134: Oceania Market Value (US$ Million) Analysis by End-User , 2018 to 2033

Figure 135: Oceania Market Value Share (%) and BPS Analysis by End-User , 2023 to 2033

Figure 136: Oceania Market Y-o-Y Growth (%) Projections by End-User , 2023 to 2033

Figure 137: Oceania Market Attractiveness by Product Type, 2023 to 2033

Figure 138: Oceania Market Attractiveness by Indication, 2023 to 2033

Figure 139: Oceania Market Attractiveness by End-User , 2023 to 2033

Figure 140: Oceania Market Attractiveness by Country, 2023 to 2033

Figure 141: Middle East and Africa Market Value (US$ Million) by Product Type, 2023 to 2033

Figure 142: Middle East and Africa Market Value (US$ Million) by Indication, 2023 to 2033

Figure 143: Middle East and Africa Market Value (US$ Million) by End-User , 2023 to 2033

Figure 144: Middle East and Africa Market Value (US$ Million) by Country, 2023 to 2033

Figure 145: Middle East and Africa Market Value (US$ Million) Analysis by Country, 2018 to 2033

Figure 146: Middle East and Africa Market Value Share (%) and BPS Analysis by Country, 2023 to 2033

Figure 147: Middle East and Africa Market Y-o-Y Growth (%) Projections by Country, 2023 to 2033

Figure 148: Middle East and Africa Market Value (US$ Million) Analysis by Product Type, 2018 to 2033

Figure 149: Middle East and Africa Market Value Share (%) and BPS Analysis by Product Type, 2023 to 2033

Figure 150: Middle East and Africa Market Y-o-Y Growth (%) Projections by Product Type, 2023 to 2033

Figure 151: Middle East and Africa Market Value (US$ Million) Analysis by Indication, 2018 to 2033

Figure 152: Middle East and Africa Market Value Share (%) and BPS Analysis by Indication, 2023 to 2033

Figure 153: Middle East and Africa Market Y-o-Y Growth (%) Projections by Indication, 2023 to 2033

Figure 154: Middle East and Africa Market Value (US$ Million) Analysis by End-User , 2018 to 2033

Figure 155: Middle East and Africa Market Value Share (%) and BPS Analysis by End-User , 2023 to 2033

Figure 156: Middle East and Africa Market Y-o-Y Growth (%) Projections by End-User , 2023 to 2033

Figure 157: Middle East and Africa Market Attractiveness by Product Type, 2023 to 2033

Figure 158: Middle East and Africa Market Attractiveness by Indication, 2023 to 2033

Figure 159: Middle East and Africa Market Attractiveness by End-User , 2023 to 2033

Figure 160: Middle East and Africa Market Attractiveness by Country, 2023 to 2033

Recommendations

Testing Equipment

Electrophoresis Equipment and Supplies Market

Published : February 2023

Healthcare

Electrophysiology Equipment and Recording Systems Market

Published : November 2022

Explore Healthcare Insights

View Reports