Flurpiridaz Market Size and Share Forecast Outlook 2025 to 2035

The Flurpiridaz Market has been forecasted to attain a valuation of USD 546.9 million in 2025, rising to USD 1,202.6 million by 2035, resulting in an incremental gain of USD 655.8 million, which reflects a 45.5% increase over the forecast decade. A compound annual growth rate (CAGR) of 12.1% is expected to be recorded, indicating a rapid expansion trajectory for the flurpiridaz market.
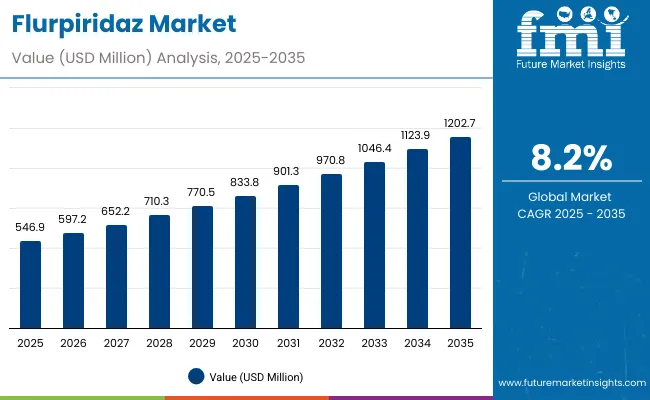
Flurpiridaz Market 1

Flurpiridaz Market Key Takeaways

Metric Value
Flurpiridaz Market Estimated Value in (2025E) USD 546.9 million
Flurpiridaz Market Forecast Value in (2035F) USD 1,202.6 million
Forecast CAGR (2025 to 2035) 8.2%

Between 2025 and 2030, Flurpiridaz will gain broader adoption across advanced cardiology centers, hospitals, and PET imaging facilities, as clinicians increasingly rely on high-resolution PET myocardial perfusion imaging to improve diagnostic accuracy in patients with suspected coronary artery disease. It will grow up to USD 264.1 million in that period from USD 546.9 million in 2025 to USD 811.0 million in 2030. The convergence of regulatory approvals, expanding reimbursement coverage, and the rising installed base of PET/CT scanners is making Flurpiridaz more accessible, prompting uptake even in mid-tier hospitals and regional imaging networks.

Between 2030 and 2035, the market is projected to expand further by USD 391.7million, driven by advances in automated radiopharmaceutical production, broader distribution infrastructure, and integration of AI-powered cardiac image analysis. Demand will rise from both developed healthcare systems and emerging markets, as cardiologists and nuclear medicine specialists adopt Flurpiridaz for its superior image quality, lower radiation dose, and improved prognostic value compared with conventional SPECT tracers. Continuous progress in cyclotron technologies, logistics networks, and hybrid PET/MR imaging will shape the next generation of cardiac PET diagnostics.

From 2020 to 2024, the flurpiridaz market, expanded from USD 353.8 million to USD 508.6 million, as pivotal trial data validated its clinical superiority and manufacturers invested in production capabilities. During this phase, global radiopharmaceutical companies partnered with academic medical centers to streamline synthesis processes, ensure dose stability, and establish efficient supply chain pathways laying the foundation for large-scale commercial rollout.

Going forward, the Flurpiridaz ecosystem will likely evolve to incorporate real-time quantitative perfusion analysis, AI-enhanced diagnostic workflows, and hybrid compatibility with PET/MR systems. These innovations aim to reduce variability in cardiac imaging, expand usability across diverse healthcare environments, and improve patient throughput making Flurpiridaz a cornerstone tracer in the global nuclear cardiology landscape.

Why the Flurpiridaz Market is growing?

The growth of the Flurpiridaz Market is reinforced by the unique clinical value of this PET myocardial perfusion imaging (MPI) tracer in diagnosing coronary artery disease (CAD) the world’s leading cause of mortality. In contrast to conventional SPECT tracers, Flurpiridaz provides higher image resolution, improved sensitivity for detecting perfusion defects, and more accurate quantification of blood flow, making it indispensable for modern cardiovascular imaging.

Over the last decade, the scope of Flurpiridaz has expanded beyond early-phase trials into broad clinical readiness. It is now positioned as a critical diagnostic tool in cardiology, enabling earlier and more precise detection of ischemia, particularly in patients with multi-vessel disease or obesity, where SPECT accuracy declines. As cardiovascular disease prevalence rises globally and health systems seek more reliable, lower-radiation diagnostic solutions, Flurpiridaz is emerging as a next-generation standard for myocardial perfusion imaging.

Another factor driving adoption is the transition from limited research-center availability to scalable, commercial production. With radiopharmaceutical companies investing in distribution infrastructure, automated synthesis modules, and cyclotron capacity, Flurpiridaz can now be deployed widely across PET/CT facilities. This decentralization is transforming its accessibility, particularly in healthcare systems expanding nuclear cardiology capabilities.

Moreover, increasing demand from complementary fields including personalized medicine, quantitative perfusion analysis, and hybrid PET/MR imaging is fostering the integration of Flurpiridaz into AI-powered diagnostic workflows. These advances cater to the growing need for precision, efficiency, and reproducibility in cardiovascular care.

Collectively, these clinical and technological drivers are positioning the Flurpiridaz market for sustained expansion, fueled by its essential role in improving cardiac diagnostics and enabling better patient outcomes in the era of precision medicine.

Segmental Analysis

The market is segmented by technology, application, end user, and region. Technology includes PET MPI (positron emission tomography myocardial perfusion imaging), PET/CT systems, and PET/MR systems. Application covers coronary artery disease (CAD) diagnosis, myocardial ischemia and infarction assessment, and advanced cardiac diagnostics. Based on end user, the segmentation includes hospitals and medical centers, diagnostic imaging centers, independent PET imaging centers, outpatient diagnostic centers, research institutions and academic centers, and government and defense medical facilities. Regionally, the scope spans North America, Latin America, Western and Eastern Europe, East Asia, South Asia and Pacific, and the Middle East and Africa.
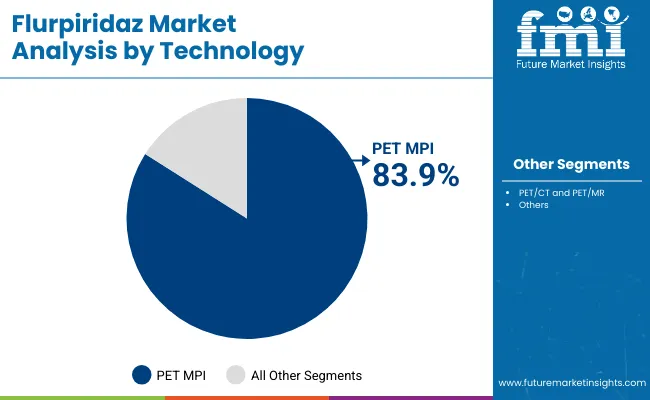
Insights into the technology segment with PET MPI (Positron Emission Tomography Myocardial Perfusion Imaging) leading the market

Flurpiridaz Market By Technology

Technology Market Value Share, 2025
PET MPI (Positron Emission Tomography Myocardial Perfusion Imaging) 83.9%
PET/CT and PET/MR 16.1%

PET MPI (positron emission tomography myocardial perfusion imaging) is projected to lead the technology category with an 83.9% market share in 2025, and is expected to maintain this position due to its ability to provide high-resolution, quantitative assessment of myocardial blood flow. Unlike conventional SPECT imaging, PET MPI offers superior spatial resolution, higher sensitivity, and more accurate perfusion quantification allowing cardiologists to detect subtle ischemic changes and multi-vessel disease with unprecedented precision.

Recent advances in radiotracer production, including automated synthesis modules for flurpiridaz, combined with optimized PET scanner calibration and image reconstruction algorithms, have enabled these systems to deliver consistent, reproducible results across clinical settings. Moreover, integration with advanced software for AI-assisted perfusion analysis allows clinicians to assess myocardial function, ischemia, and infarction risk in real time making PET MPI indispensable for modern cardiac diagnostics.

A key factor behind their dominance is their widespread adoption in hospitals, diagnostic imaging centers, and specialized PET facilities. With commercial vendors now offering turnkey systems that simplify workflow and tracer handling, PET MPI is becoming increasingly accessible to mid-tier hospitals and regional cardiology centers. Its relatively lower radiation dose and faster acquisition times further position it as the preferred imaging modality for precision cardiology.

As cardiovascular disease prevalence continues to rise and personalized medicine gains prominence, the diagnostic accuracy, workflow efficiency, and quantitative capabilities of PET MPI ensure that it remains the backbone of cardiac perfusion imaging across clinical and research settings alike.
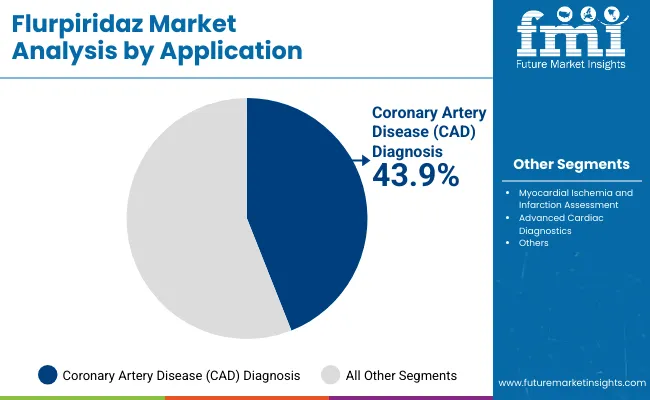
Insights into the application segment withCoronary Artery Disease (CAD) diagnosis dominating the market

Flurpiridaz Market By Application

Application Market Value Share, 2025
Coronary Artery Disease (CAD) Diagnosis 43.9%
Myocardial Ischemia and Infarction Assessment 37.0%
Advanced Cardiac Diagnostics 19.1%

Coronary artery disease (CAD) diagnosis continues to dominate the application landscape, accounting for 43.9% of total demand in 2025. This application remains the foundation of cardiac imaging due to Flurpiridaz PET MPI’s proven ability to detect perfusion defects, quantify myocardial blood flow, and assess ischemic burden with high sensitivity and spatial resolution. As an essential tool in modern cardiology, Flurpiridaz provides unmatched insight into patient-specific coronary physiology, enabling clinicians to make informed treatment decisions.

What makes Flurpiridaz indispensable in CAD diagnosis is its reproducibility, quantitative accuracy, and established clinical validation? Many hospitals and imaging centers have developed expertise in PET MPI workflows, and longitudinal studies using Flurpiridaz have created extensive datasets that support comparative assessments, risk stratification, and prognostic evaluation. The tracer is particularly effective in patients with multi-vessel disease, obesity, or prior revascularization, where conventional SPECT imaging may be less reliable.

Recent improvements in tracer distribution networks, PET scanner calibration, and image reconstruction algorithms have further enhanced the resolution, usability, and clinical throughput of Flurpiridaz for CAD assessment. Moreover, cardiology training programs and nuclear medicine curricula continue to emphasize PET MPI with Flurpiridaz as a primary diagnostic modality, ensuring a steady pipeline of skilled operators and adoption in clinical practice.

While applications such as myocardial ischemia and infarction assessment and advanced cardiac diagnostics are growing, CAD diagnosis remains the mainstay of the global Flurpiridaz market, largely due to its clinical impact, diagnostic accuracy, and broad compatibility across hospitals, imaging centers, and research institutions.

What are the Drivers, Restraints, and Key Trends of the Flurpiridaz Market?

The adoption of Flurpiridaz in cardiac imaging is accelerating as clinical and technological advancements converge to improve the detection and assessment of myocardial perfusion. While demand is growing, the market faces structural challenges due to regulatory complexities, high development costs, and the need for specialized imaging infrastructure.

Rising prevalence of cardiovascular diseases

Cardiovascular diseases (CVDs) remain the leading cause of mortality, with coronary artery disease (CAD) representing a significant portion of the global burden. The increasing incidence of CAD, myocardial ischemia, and related complications has created an urgent need for early, accurate, and non-invasive diagnostic solutions. Flurpiridaz, as a PET myocardial perfusion imaging (MPI) tracer, offers superior spatial resolution and quantitative perfusion assessment compared with conventional SPECT tracers, enabling precise evaluation of blood flow, ischemia, and infarction risk. Clinicians rely on these capabilities for early detection, risk stratification, and treatment planning, particularly in high-risk patients, multi-vessel disease cases, and populations where SPECT imaging is less reliable, such as obese patients. Moreover, the global shift toward personalized medicine is further driving the adoption of advanced imaging modalities that provide patient-specific insights. Hospitals, diagnostic imaging centers, and research institutions increasingly prefer Flurpiridaz due to its reproducibility, validated efficacy, and ability to improve clinical decision-making. As the prevalence of CVD continues to rise exacerbated by aging populations, sedentary lifestyles, and comorbidities such as diabetes and hypertension the demand for Flurpiridaz is expected to expand steadily, positioning it as a key tool in modern cardiac diagnostics.

Integration of AI-powered image analysis with PET imaging

AI-powered image analysis enhances the accuracy, reproducibility, and efficiency of cardiac diagnostics by automating the quantification of myocardial perfusion, ventricular function, and ischemic burden. This reduces inter-observer variability and allows clinicians to detect subtle perfusion defects that may be overlooked using conventional methods. Additionally, AI integration enables real-time image reconstruction and predictive analytics, supporting faster diagnosis and better patient management. Coupled with hybrid PET/CT and PET/MR systems, AI tools can combine anatomical and functional information, providing a comprehensive assessment of cardiac health in a single session. Research institutions and advanced hospitals are increasingly leveraging these capabilities for both clinical applications and cardiac research, driving adoption of Flurpiridaz as part of next-generation diagnostic workflows. Furthermore, the trend toward remote and cloud-based AI platforms allows smaller facilities to access advanced image analysis without significant infrastructure investments, potentially expanding the tracer’s reach.

High costs and limited PET infrastructure

PET scanners and PET/CT or PET/MR hybrid systems require substantial capital investment, making them inaccessible to smaller hospitals, regional imaging centers, and facilities in emerging markets. In addition, production of Flurpiridaz relies on cyclotron-generated radiotracers, which necessitates specialized infrastructure, maintenance, and highly trained personnel for synthesis, quality control, and safe handling. The need for robust distribution networks, cold-chain storage, and rapid delivery further complicates widespread deployment. These factors collectively increase the overall cost of the procedure for healthcare providers and patients, limiting adoption despite the tracer’s clinical benefits. Moreover, in regions with underdeveloped nuclear medicine infrastructure, the lack of trained nuclear medicine physicians, technologists, and radiopharmacists restricts effective utilization. Regulatory requirements and licensing for radioactive materials can also slow market penetration. As a result, while demand is growing in well-equipped urban centers and advanced healthcare systems, high infrastructure costs and limited access in smaller hospitals or rural areas remain significant restraints for the Flurpiridaz market.
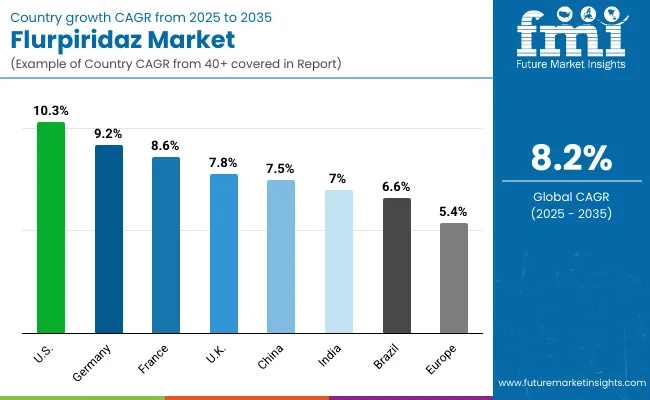
Analysis of Flurpiridaz Market, By Key Countries

Country Wise Flurpiridaz Market

Country CAGR
USA 10.3%
Brazil 6.6%
China 7.5%
India 7.0%
Europe 6.9%
Germany 9.2%
France 8.6%
UK 7.8%

The adoption and growth patterns of Flurpiridaz in the United States exhibit distinct variations across different healthcare settings, influenced by the maturity of medical infrastructure, regulatory support, and demand for advanced cardiac imaging.

In the United States, the Flurpiridaz market is characterized by strong growth driven by a robust network of nuclear cardiology centers, leading academic hospitals, and ongoing government- and industry-funded clinical research. The availability of state-of-the-art PET imaging systems and increasing focus on non-invasive, high-accuracy myocardial perfusion imaging supports widespread adoption. The presence of specialized cardiac research programs and continuous investments in cardiovascular diagnostics propels demand for Flurpiridaz, particularly in areas like early detection of coronary artery disease and precise assessment of myocardial perfusion. The market here is projected to grow at a CAGR of 10.3%.

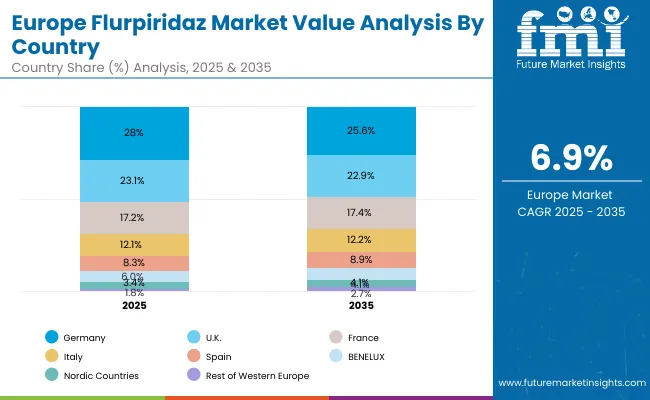
In Europe, countries such as Germany, France, and the UK lead the Flurpiridaz market with growing emphasis on integrating advanced cardiac imaging agents within national healthcare initiatives and cardiovascular research programs. Government-backed clinical studies, reimbursement support, and investment in state-of-the-art PET imaging infrastructure have facilitated collaboration among hospitals, academic institutions, and diagnostic centers, enabling the adoption of Flurpiridaz for precise myocardial perfusion assessment. Regulatory frameworks that support innovative imaging solutions and strategic funding for cardiovascular care foster sustained market growth, though adoption remains measured as clinical familiarity and long-term outcomes continue to accumulate. The market in Germany is expected to expand at a CAGR of 9.2%, France at 8.6%, and the UK at 7.8%.

Overall, the European Flurpiridaz market reflects a strategic combination of clinical need, healthcare policy alignment, and institutional investment, which together govern the pace and scale of adoption across countries. This dynamic interplay underscores the central role that regional regulatory frameworks, imaging infrastructure, and clinical expertise play in shaping the trajectory of this next-generation cardiac imaging agent.
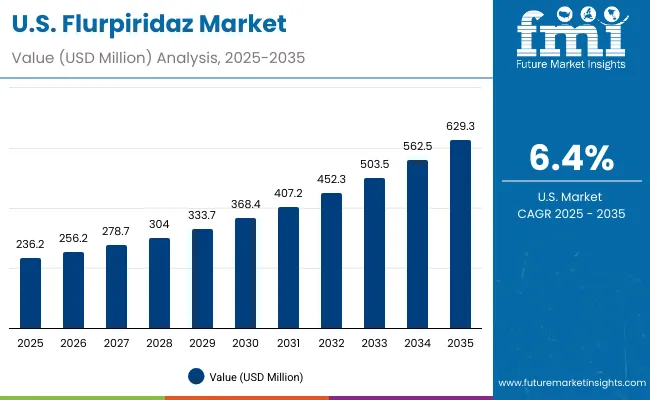
Sales Outlook for Flurpiridaz in the United States

Usa Flurpiridaz Market

The Flurpiridaz market in the United States has been forecasted to expand at a CAGR of 10.3% between 2025 and 2035. The USA remains the most mature and research-intensive market for cardiac PET imaging agents, with widespread integration into nuclear cardiology programs and advanced cardiac diagnostic centers. Cleveland Clinic, Mayo Clinic, and Johns Hopkins Hospital, alongside government-supported research initiatives, have been pivotal in establishing clinical protocols and validating Flurpiridaz for myocardial perfusion imaging. The availability of state-of-the-art PET/CT systems and advanced radiopharmacy facilities ensures reliable access to Flurpiridaz across diagnostic networks.

  • Increasing awareness of the advantages of PET over traditional SPECT imaging in terms of accuracy and reduced radiation exposure is driving demand.
  • USA vendors are developing AI-assisted PET software for automated perfusion quantification and image interpretation, improving diagnostic efficiency and reducing operator dependency.
  • Partnerships between cardiology, radiology, and nuclear medicine departments are expanding clinical studies and trials, supporting broader adoption and optimized patient workflows.

Growth and Expansion Outlook for Flurpiridaz Market in India

India's Flurpiridaz market is projected to grow at a CAGR of 7.0% from 2025 to 2035, making it one of the fastest-growing national markets for advanced cardiac imaging globally. This growth is driven by rising cardiovascular disease prevalence, expanding PET imaging infrastructure, and adoption of advanced nuclear cardiology workflows. India’s market growth is influenced by its dependency on imported radiopharmaceutical components, which directly links to global supply chains and availability of Flurpiridaz. Flurpiridaz is an F18 PET tracer, its production in India requires cyclotrons, hot cells, chemistry modules, and enriched target materials, most of which are imported from multinational suppliers. This creates a connection between India’s domestic adoption rate and the global production and distribution of Flurpiridaz.

  • India imports most of the high-precision cyclotrons and shielding units required for Flurpiridaz production, relying on global manufacturers such as GE HealthCare.
  • The synthesis modules and F-18 reagents necessary to label Flurpiridaz are sourced internationally, linking India’s tracer availability directly to global production capacity.
  • India’s inability to produce enriched oxygen targets domestically makes it dependent on foreign suppliers, which can impact timelines and cost for Flurpiridaz PET imaging.

Sales Outlook for Flurpiridaz in China

China’s Flurpiridaz market is projected to grow at a CAGR of 7.5% between 2025 and 2035. According to a 2024 survey published in the Journal of Nuclear Medicine, China had 1,148 nuclear medicine departments, representing a more than twofold increase over the past decade. This rapid expansion reflects significant growth in nuclear cardiology infrastructure, driven by rising cardiovascular disease prevalence, government initiatives to modernize healthcare, and increased investment in PET/CT imaging systems

  • The growing incidence of cardiovascular conditions in China is driving demand for advanced cardiac imaging, particularly PET myocardial perfusion studies. This creates increased domestic demand for Flurpiridaz, contributing to the expansion of the global Flurpiridaz market as manufacturers scale production to meet both local and international needs.
  • Policies like the "Healthy China 2030" plan support the expansion of nuclear medicine facilities, standardized imaging protocols, and capital investment in hospitals. By enhancing infrastructure and adoption rates, these initiatives position China as a key growth driver for the global Flurpiridaz market, influencing market penetration and regional sales.
  • Hospitals and diagnostic centers are deploying advanced PET/CT scanners, hybrid systems, and AI-assisted workflow solutions. This infrastructure supports efficient Flurpiridaz usage, higher patient throughput, and reliable myocardial perfusion assessments, thereby reinforcing China’s role as a significant contributor to the global Flurpiridaz market.
Country 2025
Germany 28.0%
UK 23.1%
France 17.2%
Italy 12.1%
Spain 8.3%
BENELUX 6.0%
Nordic Countries 3.4%
Rest of Western Europe 1.8%
Country 2035
Germany 25.6%
UK 22.9%
France 17.4%
Italy 12.2%
Spain 8.9%
BENELUX 6.3%
Nordic Countries 4.1%
Rest of Western Europe 2.7%

Growth and Expansion Outlook for Flurpiridaz Market in the United Kingdom

The Flurpiridaz market in the United Kingdom is projected to grow at a CAGR of 7.8% from 2025 to 2035. The country benefits from robust public investment in diagnostic infrastructure, including the 2025/26 NHS settlement, which allocated £1.65 billion to improve NHS performance, with £0.134 billion dedicated specifically to diagnostic networks. This funding supports the integration of advanced imaging modalities, including PET/CT scanners essential for myocardial perfusion studies.Flurpiridaz adoption is primarily concentrated in regions with established nuclear cardiology programs, supported by centralized distribution systems and coordinated training frameworks. Ongoing government initiatives facilitate the standardization of imaging protocols and knowledge sharing across institutions, enabling efficient implementation of PET imaging workflows.
  • Expansion of PET/CT capacity and modernization of existing diagnostic facilities to support high-resolution myocardial perfusion studies, increasing scan availability and throughput.
  • National programs that encourage consistent imaging protocols and operational efficiency across different regions, ensuring reproducible and high-quality diagnostic outcomes.
  • Structured training programs and knowledge-exchange initiatives that improve operational efficiency, reduce downtime, and accelerate clinical adoption of Flurpiridaz.

In-depth Analysis of Flurpiridaz in Germany

Europe Flurpiridaz Market

The Flurpiridaz market in Germany is projected to grow at a CAGR of 9.2% from 2025 to 2035, supported by increasing cardiovascular disease prevalence and strategic investments in nuclear cardiology infrastructure. The country’s advanced diagnostic imaging ecosystem enables widespread adoption of PET myocardial perfusion imaging, with emphasis on modernizing workflows and integrating high-resolution imaging capabilities.Growth is concentrated in regions with high diagnostic demand, including Bavaria, Baden-Württemberg, and North Rhine-Westphalia. National programs facilitate standardization of imaging protocols and the optimization of clinical workflows, while research initiatives provide access to cutting-edge imaging technologies for high-precision cardiac assessments.
  • Expansion and modernization of imaging facilities, with emphasis on high-throughput PET/CT systems for myocardial perfusion assessment.
  • Standardized imaging protocols and workflow optimization enhance throughput and reliability across clinical and research applications.
  • Capacity-building initiatives and knowledge-sharing programs strengthen operational efficiency and facilitate broader adoption of Flurpiridaz imaging across regions.

Growth Outlook for Flurpiridaz Market in Japan

Japan Flurpiridaz Market

Technology Market Value Share, 2025
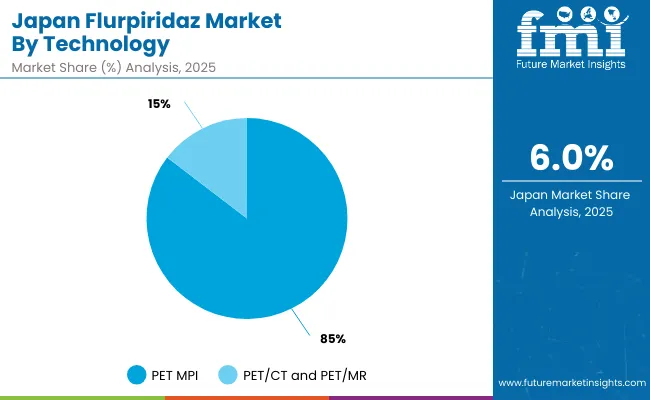
PET MPI (Positron Emission Tomography Myocardial Perfusion Imaging) 85.4%
PET/CT and PET/MR 14.6%

The Flurpiridaz Market in Japan has been projected to reach USD 15.86 million in 2025. Japan’s PET myocardial perfusion imaging (PET MPI) market is characterized by steady clinical demand, driven by the country’s focus on early detection of coronary artery disease, high standards of diagnostic quality, and widespread adoption of advanced imaging technologies. The market is dominated by PET MPI, due to its superior sensitivity and specificity for myocardial perfusion assessment compared to conventional SPECT imaging. While hybrid PET/CT and PET/MR systems are gradually increasing in adoption, as hospitals and diagnostic centers prioritize PET MPI for routine cardiac evaluation.The Japanese healthcare ecosystem includes highly regulated diagnostic centers and cardiology-focused institutions that maintain strict imaging protocols and standardized tracer usage. The market’s growth is supported by increasing cardiovascular disease prevalence, regulatory emphasis on high-quality diagnostic standards, and ongoing infrastructure upgrades in imaging facilities.
  • PET MPI holds 85.4% of the national cardiac imaging market.
  • PET/CT and PET/MR account for 14.6% of adoption, reflecting gradual integration of multimodal imaging.
  • Rising demand for early and accurate cardiac diagnosis, high clinical standards, and consistent investment in imaging infrastructure.

Opportunity Analysis of South Korea Flurpiridaz Market

South Korea Flurpiridaz Market

Application Market Value Share, 2025
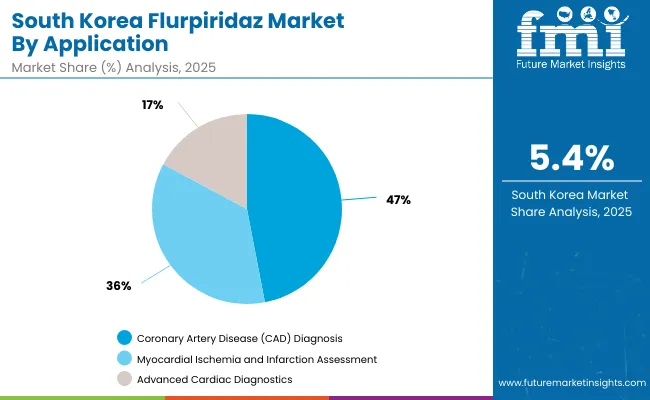
Coronary Artery Disease (CAD) Diagnosis 47.0%
Myocardial Ischemia and Infarction Assessment 35.8%
Advanced Cardiac Diagnostics 17.2%

The Flurpiridaz Market in South Korea has been projected to reach USD 10.39 million in 2025. South Korea’s cardiac imaging market is experiencing robust growth, driven by increasing prevalence of cardiovascular diseases and ongoing investment in advanced diagnostic infrastructure. The Coronary Artery Disease (CAD) Diagnosis segment leads the market, accounting for 47.0% of adoption, as accurate early detection remains a clinical priority. The Myocardial Ischemia and Infarction Assessment segment follows with 35.8% share, reflecting widespread use of PET MPI and related imaging techniques to guide treatment planning emphasizing high-quality cardiac care, standardized imaging protocols, and integration of advanced PET and hybrid imaging modalities in clinical workflows. The market’s steady growth is supported by rising demand for early and precise cardiovascular diagnosis, increasing infrastructure investment, and adherence to national and international clinical standards.
  • Market size for South Korea in 2025 is USD 10.39 million
  • Global market share is approximately 5.4%
  • Coronary Artery Disease (CAD) Diagnosislead the segment with 48.4%

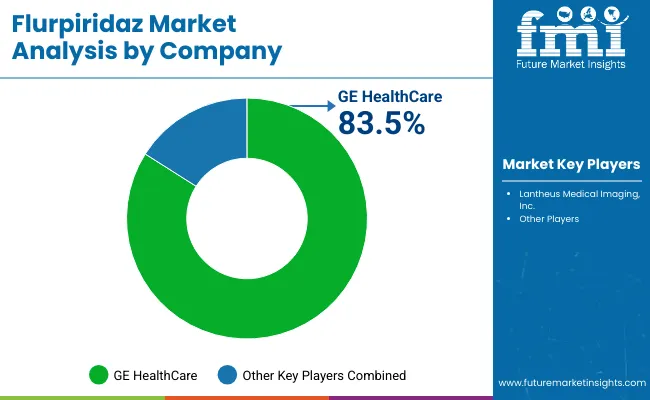
Competitive Landscape of Flurpiridaz Market

Flurpiridaz Market By Company

Company Value Share 2024
GE HealthCare 83.5%
Others 16.5%

The Flurpiridaz market is highly concentrated, with GE Healthcare holding a dominant global position due to its extensive portfolio of PET/CT imaging systems and integrated workflow solutions for myocardial perfusion imaging. The company’s market leadership is anchored in its ability to provide end-to-end imaging solutions, including optimized PET/CT hardware, AI-assisted analysis software, and standardized imaging protocols. GE Healthcare’s established presence in cardiovascular diagnostics and broad clinical support network further reinforces its dominant position in the market.

Other players in the market include Lantheus Medical Imaging, Inc., focused on radiotracer supply and niche cardiac imaging solutions, supporting adoption in specialized centers.

Key Developments in Flurpiridaz Market

  • On September 2024, GE HealthCare announced FDA approval of Flyrcado (flurpiridaz F 18) injection PET radiotracer for enhanced diagnosis of coronary artery disease, particularly benefiting patient populations that are traditionally difficult to image, including women and individuals with high body mass index (BMI).
  • On April 2017, Lantheus Medical Imaging, Inc., and GE Healthcare formalized a definitive license agreement to advance the Phase III development and global commercialization of flurpiridaz F-18. The radiotracer, an investigational positron emission tomography (PET) agent for myocardial perfusion imaging (MPI), is designed to enhance the detection and diagnosis of coronary artery disease.

Scope of the Report

Item Value
Quantitative Units USD 546.9 million
By Technology PET MPI (Positron Emission Tomography Myocardial Perfusion Imaging), PET/CT and PET/MR
Application Type Coronary Artery Disease (CAD) Diagnosis, Myocardial Ischemia and Infarction Assessment, Advanced Cardiac Diagnostics
End User Hospitals and Medical Centers, Diagnostic Imaging Centers, Independent PET Imaging Centers, Outpatient Diagnostic Centers, Research Institutions & Academic Centers, Government and Defense Medical Facilities
Regions Covered North America, Latin America, Western Europe, Eastern Europe, East Asia, South Asia & Pacific, Middle East & Africa
Countries Covered USA, Brazil, China, India, Europe, Germany, France and UK
Key Companies Profiled GE HealthCare, Lantheus Medical Imaging, Inc.

Key Segments

By Technology:

  • PET MPI (Positron Emission Tomography Myocardial Perfusion Imaging)
  • PET/CT and PET/MR

By Application:

  • Coronary Artery Disease (CAD) Diagnosis
  • Myocardial Ischemia and Infarction Assessment
  • Advanced Cardiac Diagnostics

By End User:

  • Hospitals and Medical Centers
  • Diagnostic Imaging Centers
  • Independent PET Imaging Centers
  • Outpatient Diagnostic Centers
  • Research Institutions & Academic Centers
  • Government and Defense Medical Facilities

By Region:

  • North America
  • Latin America
  • Western Europe
  • Eastern Europe
  • East Asia
  • South Asia
  • MEA

Table of Content

  1. Executive Summary
    • Global Market Outlook
    • Demand-side Trends
    • Supply-side Trends
    • Technology Roadmap Analysis
    • Analysis and Recommendations
  2. Market Overview
    • Market Coverage / Taxonomy
    • Market Definition / Scope / Limitations
  3. Market Background
    • Market Dynamics
      • Drivers
      • Restraints
      • Opportunity
      • Trends
    • Scenario Forecast
      • Demand in Optimistic Scenario
      • Demand in Likely Scenario
      • Demand in Conservative Scenario
    • Opportunity Map Analysis
    • Product Life Cycle Analysis
    • Technological Advancement
    • Investment Feasibility Matrix
    • PESTLE and Porter’s Analysis
    • Regulatory Landscape
  4. 3.9.1. By Key Regions
  5. 3.9.2. By Key Countries
    • Regional Parent Market Outlook
    • Recent Product Launches/Approvals
  6. Global Market Analysis 2020 to 2024 and Forecast, 2025 to 2035
    • Historical Market Size Value (USD Million) Analysis, 2020 to 2024
    • Current and Future Market Size Value (USD Million) Projections, 2025 to 2035
      • Y-o-Y Growth Trend Analysis
      • Absolute $ Opportunity Analysis
  7. Global Market Analysis 2020 to 2024 and Forecast 2025 to 2035, By Technology
    • Introduction / Key Findings
    • Historical Market Size Value (USD Million) Analysis By Technology, 2020 to 2024
    • Current and Future Market Size Value (USD Million) Analysis and Forecast By Technology, 2025 to 2035
      • PET MPI (Positron Emission Tomography Myocardial Perfusion Imaging)
      • PET/CT and PET/MR
    • Y-o-Y Growth Trend Analysis By Technology, 2020 to 2024
    • Absolute $ Opportunity Analysis By Technology, 2025 to 2035
  8. Global Market Analysis 2020 to 2024 and Forecast 2025 to 2035, By Application
    • Introduction / Key Findings
    • Historical Market Size Value (USD Million) Analysis By Application, 2020 to 2024
    • Current and Future Market Size Value (USD Million) Analysis and Forecast By Application, 2025 to 2035
      • Coronary Artery Disease (CAD) Diagnosis
      • Myocardial Ischemia and Infarction Assessment
      • Advanced Cardiac Diagnostics
    • Y-o-Y Growth Trend Analysis By Application, 2020 to 2024
    • Absolute $ Opportunity Analysis By Application, 2025 to 2035
  9. Global Market Analysis 2020 to 2024 and Forecast 2025 to 2035, By End User
    • Introduction / Key Findings
    • Historical Market Size Value (USD Million) Analysis By End User, 2020 to 2024
    • Current and Future Market Size Value (USD Million) Analysis and Forecast By End User, 2025 to 2035
      • Hospitals and Medical Centers
      • Diagnostic Imaging Centers
      • Independent PET Imaging Centers
      • Outpatient Diagnostic Centers
      • Research Institutions & Academic Centers
      • Government and Defense Medical Facilities
    • Y-o-Y Growth Trend Analysis By End User, 2020 to 2024
    • Absolute $ Opportunity Analysis By End User, 2025 to 2035
  10. Global Market Analysis 2020 to 2024 and Forecast 2025 to 2035, By Region
    • Introduction
    • Historical Market Size Value (USD Million) Analysis By Region, 2020 to 2024
    • Current Market Size Value (USD Million) Analysis and Forecast By Region, 2025 to 2035
      • North America
      • Latin America
      • Western Europe
      • Eastern Europe
      • East Asia
      • South Asia
      • MEA
    • Market Attractiveness Analysis By Region
  11. North America Market Analysis 2020 to 2024 and Forecast 2025 to 2035, By Country
    • Historical Market Size Value (USD Million) Trend Analysis By Market Taxonomy, 2020 to 2024
    • Market Size Value (USD Million) Forecast By Market Taxonomy, 2025 to 2035
      • By Country
        • USA
        • Canada
        • Mexico
      • By Technology
      • By Application
      • By End User
    • Market Attractiveness Analysis
      • By Country
      • By Technology
      • By Application
      • By End User
    • Key Takeaways
  12. Latin America Market Analysis 2020 to 2024 and Forecast 2025 to 2035, By Country
    • Historical Market Size Value (USD Million) Trend Analysis By Market Taxonomy, 2020 to 2024
    • Market Size Value (USD Million) Forecast By Market Taxonomy, 2025 to 2035
      • By Country
        • Brazil
        • Argentina
        • Rest of Latin America
      • By Technology
      • By Application
      • By End User
    • Market Attractiveness Analysis
      • By Country
      • By Technology
      • By Application
      • By End User
    • Key Takeaways
  13. Western Europe Market Analysis 2020 to 2024 and Forecast 2025 to 2035, By Country
    • Historical Market Size Value (USD Million) Trend Analysis By Market Taxonomy, 2020 to 2024
    • Market Size Value (USD Million) Forecast By Market Taxonomy, 2025 to 2035
      • By Country
        • Germany
        • Italy
        • France
        • UK
        • Spain
        • BENELUX
        • Nordic Countries
        • Rest of Western Europe
      • By Technology
      • By Application
      • By End User
    • Market Attractiveness Analysis
      • By Country
      • By Technology
      • By Application
      • By End User
    • Key Takeaways
  14. Eastern Europe Market Analysis 2020 to 2024 and Forecast 2025 to 2035, By Country
    • Historical Market Size Value (USD Million) Trend Analysis By Market Taxonomy, 2020 to 2024
    • Market Size Value (USD Million) Forecast By Market Taxonomy, 2025 to 2035
      • By Country
        • Russia
        • Hungry
        • Poland
        • Rest of Eastern Europe
      • By Technology
      • By Application
      • By End User
    • Market Attractiveness Analysis
      • By Country
      • By Technology
      • By Application
      • By End User
    • Key Takeaways
  15. East Asia Market Analysis 2020 to 2024 and Forecast 2025 to 2035, By Country
    • Historical Market Size Value (USD Million) Trend Analysis By Market Taxonomy, 2020 to 2024
    • Market Size Value (USD Million) Forecast By Market Taxonomy, 2025 to 2035
      • By Country
        • China
        • Japan
        • South Korea
      • By Technology
      • By Application
      • By End User
    • Market Attractiveness Analysis
      • By Country
      • By Technology
      • By Application
      • By End User
    • Key Takeaways
  16. South Asia Market Analysis 2020 to 2024 and Forecast 2025 to 2035, By Country
    • Historical Market Size Value (USD Million) Trend Analysis By Market Taxonomy, 2020 to 2024
    • Market Size Value (USD Million) Forecast By Market Taxonomy, 2025 to 2035
      • By Country
        • India
        • ASIAN Countries
        • Australia & New Zealand
        • Rest of South Asia
      • By Technology
      • By Application
      • By End User
    • Market Attractiveness Analysis
      • By Country
      • By Technology
      • By Application
      • By End User
    • Key Takeaways
  17. MEA Market Analysis 2020 to 2024 and Forecast 2025 to 2035, By Country
    • Historical Market Size Value (USD Million) Trend Analysis By Market Taxonomy, 2020 to 2024
    • Market Size Value (USD Million) Forecast By Market Taxonomy, 2025 to 2035
      • By Country
        • Saudi Arabia
        • Türkiye
        • South Africa
        • Other African Union
        • Rest of MEA
      • By Technology
      • By Application
      • By End User
    • Market Attractiveness Analysis
      • By Country
      • By Technology
      • By Application
      • By End User
    • Key Takeaways
  18. Key Countries Market Analysis
    • USA
      • Pricing Analysis
      • Market Share Analysis, 2024
        • By Technology
        • By Application
        • By End User
    • Brazil
      • Pricing Analysis
      • Market Share Analysis, 2024
        • By Technology
        • By Application
        • By End User
    • China
      • Pricing Analysis
      • Market Share Analysis, 2024
        • By Technology
        • By Application
        • By End User
    • India
      • Pricing Analysis
      • Market Share Analysis, 2024
        • By Technology
        • By Application
        • By End User
    • Europe
      • Pricing Analysis
      • Market Share Analysis, 2024
        • By Technology
        • By Application
        • By End User
    • Germany
      • Pricing Analysis
      • Market Share Analysis, 2024
        • By Technology
        • By Application
        • By End User
    • France
      • Pricing Analysis
      • Market Share Analysis, 2024
        • By Technology
        • By Application
        • By End User
    • UK
      • Pricing Analysis
      • Market Share Analysis, 2024
        • By Technology
        • By Application
        • By End User
  19. Market Structure Analysis
    • Competition Dashboard
    • Competition Benchmarking
    • Market Share Analysis of Top Players
      • By Regional
      • By Technology
      • By Application
      • By End User
  20. Competition Analysis
    • Competition Deep Dive
      • GE HealthCare
        • Overview
        • Product Portfolio
        • Profitability by Market Segments
        • Sales Footprint
        • Strategy Overview
          • Marketing Strategy
          • Product Strategy
          • Channel Strategy
      • Lantheus Medical Imaging, Inc.
        • Overview
        • Product Portfolio
        • Profitability by Market Segments
        • Sales Footprint
        • Strategy Overview
          • Marketing Strategy
          • Product Strategy
          • Channel Strategy
  21. Assumptions & Acronyms Used
  22. Research Methodology

List of Tables

  • Table 1: Global Market Value (USD Million) Forecast by Region, 2020-2035
  • Table 2: Global Market Value (USD Million) Forecast by Technology, 2020-2035
  • Table 3: Global Market Value (USD Million) Forecast by Application, 2020-2035
  • Table 4: Global Market Value (USD Million) Forecast by End User, 2020-2035
  • Table 5: North America Market Value (USD Million) Forecast by Country, 2020-2035
  • Table 6: North America Market Value (USD Million) Forecast by Technology, 2020-2035
  • Table 7: North America Market Value (USD Million) Forecast by Application, 2020-2035
  • Table 8: North America Market Value (USD Million) Forecast by End User, 2020-2035
  • Table 9: Latin America Market Value (USD Million) Forecast by Country, 2020-2035
  • Table 10: Latin America Market Value (USD Million) Forecast by Technology, 2020-2035
  • Table 11: Latin America Market Value (USD Million) Forecast by Application, 2020-2035
  • Table 12: Latin America Market Value (USD Million) Forecast by End User, 2020-2035
  • Table 13: Western Europe Market Value (USD Million) Forecast by Country, 2020-2035
  • Table 14: Western Europe Market Value (USD Million) Forecast by Technology, 2020-2035
  • Table 15: Western Europe Market Value (USD Million) Forecast by Application, 2020-2035
  • Table 16: Western Europe Market Value (USD Million) Forecast by End User, 2020-2035
  • Table 17: Eastern Europe Market Value (USD Million) Forecast by Country, 2020-2035
  • Table 18: Eastern Europe Market Value (USD Million) Forecast by Technology, 2020-2035
  • Table 19: Eastern Europe Market Value (USD Million) Forecast by Application, 2020-2035
  • Table 20: Eastern Europe Market Value (USD Million) Forecast by End User, 2020-2035
  • Table 21: East Asia Market Value (USD Million) Forecast by Country, 2020-2035
  • Table 22: East Asia Market Value (USD Million) Forecast by Technology, 2020-2035
  • Table 23: East Asia Market Value (USD Million) Forecast by Application, 2020-2035
  • Table 24: East Asia Market Value (USD Million) Forecast by End User, 2020-2035
  • Table 25: South Asia Market Value (USD Million) Forecast by Country, 2020-2035
  • Table 26: South Asia Market Value (USD Million) Forecast by Technology, 2020-2035
  • Table 27: South Asia Market Value (USD Million) Forecast by Application, 2020-2035
  • Table 28: South Asia Market Value (USD Million) Forecast by End User, 2020-2035
  • Table 29: MEA Market Value (USD Million) Forecast by Country, 2020-2035
  • Table 30: MEA Market Value (USD Million) Forecast by Technology, 2020-2035
  • Table 31: MEA Market Value (USD Million) Forecast by Application, 2020-2035
  • Table 32: MEA Market Value (USD Million) Forecast by End User, 2020-2035

List of Figures

  • Figure 1: Global Market Value (USD Million) by Technology, 2025-2035
  • Figure 2: Global Market Value (USD Million) by Application, 2025-2035
  • Figure 3: Global Market Value (USD Million) by End User, 2025-2035
  • Figure 4: Global Market Value (USD Million) by Region, 2025-2035
  • Figure 5: Global Market Value (USD Million) Analysis by Region, 2020-2035
  • Figure 6: Global Market Value Share (%) and BPS Analysis by Region, 2025-2035
  • Figure 7: Global Market Y-o-Y Growth (%) Projections by Region, 2025-2035
  • Figure 8: Global Market Value (USD Million) Analysis by Technology, 2020-2035
  • Figure 9: Global Market Value Share (%) and BPS Analysis by Technology, 2025-2035
  • Figure 10: Global Market Y-o-Y Growth (%) Projections by Technology, 2025-2035
  • Figure 11: Global Market Value (USD Million) Analysis by Application, 2020-2035
  • Figure 12: Global Market Value Share (%) and BPS Analysis by Application, 2025-2035
  • Figure 13: Global Market Y-o-Y Growth (%) Projections by Application, 2025-2035
  • Figure 14: Global Market Value (USD Million) Analysis by End User, 2020-2035
  • Figure 15: Global Market Value Share (%) and BPS Analysis by End User, 2025-2035
  • Figure 16: Global Market Y-o-Y Growth (%) Projections by End User, 2025-2035
  • Figure 17: Global Market Attractiveness by Technology, 2025-2035
  • Figure 18: Global Market Attractiveness by Application, 2025-2035
  • Figure 19: Global Market Attractiveness by End User, 2025-2035
  • Figure 20: Global Market Attractiveness by Region, 2025-2035
  • Figure 21: North America Market Value (USD Million) by Technology, 2025-2035
  • Figure 22: North America Market Value (USD Million) by Application, 2025-2035
  • Figure 23: North America Market Value (USD Million) by End User, 2025-2035
  • Figure 24: North America Market Value (USD Million) by Country, 2025-2035
  • Figure 25: North America Market Value (USD Million) Analysis by Country, 2020-2035
  • Figure 26: North America Market Value Share (%) and BPS Analysis by Country, 2025-2035
  • Figure 27: North America Market Y-o-Y Growth (%) Projections by Country, 2025-2035
  • Figure 28: North America Market Value (USD Million) Analysis by Technology, 2020-2035
  • Figure 29: North America Market Value Share (%) and BPS Analysis by Technology, 2025-2035
  • Figure 30: North America Market Y-o-Y Growth (%) Projections by Technology, 2025-2035
  • Figure 31: North America Market Value (USD Million) Analysis by Application, 2020-2035
  • Figure 32: North America Market Value Share (%) and BPS Analysis by Application, 2025-2035
  • Figure 33: North America Market Y-o-Y Growth (%) Projections by Application, 2025-2035
  • Figure 34: North America Market Value (USD Million) Analysis by End User, 2020-2035
  • Figure 35: North America Market Value Share (%) and BPS Analysis by End User, 2025-2035
  • Figure 36: North America Market Y-o-Y Growth (%) Projections by End User, 2025-2035
  • Figure 37: North America Market Attractiveness by Technology, 2025-2035
  • Figure 38: North America Market Attractiveness by Application, 2025-2035
  • Figure 39: North America Market Attractiveness by End User, 2025-2035
  • Figure 40: North America Market Attractiveness by Country, 2025-2035
  • Figure 41: Latin America Market Value (USD Million) by Technology, 2025-2035
  • Figure 42: Latin America Market Value (USD Million) by Application, 2025-2035
  • Figure 43: Latin America Market Value (USD Million) by End User, 2025-2035
  • Figure 44: Latin America Market Value (USD Million) by Country, 2025-2035
  • Figure 45: Latin America Market Value (USD Million) Analysis by Country, 2020-2035
  • Figure 46: Latin America Market Value Share (%) and BPS Analysis by Country, 2025-2035
  • Figure 47: Latin America Market Y-o-Y Growth (%) Projections by Country, 2025-2035
  • Figure 48: Latin America Market Value (USD Million) Analysis by Technology, 2020-2035
  • Figure 49: Latin America Market Value Share (%) and BPS Analysis by Technology, 2025-2035
  • Figure 50: Latin America Market Y-o-Y Growth (%) Projections by Technology, 2025-2035
  • Figure 51: Latin America Market Value (USD Million) Analysis by Application, 2020-2035
  • Figure 52: Latin America Market Value Share (%) and BPS Analysis by Application, 2025-2035
  • Figure 53: Latin America Market Y-o-Y Growth (%) Projections by Application, 2025-2035
  • Figure 54: Latin America Market Value (USD Million) Analysis by End User, 2020-2035
  • Figure 55: Latin America Market Value Share (%) and BPS Analysis by End User, 2025-2035
  • Figure 56: Latin America Market Y-o-Y Growth (%) Projections by End User, 2025-2035
  • Figure 57: Latin America Market Attractiveness by Technology, 2025-2035
  • Figure 58: Latin America Market Attractiveness by Application, 2025-2035
  • Figure 59: Latin America Market Attractiveness by End User, 2025-2035
  • Figure 60: Latin America Market Attractiveness by Country, 2025-2035
  • Figure 61: Western Europe Market Value (USD Million) by Technology, 2025-2035
  • Figure 62: Western Europe Market Value (USD Million) by Application, 2025-2035
  • Figure 63: Western Europe Market Value (USD Million) by End User, 2025-2035
  • Figure 64: Western Europe Market Value (USD Million) by Country, 2025-2035
  • Figure 65: Western Europe Market Value (USD Million) Analysis by Country, 2020-2035
  • Figure 66: Western Europe Market Value Share (%) and BPS Analysis by Country, 2025-2035
  • Figure 67: Western Europe Market Y-o-Y Growth (%) Projections by Country, 2025-2035
  • Figure 68: Western Europe Market Value (USD Million) Analysis by Technology, 2020-2035
  • Figure 69: Western Europe Market Value Share (%) and BPS Analysis by Technology, 2025-2035
  • Figure 70: Western Europe Market Y-o-Y Growth (%) Projections by Technology, 2025-2035
  • Figure 71: Western Europe Market Value (USD Million) Analysis by Application, 2020-2035
  • Figure 72: Western Europe Market Value Share (%) and BPS Analysis by Application, 2025-2035
  • Figure 73: Western Europe Market Y-o-Y Growth (%) Projections by Application, 2025-2035
  • Figure 74: Western Europe Market Value (USD Million) Analysis by End User, 2020-2035
  • Figure 75: Western Europe Market Value Share (%) and BPS Analysis by End User, 2025-2035
  • Figure 76: Western Europe Market Y-o-Y Growth (%) Projections by End User, 2025-2035
  • Figure 77: Western Europe Market Attractiveness by Technology, 2025-2035
  • Figure 78: Western Europe Market Attractiveness by Application, 2025-2035
  • Figure 79: Western Europe Market Attractiveness by End User, 2025-2035
  • Figure 80: Western Europe Market Attractiveness by Country, 2025-2035
  • Figure 81: Eastern Europe Market Value (USD Million) by Technology, 2025-2035
  • Figure 82: Eastern Europe Market Value (USD Million) by Application, 2025-2035
  • Figure 83: Eastern Europe Market Value (USD Million) by End User, 2025-2035
  • Figure 84: Eastern Europe Market Value (USD Million) by Country, 2025-2035
  • Figure 85: Eastern Europe Market Value (USD Million) Analysis by Country, 2020-2035
  • Figure 86: Eastern Europe Market Value Share (%) and BPS Analysis by Country, 2025-2035
  • Figure 87: Eastern Europe Market Y-o-Y Growth (%) Projections by Country, 2025-2035
  • Figure 88: Eastern Europe Market Value (USD Million) Analysis by Technology, 2020-2035
  • Figure 89: Eastern Europe Market Value Share (%) and BPS Analysis by Technology, 2025-2035
  • Figure 90: Eastern Europe Market Y-o-Y Growth (%) Projections by Technology, 2025-2035
  • Figure 91: Eastern Europe Market Value (USD Million) Analysis by Application, 2020-2035
  • Figure 92: Eastern Europe Market Value Share (%) and BPS Analysis by Application, 2025-2035
  • Figure 93: Eastern Europe Market Y-o-Y Growth (%) Projections by Application, 2025-2035
  • Figure 94: Eastern Europe Market Value (USD Million) Analysis by End User, 2020-2035
  • Figure 95: Eastern Europe Market Value Share (%) and BPS Analysis by End User, 2025-2035
  • Figure 96: Eastern Europe Market Y-o-Y Growth (%) Projections by End User, 2025-2035
  • Figure 97: Eastern Europe Market Attractiveness by Technology, 2025-2035
  • Figure 98: Eastern Europe Market Attractiveness by Application, 2025-2035
  • Figure 99: Eastern Europe Market Attractiveness by End User, 2025-2035
  • Figure 100: Eastern Europe Market Attractiveness by Country, 2025-2035
  • Figure 101: East Asia Market Value (USD Million) by Technology, 2025-2035
  • Figure 102: East Asia Market Value (USD Million) by Application, 2025-2035
  • Figure 103: East Asia Market Value (USD Million) by End User, 2025-2035
  • Figure 104: East Asia Market Value (USD Million) by Country, 2025-2035
  • Figure 105: East Asia Market Value (USD Million) Analysis by Country, 2020-2035
  • Figure 106: East Asia Market Value Share (%) and BPS Analysis by Country, 2025-2035
  • Figure 107: East Asia Market Y-o-Y Growth (%) Projections by Country, 2025-2035
  • Figure 108: East Asia Market Value (USD Million) Analysis by Technology, 2020-2035
  • Figure 109: East Asia Market Value Share (%) and BPS Analysis by Technology, 2025-2035
  • Figure 110: East Asia Market Y-o-Y Growth (%) Projections by Technology, 2025-2035
  • Figure 111: East Asia Market Value (USD Million) Analysis by Application, 2020-2035
  • Figure 112: East Asia Market Value Share (%) and BPS Analysis by Application, 2025-2035
  • Figure 113: East Asia Market Y-o-Y Growth (%) Projections by Application, 2025-2035
  • Figure 114: East Asia Market Value (USD Million) Analysis by End User, 2020-2035
  • Figure 115: East Asia Market Value Share (%) and BPS Analysis by End User, 2025-2035
  • Figure 116: East Asia Market Y-o-Y Growth (%) Projections by End User, 2025-2035
  • Figure 117: East Asia Market Attractiveness by Technology, 2025-2035
  • Figure 118: East Asia Market Attractiveness by Application, 2025-2035
  • Figure 119: East Asia Market Attractiveness by End User, 2025-2035
  • Figure 120: East Asia Market Attractiveness by Country, 2025-2035
  • Figure 121: South Asia Market Value (USD Million) by Technology, 2025-2035
  • Figure 122: South Asia Market Value (USD Million) by Application, 2025-2035
  • Figure 123: South Asia Market Value (USD Million) by End User, 2025-2035
  • Figure 124: South Asia Market Value (USD Million) by Country, 2025-2035
  • Figure 125: South Asia Market Value (USD Million) Analysis by Country, 2020-2035
  • Figure 126: South Asia Market Value Share (%) and BPS Analysis by Country, 2025-2035
  • Figure 127: South Asia Market Y-o-Y Growth (%) Projections by Country, 2025-2035
  • Figure 128: South Asia Market Value (USD Million) Analysis by Technology, 2020-2035
  • Figure 129: South Asia Market Value Share (%) and BPS Analysis by Technology, 2025-2035
  • Figure 130: South Asia Market Y-o-Y Growth (%) Projections by Technology, 2025-2035
  • Figure 131: South Asia Market Value (USD Million) Analysis by Application, 2020-2035
  • Figure 132: South Asia Market Value Share (%) and BPS Analysis by Application, 2025-2035
  • Figure 133: South Asia Market Y-o-Y Growth (%) Projections by Application, 2025-2035
  • Figure 134: South Asia Market Value (USD Million) Analysis by End User, 2020-2035
  • Figure 135: South Asia Market Value Share (%) and BPS Analysis by End User, 2025-2035
  • Figure 136: South Asia Market Y-o-Y Growth (%) Projections by End User, 2025-2035
  • Figure 137: South Asia Market Attractiveness by Technology, 2025-2035
  • Figure 138: South Asia Market Attractiveness by Application, 2025-2035
  • Figure 139: South Asia Market Attractiveness by End User, 2025-2035
  • Figure 140: South Asia Market Attractiveness by Country, 2025-2035
  • Figure 141: MEA Market Value (USD Million) by Technology, 2025-2035
  • Figure 142: MEA Market Value (USD Million) by Application, 2025-2035
  • Figure 143: MEA Market Value (USD Million) by End User, 2025-2035
  • Figure 144: MEA Market Value (USD Million) by Country, 2025-2035
  • Figure 145: MEA Market Value (USD Million) Analysis by Country, 2020-2035
  • Figure 146: MEA Market Value Share (%) and BPS Analysis by Country, 2025-2035
  • Figure 147: MEA Market Y-o-Y Growth (%) Projections by Country, 2025-2035
  • Figure 148: MEA Market Value (USD Million) Analysis by Technology, 2020-2035
  • Figure 149: MEA Market Value Share (%) and BPS Analysis by Technology, 2025-2035
  • Figure 150: MEA Market Y-o-Y Growth (%) Projections by Technology, 2025-2035
  • Figure 151: MEA Market Value (USD Million) Analysis by Application, 2020-2035
  • Figure 152: MEA Market Value Share (%) and BPS Analysis by Application, 2025-2035
  • Figure 153: MEA Market Y-o-Y Growth (%) Projections by Application, 2025-2035
  • Figure 154: MEA Market Value (USD Million) Analysis by End User, 2020-2035
  • Figure 155: MEA Market Value Share (%) and BPS Analysis by End User, 2025-2035
  • Figure 156: MEA Market Y-o-Y Growth (%) Projections by End User, 2025-2035
  • Figure 157: MEA Market Attractiveness by Technology, 2025-2035
  • Figure 158: MEA Market Attractiveness by Application, 2025-2035
  • Figure 159: MEA Market Attractiveness by End User, 2025-2035
  • Figure 160: MEA Market Attractiveness by Country, 2025-2035

Frequently Asked Questions

How big is the Global Flurpiridaz Market in 2025?

The global flurpiridaz market is estimated to be valued at USD 546.9million in 2025.

What will be the size of the Global Flurpiridaz Market in 2035?

The market size for the global flurpiridaz market is projected to reach approximately USD 1,202.6 million by 2035.

How much will the Global Flurpiridaz Market grow between 2025 and 2035?

The global flurpiridaz market is expected to grow at a CAGR of 8.2% between 2025 and 2035.

What are the key technology types in the Global Flurpiridaz Market?

The key technology types in the global flurpiridaz market include PET MPI (Positron Emission Tomography Myocardial Perfusion Imaging), PET/CT and PET/MR.

Which type of application will contribute a significant share in the Flurpiridaz Market in 2025?

In terms of application, Coronary Artery Disease (CAD) Diagnosis is projected to command the highest share at 43.9% in the global flurpiridaz market in 2025.

Future Market Insights

Flurpiridaz Market

Chat With

MaRIA

Hi There, I am MaRIA, Your Market Research Intelligence Assistant. How may I help you?