Gentian Market Size and Share Forecast Outlook 2025 to 2035

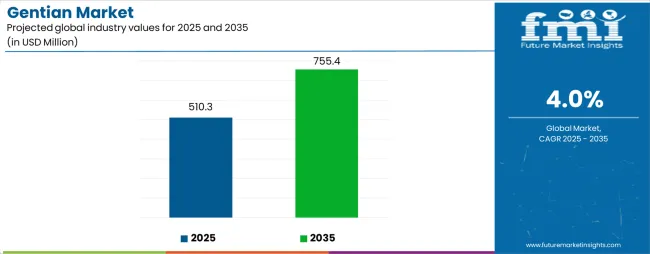
The gentian market is estimated to be valued at USD 510.3 million in 2025. It is projected to reach USD 755.4 million by 2035, registering a compound annual growth rate (CAGR) of 4.0% over the forecast period. An absolute dollar opportunity of USD 245.1million is expected to be added during this period, representing a 1.48 times growth. The market's growth is anticipated to be driven by increased demand for gentian-derived compounds in pharmaceuticals and herbal supplements, along with rising awareness regarding natural plant-based remedies globally.
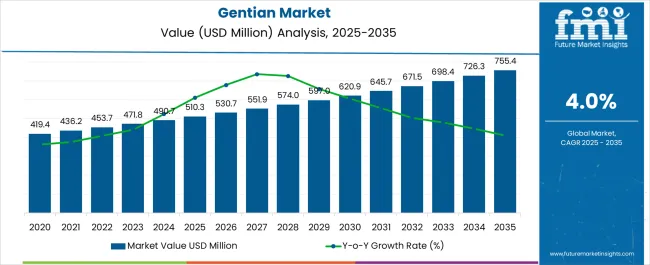
By 2030, the market is projected to reach approximately USD 620.9 million, reflecting an incremental increase of USD 110.6 million from USD 510.3 million in 2025. From 2030 to 2035, the market is expected to further grow to USD 755.4 million, adding another USD 134.5 million in incremental value during the latter half of the decade, indicating a moderately back-loaded growth pattern.

Companies such as Synthite Industries and Indena S.p.A. are strengthening their market presence by investing in R&D for extraction technologies and environmentally responsible sourcing. Partnerships and acquisitions are leveraged to enhance product portfolios and expand into emerging markets, with compliance to stringent quality standards acting as a critical competitive advantage.

Gentian Market Value Analysis

Quick Stats for Gentian Market

  • Gentian Market Value (2025): USD 510.3 million
  • Gentian Market Forecast Value (2035): USD 755.4 million
  • Gentian Market Forecast CAGR: 4.0%
  • Leading Segment in Gentian Market (2025): Conventional Source (70% market share)
  • Key Growth Regions in Gentian Market: Asia-Pacific, Europe, North America
  • Top Key Players in Gentian Market: DLC Laboratories, Shaanxi Jintai Biological Engineering, APC Pure, Nature’s Answer, Changsha Vigorous-Tech, Swanson Health Products, Sichuan Xiaoye Bencao Biotechnology, Vital Nutrients, Bell’s Healthcare, The Bach Centre, Shaanxi Undersun Bio med tech, Xi'an DN Biology, Bio-Botanica, Xi'an Lyphar Biotech

Gentian Market

Metric Value
Estimated Size (2025E) USD 510.3 million
Projected Value (2035F) USD 755.4 million
CAGR (2025 to 2035) 4.0%

The market holds a notable share across several parent markets, reflecting its versatile applications. It accounts for approximately 12% of the botanical extracts market, driven by its widespread use in natural health products. In the herbal supplements market, gentian represents around 9%, supported by growing consumer preference for digestive and anti-inflammatory remedies. Within pharmaceutical raw materials, it holds close to 6%, as gentian-derived compounds are increasingly incorporated in drug formulations. The market’s share in nutraceutical ingredients is estimated at 8%. In contrast, in natural cosmetics ingredients and functional food ingredients, gentian occupies roughly 5% and 4%, respectively, underscoring its expanding role in diverse health and wellness sectors.

Recent trends in the gentian market highlight a growing adoption of gentian extracts in pharmaceutical formulations and nutraceutical products, fueled by rising consumer demand for natural and plant-based health solutions. Innovations in eco-friendly extraction technologies are gaining traction, promoting sustainable and efficient production methods. Additionally, there is an increasing focus on sustainable farming practices to ensure environmental conservation and a consistent supply. Regulatory authorities worldwide have implemented stricter quality and safety standards for gentian products, encouraging manufacturers to enhance compliance measures. These combined factors are driving market growth by improving product quality, consumer trust, and expanding applications across health-related industries.

Why is the Gentian Market Growing?

The gentian market is growing primarily due to the rising demand for natural and plant-based ingredients in pharmaceutical and nutraceutical products. Gentian extracts are valued for their medicinal properties, including digestive health and anti-inflammatory effects, increasingly sought by consumers preferring herbal remedies over synthetic alternatives.

Increased consumer awareness regarding health and wellness has fueled the adoption of gentian in dietary supplements and herbal medicines. Additionally, advancements in sustainable cultivation and eco-friendly extraction technologies have improved product availability and quality, further stimulating market growth. Government regulations supporting natural product integration in healthcare also contribute to the expanding market landscape.

With the ongoing trend toward clean-label and organic products, the gentian market is expected to benefit from enhanced application opportunities across pharmaceuticals, cosmetics, and functional foods, ensuring sustained growth through the forecast period.

Gentian Market Analysis by Top Investment Segment

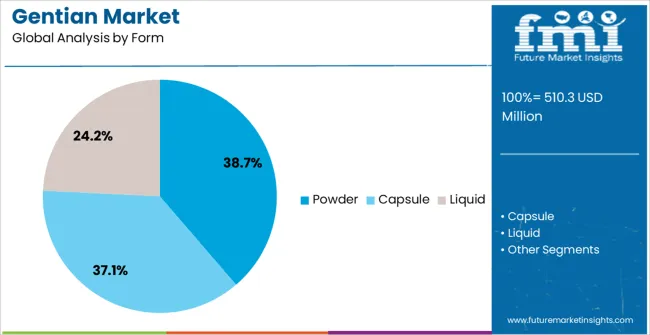
The market is segmented by source, form, application, distribution channel, and region. By source, the market is bifurcated into conventional and organic. Based on form, the market is segmented into liquid, powder and capsule. In terms of application, the market is classified into pharmaceutical industry, cosmetics and food & beverage. By distribution channel, the market is divided into store-based retail, specialty stores, online retail, supermarkets, and hypermarkets. Regionally, the market is classified into North America, Europe, Asia-Pacific, Latin America, Japan and the Middle East & Africa.

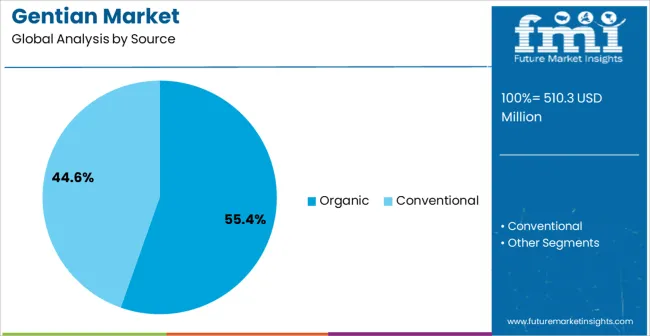
By Source, Conventional Segment Accounts for 70.0% of the Market Share

Gentian Market By Source

The conventional source segment dominates the gentian market with a 70.0% share due to the widespread availability and established cultivation practices of gentian plants in traditional agricultural settings. This segment benefits from mature supply chains and consistent raw material quality, which support large-scale production for pharmaceutical and nutraceutical manufacturers. Conventional gentian is preferred for its reliable potency and supply stability, crucial for industrial applications requiring high-volume ingredient sourcing.

Sustained investment in improving cultivation efficiency and pest management within conventional farming practices ensures steady output, while mechanization and advanced agricultural inputs help reduce production costs. As demand for gentian-based products grows globally, the traditional segment’s dominance is expected to continue, supported by established trade networks and regulatory compliance mechanisms.

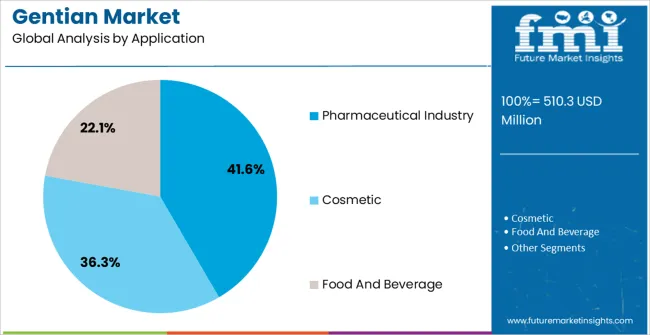
By Application, Pharmaceutical Industry Segment Accounts for 50.0% of the Market Share

Gentian Market By Application

The pharmaceutical industry is the largest application segment in the gentian market, holding a 50.0% share in 2025. Gentian extracts are widely used in the formulation of digestive aids, anti-inflammatory drugs, and herbal remedies, reflecting their traditional medicinal properties validated by modern research. Increasing consumer preference for plant-derived active pharmaceutical ingredients is driving demand for gentian within drug manufacturing and complementary medicine.

Pharmaceutical companies are actively investing in research and development to optimize gentian’s bioactive compound extraction, standardization, and formulation techniques to enhance efficacy and regulatory acceptance. The rising incidence of digestive disorders and growing interest in natural therapeutics further propel the application of gentian in pharmaceutical preparations. This segment is projected to maintain robust growth, backed by innovations and expanding product pipelines integrating gentian-based compounds.

What are the Drivers, Restraints, and Key Trends of the Gentian Market?

In 2025, the global gentian market is recording steady growth, with demand largely driven by pharmaceutical, nutraceutical, and functional food applications. Gentian extracts are valued for their digestive health and anti-inflammatory benefits, positioning them as high-demand ingredients in natural wellness formulations. Manufacturers are expanding product portfolios to include standardized gentian extracts with enhanced bioactive concentration for improved efficacy and regulatory compliance. Clean-label positioning and the rising consumer shift toward herbal remedies are accelerating adoption across Europe, North America, and Asia-Pacific. Advancements in environmentally responsible cultivation practices and eco-friendly extraction techniques are improving product quality and securing more reliable raw material supply. Increasing prevalence of digestive disorders, combined with government-backed botanical integration in healthcare, is further stimulating market penetration.

Natural Wellness Demand, Therapeutic Efficacy, and Clean-label Formulations Drive Gentian Adoption

Pharmaceutical, nutraceutical, and functional food manufacturers are increasingly incorporating gentian extracts to address growing consumer demand for plant-based therapeutic solutions. Standardized extracts are being developed to ensure consistent levels of key bitter compounds, improving clinical efficacy in digestive and anti-inflammatory applications. In functional beverages and herbal supplements, gentian enhances digestive support claims, improving product differentiation in competitive wellness markets. Cosmetic and personal care brands are also introducing gentian-based products for skin-soothing and antioxidant benefits. Sustainable sourcing initiatives, including organic and wild-harvested gentian, are expanding premium product offerings. Adoption rates are rising as R&D investments improve extraction yields by 10-15%, reduce environmental impact, and ensure compliance with global botanical safety standards.

Seasonal Supply Variability, High Processing Costs, and Regulatory Barriers Restrict Expansion

Growth is constrained by the limited availability of high-quality gentian raw materials, as cultivation is often dependent on specific climatic conditions and seasonal harvests. Yield variability increases supply chain risk, while advanced extraction processes and strict quality control protocols raise production costs by 12-20% compared to more common herbal ingredients. Regulatory complexities in pharmaceuticals and nutraceuticals extend product development timelines by 6-9 months, slowing time-to-market. Compliance with stringent safety and efficacy standards adds to operational costs, limiting the scalability of production in price-sensitive markets. Supply chain disruptions and reliance on wild-harvested gentian further challenge consistent availability. Despite these restraints, innovations in controlled cultivation, sustainable sourcing, and extraction technology are expected to reduce risks and sustain long-term growth.

Gentian Market Analysis by Top Countries

Country Wise Analysis Of Gentian Market

Country CAGR (2025 to 2035)
Japan 7.8%
United States 6.5%
Germany 5.2%
France 4.8%
United Kingdom 4.2%

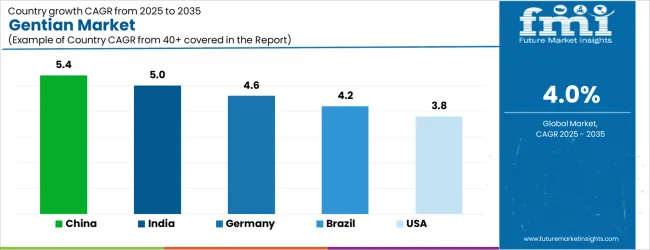
The gentian market exhibits varying growth trajectories across leading countries, with Japan leading at a CAGR of 7.8%, followed by the USA at 6.5%. Germany and France show moderate expansion at 5.2% and 4.8%, respectively, while the UK records a CAGR of 4.2%. Japan’s rapid growth is driven by strong pharmaceutical and nutraceutical demand, whereas the USA benefits from expanding herbal medicine awareness and advanced extraction technologies. European countries like Germany and France experience steady adoption linked to stringent regulatory compliance and organic product trends. The UK faces slower growth, impacted by supply chain challenges and market maturity.

The report covers an in-depth analysis of 40+ countries; five top-performing OECD countries are highlighted below.

Growth Outlook of the Gentian Market in Japan

The gentian market in Japan is projected to grow at a CAGR of 7.8% from 2025 to 2035, propelled by rising demand for high-quality botanical extracts in pharmaceuticals and functional health supplements. Increasing preference for natural and traditional remedies, coupled with Japan’s aging population, fuels demand for gentian-based digestive health products. Urban centers like Tokyo and Osaka are key consumption hubs where consumer awareness and product availability are high. Domestic manufacturers emphasize purity and bioactive standardization to meet rigorous quality standards.

Key Statistics:

  • Gentian extracts contribute to 32% of Japan’s botanical extract market in 2025
  • Functional nutraceuticals using gentian are expected to grow 9.1% annually through 2035
  • USD 180 million revenue forecasted from gentian-based pharmaceuticals in 2025

Market Development in the Gentian Market in the United States

Revenue from the gentian in the USA is anticipated to expand at a CAGR of 6.5% between 2025 and 2035. Growth is driven by rising consumer interest in herbal supplements and natural digestive aids, especially within California, New York, and Texas. Innovations in extraction technology and sustainable sourcing improve gentian extract quality and availability. Increasing collaborations between botanical ingredient suppliers and pharmaceutical companies facilitate product pipeline expansion. Regulatory clarity on herbal ingredient standards supports market trust and penetration.

Key Statistics:

  • 28% of USA nutraceutical products incorporate gentian extracts in 2025
  • Investment in sustainable cultivation initiatives rose by 15% in 2024
  • Over USD 120 million spent on gentian-related R&D in 2024

Growth Assessment for the Gentian Market in Germany

Sales of gentian in Germany are slated to flourish at a CAGR of 5.2% from 2025 to 2035, supported by demand for herbal medicines and organic botanical extracts. Regions including Bavaria and North Rhine-Westphalia lead due to strong pharmaceutical manufacturing and research hubs. Stringent EU regulations drive compliance and quality assurance, fostering market confidence. Organic gentian sourcing and wild-harvested variants are gaining traction, aligning with consumer preferences for sustainability. Partnerships between botanical growers and pharmaceutical firms are enhancing product innovation and market reach.

Key Statistics:

  • 40 certified organic gentian farms in Germany as of 2024
  • 65% of gentian extracts used in German pharmaceuticals meet EU organic standards
  • €95 million revenue from gentian-based medicinal products in 2025

Innovation leads Development in the Gentian Market in France

Demand for gentian in France is estimated to rise at a CAGR of 4.8% from 2025 to 2035. Growth is concentrated in herbal supplement production and pharmaceutical applications centered in regions like Auvergne-Rhône-Alpes and Occitanie. French consumers increasingly prefer natural remedies, boosting gentian use in digestive health formulations. Collaboration between botanical extract producers and artisanal herbal medicine companies supports product diversification. Regulatory adherence to French and EU botanical safety standards ensures product quality and market confidence.

Key Statistics:

  • 22% increase in gentian supplement launches in France during 2024
  • 55% of gentian extract consumption is attributed to digestive aid formulations
  • €70 million generated by gentian products in the French herbal medicine market in 2025

Growth Assessment for the Gentian Market in the United Kingdom

The gentian market in the UK is forecasted to strengthen at a CAGR of 4.2% from 2025 to 2035, reflecting mature market dynamics and supply chain constraints post-Brexit. London, Manchester, and Birmingham are primary consumption centers, with demand focused on natural supplements and complementary medicines. Limited domestic cultivation leads to import reliance, impacting pricing and availability. However, growing consumer interest in plant-based therapeutics and expanding product innovation support steady market growth. Regulatory changes are gradually streamlining botanical ingredient approvals, fostering long-term market stability.

Key Statistics:

  • 35% of the gentian supply in the UK was imported from Europe and Asia in 2025
  • 40% of botanical supplement manufacturers reported gentian product sales growth in 2024
  • £45 million investment in gentian-related product development from 2023 to 2025

Competitive Landscape of the Gentian Market

Gentian Market By Company

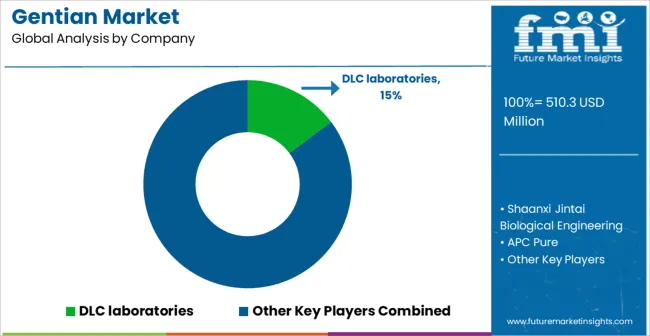
The gentian market is moderately consolidated, comprising global botanical extract suppliers, specialized herbal ingredient manufacturers, and regional cultivators with diverse extraction technologies and application expertise. Key players such as Synthite Industries, Indena S.p.A., and Martin Bauer Group dominate the market by offering high-purity gentian extracts primarily for pharmaceutical and nutraceutical applications. These companies leverage advanced extraction techniques, sustainable sourcing practices, and rigorous quality control measures to meet stringent regulatory requirements globally. Their extensive distribution networks and partnerships with pharmaceutical firms enable broad market penetration.

Mid-sized firms like Naturex (a Givaudan company) and FZNP differentiate themselves by focusing on organic and wild-harvested gentian variants, catering to the rising demand for clean-label and natural products. Investments in research and development have facilitated innovation in bioactive standardization and formulation services, allowing these companies to address emerging functional food and cosmetic applications. Regional cultivators in Asia-Pacific and Europe contribute by ensuring supply chain stability, often collaborating with international extractors to meet growing demand.

Barriers to entry remain notable due to the complexities of gentian cultivation, extraction standardization, and compliance with global botanical ingredient regulations. Competitive advantage increasingly depends on sustainable sourcing, extraction efficiency, and the ability to customize extracts for diverse pharmaceutical, nutraceutical, and personal care applications. Innovation in eco-friendly extraction methods and strategic partnerships is expected to shape the competitive dynamics over the forecast period.

Scope of Report

Item Value
Quantitative Units USD 510.3 million
Source Organic and Conventional
Form Liquid, Powder, Capsule
Application Pharmaceutical Industry, Cosmetics, Food & Beverage
Distribution Channel Store Based Retail, Specialty Stores, Online Retail, Supermarkets, Hypermarkets
Regions Covered North America, Europe, Asia-Pacific, Latin America, Japan, Middle East & Africa
Countries Covered United States, Canada, United Kingdom, Germany, France, China, Japan, South Korea, Brazil, Australia and 40+ countries
Key Companies Profiled DLC Laboratories, Shaanxi Jintai Biological Engineering, APC Pure, Nature’s Answer, Changsha Vigorous-Tech, Swanson Health Products, Sichuan Xiaoye Bencao Biotechnology, Vital Nutrients, Bell’s Healthcare, The Bach Centre, Shaanxi Undersun Biomedtech, Xi'an DN Biology, Bio- Botanica, Xi'an Lyphar Biotech
Additional Attributes Market value by source and application, regional consumption trends, competitive landscape, consumer preference for organic and wild-harvested gentian, advancements in sustainable cultivation and eco-friendly extraction technologies, regulatory compliance frameworks, and innovation in bioactive standardization and product formulation

Key Segmentation

By Source:

  • Organic
  • Conventional

By Form:

  • Powder
  • Capsule
  • Liquid

BY Application:

  • Pharmaceutical industry
  • Cosmetic
  • Food and beverage

By Distribution channel:

  • Store Based Retail
  • Specialty Stores
  • Online Retail
  • Supermarkets
  • Hypermarkets

By region:

  • north America
  • Latin America
  • Asia pacific
  • eastern Europe
  • western Europe
  • Japan

Table of Content

  1. Executive Summary
    • Global Market Outlook
    • Demand-side Trends
    • Supply-side Trends
    • Technology Roadmap Analysis
    • Analysis and Recommendations
  2. Market Overview
    • Market Coverage / Taxonomy
    • Market Definition / Scope / Limitations
  3. Market Background
    • Market Dynamics
      • Drivers
      • Restraints
      • Opportunity
      • Trends
    • Scenario Forecast
      • Demand in Optimistic Scenario
      • Demand in Likely Scenario
      • Demand in Conservative Scenario
    • Opportunity Map Analysis
    • Product Life Cycle Analysis
    • Supply Chain Analysis
      • Supply Side Participants and their Roles
        • Producers
        • Mid-Level Participants (Traders/ Agents/ Brokers)
        • Wholesalers and Distributors
      • Value Added and Value Created at Node in the Supply Chain
      • List of Raw Material Suppliers
      • List of Existing and Potential Buyer’s
    • Investment Feasibility Matrix
    • Value Chain Analysis
      • Profit Margin Analysis
      • Wholesalers and Distributors
      • Retailers
    • PESTLE and Porter’s Analysis
    • Regulatory Landscape
      • By Key Regions
      • By Key Countries
    • Regional Parent Market Outlook
    • Production and Consumption Statistics
    • Import and Export Statistics
  4. Global Market Analysis 2020 to 2024 and Forecast, 2025 to 2035
    • Historical Market Size Value (USD Million) & Volume (Metric Tons) Analysis, 2020 to 2024
    • Current and Future Market Size Value (USD Million) & Volume (Metric Tons) Projections, 2025 to 2035
      • Y-o-Y Growth Trend Analysis
      • Absolute $ Opportunity Analysis
  5. Global Market Pricing Analysis 2020 to 2024 and Forecast 2025 to 2035
  6. Global Market Analysis 2020 to 2024 and Forecast 2025 to 2035, By Source
    • Introduction / Key Findings
    • Historical Market Size Value (USD Million) & Volume (Metric Tons) Analysis By Source, 2020 to 2024
    • Current and Future Market Size Value (USD Million) & Volume (Metric Tons) Analysis and Forecast By Source, 2025 to 2035
      • Organic
      • Conventional
    • Y-o-Y Growth Trend Analysis By Source, 2020 to 2024
    • Absolute $ Opportunity Analysis By Source, 2025 to 2035
  7. Global Market Analysis 2020 to 2024 and Forecast 2025 to 2035, By Form
    • Introduction / Key Findings
    • Historical Market Size Value (USD Million) & Volume (Metric Tons) Analysis By Form, 2020 to 2024
    • Current and Future Market Size Value (USD Million) & Volume (Metric Tons) Analysis and Forecast By Form, 2025 to 2035
      • Powder
      • Capsule
      • Liquid
    • Y-o-Y Growth Trend Analysis By Form, 2020 to 2024
    • Absolute $ Opportunity Analysis By Form, 2025 to 2035
  8. Global Market Analysis 2020 to 2024 and Forecast 2025 to 2035, By Application
    • Introduction / Key Findings
    • Historical Market Size Value (USD Million) & Volume (Metric Tons) Analysis By Application, 2020 to 2024
    • Current and Future Market Size Value (USD Million) & Volume (Metric Tons) Analysis and Forecast By Application, 2025 to 2035
      • Pharmaceutical industry
      • Cosmetic
      • Food and beverage
    • Y-o-Y Growth Trend Analysis By Application, 2020 to 2024
    • Absolute $ Opportunity Analysis By Application, 2025 to 2035
  9. Global Market Analysis 2020 to 2024 and Forecast 2025 to 2035, By Distribution Channel
    • Introduction / Key Findings
    • Historical Market Size Value (USD Million) & Volume (Metric Tons) Analysis By Distribution Channel, 2020 to 2024
    • Current and Future Market Size Value (USD Million) & Volume (Metric Tons) Analysis and Forecast By Distribution Channel, 2025 to 2035
      • Store Based Retail
      • Specialty Stores
      • Online Retail
      • Supermarkets
      • Hypermarkets
    • Y-o-Y Growth Trend Analysis By Distribution Channel, 2020 to 2024
    • Absolute $ Opportunity Analysis By Distribution Channel, 2025 to 2035
  10. Global Market Analysis 2020 to 2024 and Forecast 2025 to 2035, By Region
    • Introduction
    • Historical Market Size Value (USD Million) & Volume (Metric Tons) Analysis By Region, 2020 to 2024
    • Current Market Size Value (USD Million) & Volume (Metric Tons) Analysis and Forecast By Region, 2025 to 2035
      • North America
      • Latin America
      • Western Europe
      • Eastern Europe
      • East Asia
      • South Asia & Pacific
      • Middle East and Africa
    • Market Attractiveness Analysis By Region
  11. North America Market Analysis 2020 to 2024 and Forecast 2025 to 2035, By Country
    • Historical Market Size Value (USD Million) & Volume (Metric Tons) Trend Analysis By Market Taxonomy, 2020 to 2024
    • Market Size Value (USD Million) & Volume (Metric Tons) Forecast By Market Taxonomy, 2025 to 2035
      • By Country
        • USA
        • Canada
        • Mexico
      • By Source
      • By Form
      • By Application
      • By Distribution Channel
    • Market Attractiveness Analysis
      • By Country
      • By Source
      • By Form
      • By Application
      • By Distribution Channel
    • Key Takeaways
  12. Latin America Market Analysis 2020 to 2024 and Forecast 2025 to 2035, By Country
    • Historical Market Size Value (USD Million) & Volume (Metric Tons) Trend Analysis By Market Taxonomy, 2020 to 2024
    • Market Size Value (USD Million) & Volume (Metric Tons) Forecast By Market Taxonomy, 2025 to 2035
      • By Country
        • Brazil
        • Argentina
        • Rest of LATAM
      • By Source
      • By Form
      • By Application
      • By Distribution Channel
    • Market Attractiveness Analysis
      • By Country
      • By Source
      • By Form
      • By Application
      • By Distribution Channel
    • Key Takeaways
  13. Western Europe Market Analysis 2020 to 2024 and Forecast 2025 to 2035, By Country
    • Historical Market Size Value (USD Million) & Volume (Metric Tons) Trend Analysis By Market Taxonomy, 2020 to 2024
    • Market Size Value (USD Million) & Volume (Metric Tons) Forecast By Market Taxonomy, 2025 to 2035
      • By Country
        • Germany
        • Italy
        • France
        • UK
        • Spain
        • BENELUX
        • Nordic
        • Rest of W.Europe
      • By Source
      • By Form
      • By Application
      • By Distribution Channel
    • Market Attractiveness Analysis
      • By Country
      • By Source
      • By Form
      • By Application
      • By Distribution Channel
    • Key Takeaways
  14. Eastern Europe Market Analysis 2020 to 2024 and Forecast 2025 to 2035, By Country
    • Historical Market Size Value (USD Million) & Volume (Metric Tons) Trend Analysis By Market Taxonomy, 2020 to 2024
    • Market Size Value (USD Million) & Volume (Metric Tons) Forecast By Market Taxonomy, 2025 to 2035
      • By Country
        • Russia
        • Hungary
        • Poland
        • Balkan & Baltics
        • Rest of E. Europe
      • By Source
      • By Form
      • By Application
      • By Distribution Channel
    • Market Attractiveness Analysis
      • By Country
      • By Source
      • By Form
      • By Application
      • By Distribution Channel
    • Key Takeaways
  15. East Asia Market Analysis 2020 to 2024 and Forecast 2025 to 2035, By Country
    • Historical Market Size Value (USD Million) & Volume (Metric Tons) Trend Analysis By Market Taxonomy, 2020 to 2024
    • Market Size Value (USD Million) & Volume (Metric Tons) Forecast By Market Taxonomy, 2025 to 2035
      • By Country
        • China
        • Japan
        • South Korea
      • By Source
      • By Form
      • By Application
      • By Distribution Channel
    • Market Attractiveness Analysis
      • By Country
      • By Source
      • By Form
      • By Application
      • By Distribution Channel
    • Key Takeaways
  16. South Asia & Pacific Market Analysis 2020 to 2024 and Forecast 2025 to 2035, By Country
    • Historical Market Size Value (USD Million) & Volume (Metric Tons) Trend Analysis By Market Taxonomy, 2020 to 2024
    • Market Size Value (USD Million) & Volume (Metric Tons) Forecast By Market Taxonomy, 2025 to 2035
      • By Country
        • India
        • Australia & New Zealand
        • ASEAN
        • Rest of SAP
      • By Source
      • By Form
      • By Application
      • By Distribution Channel
    • Market Attractiveness Analysis
      • By Country
      • By Source
      • By Form
      • By Application
      • By Distribution Channel
    • Key Takeaways
  17. Middle East and Africa Market Analysis 2020 to 2024 and Forecast 2025 to 2035, By Country
    • Historical Market Size Value (USD Million) & Volume (Metric Tons) Trend Analysis By Market Taxonomy, 2020 to 2024
    • Market Size Value (USD Million) & Volume (Metric Tons) Forecast By Market Taxonomy, 2025 to 2035
      • By Country
        • GCC Countries
        • Northern Africa
        • South Africa
        • Turkiye
        • Rest of MEA
      • By Source
      • By Form
      • By Application
      • By Distribution Channel
    • Market Attractiveness Analysis
      • By Country
      • By Source
      • By Form
      • By Application
      • By Distribution Channel
    • Key Takeaways
  18. Key Countries Market Analysis
    • USA
      • Pricing Analysis
      • Market Share Analysis, 2024
        • By Source
        • By Form
        • By Application
        • By Distribution Channel
    • Canada
      • Pricing Analysis
      • Market Share Analysis, 2024
        • By Source
        • By Form
        • By Application
        • By Distribution Channel
    • Brazil
      • Pricing Analysis
      • Market Share Analysis, 2024
        • By Source
        • By Form
        • By Application
        • By Distribution Channel
    • Mexico
      • Pricing Analysis
      • Market Share Analysis, 2024
        • By Source
        • By Form
        • By Application
        • By Distribution Channel
    • Argentina
      • Pricing Analysis
      • Market Share Analysis, 2024
        • By Source
        • By Form
        • By Application
        • By Distribution Channel
  19. Market Structure Analysis
    • Competition Dashboard
    • Competition Benchmarking
    • Market Share Analysis of Top Players
      • By Regional
      • By Source
      • By Form
      • By Application
      • By Distribution Channel
  20. Competition Analysis
    • Competition Deep Dive
      • DLC laboratories
        • Overview
        • Product Portfolio
        • Profitability by Market Segments (Product/Age /Sales Channel/Region)
        • Sales Footprint
        • Strategy Overview
          • Marketing Strategy
          • Product Strategy
          • Channel Strategy
      • Shaanxi Jintai Biological Engineering
        • Overview
        • Product Portfolio
        • Profitability by Market Segments (Product/Age /Sales Channel/Region)
        • Sales Footprint
        • Strategy Overview
          • Marketing Strategy
          • Product Strategy
          • Channel Strategy
      • APC Pure
        • Overview
        • Product Portfolio
        • Profitability by Market Segments (Product/Age /Sales Channel/Region)
        • Sales Footprint
        • Strategy Overview
          • Marketing Strategy
          • Product Strategy
          • Channel Strategy
      • Nature’s Answer
        • Overview
        • Product Portfolio
        • Profitability by Market Segments (Product/Age /Sales Channel/Region)
        • Sales Footprint
        • Strategy Overview
          • Marketing Strategy
          • Product Strategy
          • Channel Strategy
      • Changsha Vigorous-Tech
        • Overview
        • Product Portfolio
        • Profitability by Market Segments (Product/Age /Sales Channel/Region)
        • Sales Footprint
        • Strategy Overview
          • Marketing Strategy
          • Product Strategy
          • Channel Strategy
      • Swanson Health Products
        • Overview
        • Product Portfolio
        • Profitability by Market Segments (Product/Age /Sales Channel/Region)
        • Sales Footprint
        • Strategy Overview
          • Marketing Strategy
          • Product Strategy
          • Channel Strategy
      • Sichuan Xiaoye Bencao Biotechnology
        • Overview
        • Product Portfolio
        • Profitability by Market Segments (Product/Age /Sales Channel/Region)
        • Sales Footprint
        • Strategy Overview
          • Marketing Strategy
          • Product Strategy
          • Channel Strategy
      • Vital Nutrients
        • Overview
        • Product Portfolio
        • Profitability by Market Segments (Product/Age /Sales Channel/Region)
        • Sales Footprint
        • Strategy Overview
          • Marketing Strategy
          • Product Strategy
          • Channel Strategy
      • Bell’s Healthcare
        • Overview
        • Product Portfolio
        • Profitability by Market Segments (Product/Age /Sales Channel/Region)
        • Sales Footprint
        • Strategy Overview
          • Marketing Strategy
          • Product Strategy
          • Channel Strategy
      • The Bach Centre
        • Overview
        • Product Portfolio
        • Profitability by Market Segments (Product/Age /Sales Channel/Region)
        • Sales Footprint
        • Strategy Overview
          • Marketing Strategy
          • Product Strategy
          • Channel Strategy
      • Shaanxi Undersun Biomedtech
        • Overview
        • Product Portfolio
        • Profitability by Market Segments (Product/Age /Sales Channel/Region)
        • Sales Footprint
        • Strategy Overview
          • Marketing Strategy
          • Product Strategy
          • Channel Strategy
      • Xi'an DN Biology
        • Overview
        • Product Portfolio
        • Profitability by Market Segments (Product/Age /Sales Channel/Region)
        • Sales Footprint
        • Strategy Overview
          • Marketing Strategy
          • Product Strategy
          • Channel Strategy
      • Bio-Botanica
        • Overview
        • Product Portfolio
        • Profitability by Market Segments (Product/Age /Sales Channel/Region)
        • Sales Footprint
        • Strategy Overview
          • Marketing Strategy
          • Product Strategy
          • Channel Strategy
      • Xi'an Lyphar Biotech
        • Overview
        • Product Portfolio
        • Profitability by Market Segments (Product/Age /Sales Channel/Region)
        • Sales Footprint
        • Strategy Overview
          • Marketing Strategy
          • Product Strategy
          • Channel Strategy
  21. Assumptions & Acronyms Used
  22. Research Methodology

List of Tables

  • Table 1: Global Market Value (USD Million) Forecast by Region, 2020-2035
  • Table 2: Global Market Volume (Metric Tons) Forecast by Region, 2020-2035
  • Table 3: Global Market Value (USD Million) Forecast by Source, 2020-2035
  • Table 4: Global Market Volume (Metric Tons) Forecast by Source, 2020-2035
  • Table 5: Global Market Value (USD Million) Forecast by Form, 2020-2035
  • Table 6: Global Market Volume (Metric Tons) Forecast by Form, 2020-2035
  • Table 7: Global Market Value (USD Million) Forecast by Application, 2020-2035
  • Table 8: Global Market Volume (Metric Tons) Forecast by Application, 2020-2035
  • Table 9: Global Market Value (USD Million) Forecast by Distribution Channel, 2020-2035
  • Table 10: Global Market Volume (Metric Tons) Forecast by Distribution Channel, 2020-2035
  • Table 11: North America Market Value (USD Million) Forecast by Country, 2020-2035
  • Table 12: North America Market Volume (Metric Tons) Forecast by Country, 2020-2035
  • Table 13: North America Market Value (USD Million) Forecast by Source, 2020-2035
  • Table 14: North America Market Volume (Metric Tons) Forecast by Source, 2020-2035
  • Table 15: North America Market Value (USD Million) Forecast by Form, 2020-2035
  • Table 16: North America Market Volume (Metric Tons) Forecast by Form, 2020-2035
  • Table 17: North America Market Value (USD Million) Forecast by Application, 2020-2035
  • Table 18: North America Market Volume (Metric Tons) Forecast by Application, 2020-2035
  • Table 19: North America Market Value (USD Million) Forecast by Distribution Channel, 2020-2035
  • Table 20: North America Market Volume (Metric Tons) Forecast by Distribution Channel, 2020-2035
  • Table 21: Latin America Market Value (USD Million) Forecast by Country, 2020-2035
  • Table 22: Latin America Market Volume (Metric Tons) Forecast by Country, 2020-2035
  • Table 23: Latin America Market Value (USD Million) Forecast by Source, 2020-2035
  • Table 24: Latin America Market Volume (Metric Tons) Forecast by Source, 2020-2035
  • Table 25: Latin America Market Value (USD Million) Forecast by Form, 2020-2035
  • Table 26: Latin America Market Volume (Metric Tons) Forecast by Form, 2020-2035
  • Table 27: Latin America Market Value (USD Million) Forecast by Application, 2020-2035
  • Table 28: Latin America Market Volume (Metric Tons) Forecast by Application, 2020-2035
  • Table 29: Latin America Market Value (USD Million) Forecast by Distribution Channel, 2020-2035
  • Table 30: Latin America Market Volume (Metric Tons) Forecast by Distribution Channel, 2020-2035
  • Table 31: Western Europe Market Value (USD Million) Forecast by Country, 2020-2035
  • Table 32: Western Europe Market Volume (Metric Tons) Forecast by Country, 2020-2035
  • Table 33: Western Europe Market Value (USD Million) Forecast by Source, 2020-2035
  • Table 34: Western Europe Market Volume (Metric Tons) Forecast by Source, 2020-2035
  • Table 35: Western Europe Market Value (USD Million) Forecast by Form, 2020-2035
  • Table 36: Western Europe Market Volume (Metric Tons) Forecast by Form, 2020-2035
  • Table 37: Western Europe Market Value (USD Million) Forecast by Application, 2020-2035
  • Table 38: Western Europe Market Volume (Metric Tons) Forecast by Application, 2020-2035
  • Table 39: Western Europe Market Value (USD Million) Forecast by Distribution Channel, 2020-2035
  • Table 40: Western Europe Market Volume (Metric Tons) Forecast by Distribution Channel, 2020-2035
  • Table 41: Eastern Europe Market Value (USD Million) Forecast by Country, 2020-2035
  • Table 42: Eastern Europe Market Volume (Metric Tons) Forecast by Country, 2020-2035
  • Table 43: Eastern Europe Market Value (USD Million) Forecast by Source, 2020-2035
  • Table 44: Eastern Europe Market Volume (Metric Tons) Forecast by Source, 2020-2035
  • Table 45: Eastern Europe Market Value (USD Million) Forecast by Form, 2020-2035
  • Table 46: Eastern Europe Market Volume (Metric Tons) Forecast by Form, 2020-2035
  • Table 47: Eastern Europe Market Value (USD Million) Forecast by Application, 2020-2035
  • Table 48: Eastern Europe Market Volume (Metric Tons) Forecast by Application, 2020-2035
  • Table 49: Eastern Europe Market Value (USD Million) Forecast by Distribution Channel, 2020-2035
  • Table 50: Eastern Europe Market Volume (Metric Tons) Forecast by Distribution Channel, 2020-2035
  • Table 51: East Asia Market Value (USD Million) Forecast by Country, 2020-2035
  • Table 52: East Asia Market Volume (Metric Tons) Forecast by Country, 2020-2035
  • Table 53: East Asia Market Value (USD Million) Forecast by Source, 2020-2035
  • Table 54: East Asia Market Volume (Metric Tons) Forecast by Source, 2020-2035
  • Table 55: East Asia Market Value (USD Million) Forecast by Form, 2020-2035
  • Table 56: East Asia Market Volume (Metric Tons) Forecast by Form, 2020-2035
  • Table 57: East Asia Market Value (USD Million) Forecast by Application, 2020-2035
  • Table 58: East Asia Market Volume (Metric Tons) Forecast by Application, 2020-2035
  • Table 59: East Asia Market Value (USD Million) Forecast by Distribution Channel, 2020-2035
  • Table 60: East Asia Market Volume (Metric Tons) Forecast by Distribution Channel, 2020-2035
  • Table 61: South Asia & Pacific Market Value (USD Million) Forecast by Country, 2020-2035
  • Table 62: South Asia & Pacific Market Volume (Metric Tons) Forecast by Country, 2020-2035
  • Table 63: South Asia & Pacific Market Value (USD Million) Forecast by Source, 2020-2035
  • Table 64: South Asia & Pacific Market Volume (Metric Tons) Forecast by Source, 2020-2035
  • Table 65: South Asia & Pacific Market Value (USD Million) Forecast by Form, 2020-2035
  • Table 66: South Asia & Pacific Market Volume (Metric Tons) Forecast by Form, 2020-2035
  • Table 67: South Asia & Pacific Market Value (USD Million) Forecast by Application, 2020-2035
  • Table 68: South Asia & Pacific Market Volume (Metric Tons) Forecast by Application, 2020-2035
  • Table 69: South Asia & Pacific Market Value (USD Million) Forecast by Distribution Channel, 2020-2035
  • Table 70: South Asia & Pacific Market Volume (Metric Tons) Forecast by Distribution Channel, 2020-2035
  • Table 71: Middle East and Africa Market Value (USD Million) Forecast by Country, 2020-2035
  • Table 72: Middle East and Africa Market Volume (Metric Tons) Forecast by Country, 2020-2035
  • Table 73: Middle East and Africa Market Value (USD Million) Forecast by Source, 2020-2035
  • Table 74: Middle East and Africa Market Volume (Metric Tons) Forecast by Source, 2020-2035
  • Table 75: Middle East and Africa Market Value (USD Million) Forecast by Form, 2020-2035
  • Table 76: Middle East and Africa Market Volume (Metric Tons) Forecast by Form, 2020-2035
  • Table 77: Middle East and Africa Market Value (USD Million) Forecast by Application, 2020-2035
  • Table 78: Middle East and Africa Market Volume (Metric Tons) Forecast by Application, 2020-2035
  • Table 79: Middle East and Africa Market Value (USD Million) Forecast by Distribution Channel, 2020-2035
  • Table 80: Middle East and Africa Market Volume (Metric Tons) Forecast by Distribution Channel, 2020-2035

List of Figures

  • Figure 1: Global Market Volume (Metric Tons) Forecast 2020-2035
  • Figure 2: Global Market Pricing Analysis
  • Figure 3: Global Market Value (USD Million) Forecast 2020-2035
  • Figure 4: Global Market Value Share and BPS Analysis by Source, 2025 and 2035
  • Figure 5: Global Market Y-o-Y Growth Comparison by Source, 2025-2035
  • Figure 6: Global Market Attractiveness Analysis by Source
  • Figure 7: Global Market Value Share and BPS Analysis by Form, 2025 and 2035
  • Figure 8: Global Market Y-o-Y Growth Comparison by Form, 2025-2035
  • Figure 9: Global Market Attractiveness Analysis by Form
  • Figure 10: Global Market Value Share and BPS Analysis by Application, 2025 and 2035
  • Figure 11: Global Market Y-o-Y Growth Comparison by Application, 2025-2035
  • Figure 12: Global Market Attractiveness Analysis by Application
  • Figure 13: Global Market Value Share and BPS Analysis by Distribution Channel, 2025 and 2035
  • Figure 14: Global Market Y-o-Y Growth Comparison by Distribution Channel, 2025-2035
  • Figure 15: Global Market Attractiveness Analysis by Distribution Channel
  • Figure 16: Global Market Value (USD Million) Share and BPS Analysis by Region, 2025 and 2035
  • Figure 17: Global Market Y-o-Y Growth Comparison by Region, 2025-2035
  • Figure 18: Global Market Attractiveness Analysis by Region
  • Figure 19: North America Market Incremental $ Opportunity, 2025-2035
  • Figure 20: Latin America Market Incremental $ Opportunity, 2025-2035
  • Figure 21: Western Europe Market Incremental $ Opportunity, 2025-2035
  • Figure 22: Eastern Europe Market Incremental $ Opportunity, 2025-2035
  • Figure 23: East Asia Market Incremental $ Opportunity, 2025-2035
  • Figure 24: South Asia & Pacific Market Incremental $ Opportunity, 2025-2035
  • Figure 25: Middle East and Africa Market Incremental $ Opportunity, 2025-2035
  • Figure 26: North America Market Value Share and BPS Analysis by Country, 2025 and 2035
  • Figure 27: North America Market Value Share and BPS Analysis by Source, 2025 and 2035
  • Figure 28: North America Market Y-o-Y Growth Comparison by Source, 2025-2035
  • Figure 29: North America Market Attractiveness Analysis by Source
  • Figure 30: North America Market Value Share and BPS Analysis by Form, 2025 and 2035
  • Figure 31: North America Market Y-o-Y Growth Comparison by Form, 2025-2035
  • Figure 32: North America Market Attractiveness Analysis by Form
  • Figure 33: North America Market Value Share and BPS Analysis by Application, 2025 and 2035
  • Figure 34: North America Market Y-o-Y Growth Comparison by Application, 2025-2035
  • Figure 35: North America Market Attractiveness Analysis by Application
  • Figure 36: North America Market Value Share and BPS Analysis by Distribution Channel, 2025 and 2035
  • Figure 37: North America Market Y-o-Y Growth Comparison by Distribution Channel, 2025-2035
  • Figure 38: North America Market Attractiveness Analysis by Distribution Channel
  • Figure 39: Latin America Market Value Share and BPS Analysis by Country, 2025 and 2035
  • Figure 40: Latin America Market Value Share and BPS Analysis by Source, 2025 and 2035
  • Figure 41: Latin America Market Y-o-Y Growth Comparison by Source, 2025-2035
  • Figure 42: Latin America Market Attractiveness Analysis by Source
  • Figure 43: Latin America Market Value Share and BPS Analysis by Form, 2025 and 2035
  • Figure 44: Latin America Market Y-o-Y Growth Comparison by Form, 2025-2035
  • Figure 45: Latin America Market Attractiveness Analysis by Form
  • Figure 46: Latin America Market Value Share and BPS Analysis by Application, 2025 and 2035
  • Figure 47: Latin America Market Y-o-Y Growth Comparison by Application, 2025-2035
  • Figure 48: Latin America Market Attractiveness Analysis by Application
  • Figure 49: Latin America Market Value Share and BPS Analysis by Distribution Channel, 2025 and 2035
  • Figure 50: Latin America Market Y-o-Y Growth Comparison by Distribution Channel, 2025-2035
  • Figure 51: Latin America Market Attractiveness Analysis by Distribution Channel
  • Figure 52: Western Europe Market Value Share and BPS Analysis by Country, 2025 and 2035
  • Figure 53: Western Europe Market Value Share and BPS Analysis by Source, 2025 and 2035
  • Figure 54: Western Europe Market Y-o-Y Growth Comparison by Source, 2025-2035
  • Figure 55: Western Europe Market Attractiveness Analysis by Source
  • Figure 56: Western Europe Market Value Share and BPS Analysis by Form, 2025 and 2035
  • Figure 57: Western Europe Market Y-o-Y Growth Comparison by Form, 2025-2035
  • Figure 58: Western Europe Market Attractiveness Analysis by Form
  • Figure 59: Western Europe Market Value Share and BPS Analysis by Application, 2025 and 2035
  • Figure 60: Western Europe Market Y-o-Y Growth Comparison by Application, 2025-2035
  • Figure 61: Western Europe Market Attractiveness Analysis by Application
  • Figure 62: Western Europe Market Value Share and BPS Analysis by Distribution Channel, 2025 and 2035
  • Figure 63: Western Europe Market Y-o-Y Growth Comparison by Distribution Channel, 2025-2035
  • Figure 64: Western Europe Market Attractiveness Analysis by Distribution Channel
  • Figure 65: Eastern Europe Market Value Share and BPS Analysis by Country, 2025 and 2035
  • Figure 66: Eastern Europe Market Value Share and BPS Analysis by Source, 2025 and 2035
  • Figure 67: Eastern Europe Market Y-o-Y Growth Comparison by Source, 2025-2035
  • Figure 68: Eastern Europe Market Attractiveness Analysis by Source
  • Figure 69: Eastern Europe Market Value Share and BPS Analysis by Form, 2025 and 2035
  • Figure 70: Eastern Europe Market Y-o-Y Growth Comparison by Form, 2025-2035
  • Figure 71: Eastern Europe Market Attractiveness Analysis by Form
  • Figure 72: Eastern Europe Market Value Share and BPS Analysis by Application, 2025 and 2035
  • Figure 73: Eastern Europe Market Y-o-Y Growth Comparison by Application, 2025-2035
  • Figure 74: Eastern Europe Market Attractiveness Analysis by Application
  • Figure 75: Eastern Europe Market Value Share and BPS Analysis by Distribution Channel, 2025 and 2035
  • Figure 76: Eastern Europe Market Y-o-Y Growth Comparison by Distribution Channel, 2025-2035
  • Figure 77: Eastern Europe Market Attractiveness Analysis by Distribution Channel
  • Figure 78: East Asia Market Value Share and BPS Analysis by Country, 2025 and 2035
  • Figure 79: East Asia Market Value Share and BPS Analysis by Source, 2025 and 2035
  • Figure 80: East Asia Market Y-o-Y Growth Comparison by Source, 2025-2035
  • Figure 81: East Asia Market Attractiveness Analysis by Source
  • Figure 82: East Asia Market Value Share and BPS Analysis by Form, 2025 and 2035
  • Figure 83: East Asia Market Y-o-Y Growth Comparison by Form, 2025-2035
  • Figure 84: East Asia Market Attractiveness Analysis by Form
  • Figure 85: East Asia Market Value Share and BPS Analysis by Application, 2025 and 2035
  • Figure 86: East Asia Market Y-o-Y Growth Comparison by Application, 2025-2035
  • Figure 87: East Asia Market Attractiveness Analysis by Application
  • Figure 88: East Asia Market Value Share and BPS Analysis by Distribution Channel, 2025 and 2035
  • Figure 89: East Asia Market Y-o-Y Growth Comparison by Distribution Channel, 2025-2035
  • Figure 90: East Asia Market Attractiveness Analysis by Distribution Channel
  • Figure 91: South Asia & Pacific Market Value Share and BPS Analysis by Country, 2025 and 2035
  • Figure 92: South Asia & Pacific Market Value Share and BPS Analysis by Source, 2025 and 2035
  • Figure 93: South Asia & Pacific Market Y-o-Y Growth Comparison by Source, 2025-2035
  • Figure 94: South Asia & Pacific Market Attractiveness Analysis by Source
  • Figure 95: South Asia & Pacific Market Value Share and BPS Analysis by Form, 2025 and 2035
  • Figure 96: South Asia & Pacific Market Y-o-Y Growth Comparison by Form, 2025-2035
  • Figure 97: South Asia & Pacific Market Attractiveness Analysis by Form
  • Figure 98: South Asia & Pacific Market Value Share and BPS Analysis by Application, 2025 and 2035
  • Figure 99: South Asia & Pacific Market Y-o-Y Growth Comparison by Application, 2025-2035
  • Figure 100: South Asia & Pacific Market Attractiveness Analysis by Application
  • Figure 101: South Asia & Pacific Market Value Share and BPS Analysis by Distribution Channel, 2025 and 2035
  • Figure 102: South Asia & Pacific Market Y-o-Y Growth Comparison by Distribution Channel, 2025-2035
  • Figure 103: South Asia & Pacific Market Attractiveness Analysis by Distribution Channel
  • Figure 104: Middle East and Africa Market Value Share and BPS Analysis by Country, 2025 and 2035
  • Figure 105: Middle East and Africa Market Value Share and BPS Analysis by Source, 2025 and 2035
  • Figure 106: Middle East and Africa Market Y-o-Y Growth Comparison by Source, 2025-2035
  • Figure 107: Middle East and Africa Market Attractiveness Analysis by Source
  • Figure 108: Middle East and Africa Market Value Share and BPS Analysis by Form, 2025 and 2035
  • Figure 109: Middle East and Africa Market Y-o-Y Growth Comparison by Form, 2025-2035
  • Figure 110: Middle East and Africa Market Attractiveness Analysis by Form
  • Figure 111: Middle East and Africa Market Value Share and BPS Analysis by Application, 2025 and 2035
  • Figure 112: Middle East and Africa Market Y-o-Y Growth Comparison by Application, 2025-2035
  • Figure 113: Middle East and Africa Market Attractiveness Analysis by Application
  • Figure 114: Middle East and Africa Market Value Share and BPS Analysis by Distribution Channel, 2025 and 2035
  • Figure 115: Middle East and Africa Market Y-o-Y Growth Comparison by Distribution Channel, 2025-2035
  • Figure 116: Middle East and Africa Market Attractiveness Analysis by Distribution Channel
  • Figure 117: Global Market - Tier Structure Analysis
  • Figure 118: Global Market - Company Share Analysis

Frequently Asked Questions

How big is the gentian market in 2025?

The global gentian market is estimated to be valued at USD 510.3 million in 2025.

What will be the size of gentian market in 2035?

The gentian market size is projected to reach USD 755.4 million by 2035.

How much will be the gentian market growth between 2025 and 2035?

The gentian market is expected to grow at a 4.0% CAGR between 2025 and 2035.

Which source segment is projected to lead in the gentian market in 2025?

The conventional source segment is projected to lead in the gentian market with 70% market share in 2025.

Which application segment is expected to contribute significant share in the gentian market in 2025?

The pharmaceutical industry segment is expected to command 50% share in the gentian market in 2025.

Future Market Insights

Gentian Market