Reports

- Global Locations -

Headquarters

Future Market Insights, Inc.

Christiana Corporate, 200
Continental Drive, Suite 401,
Newark, Delaware - 19713,
United States

T: +1-845-579-5705

Americas

Future Market Insights, Inc.

616 Corporate Way, Suite 2-9018,
Valley Cottage, NY 10989, United States

T: +1-347-918-3531

MEA

Future Market Insights

1602-6 Jumeirah Bay X2 Tower, Plot No: JLT-PH2-X2A,
Jumeirah Lakes Towers, Dubai,
United Arab Emirates

Europe

Future Market Insights

3rd Floor, 207 Regent Street,
W1B 3HH London
United Kingdom

T: + 44 (0) 20 8123 9659
D: +44 (0) 20 3287 4268

Asia Pacific

Future Market Insights

IndiaLand Global Tech Park, Unit UG-1, Behind Grand HighStreet, Phase 1, Hinjawadi, MH, Pune – 411057, India

HSM-as-a-Service Market Outlook (2023 to 2033)

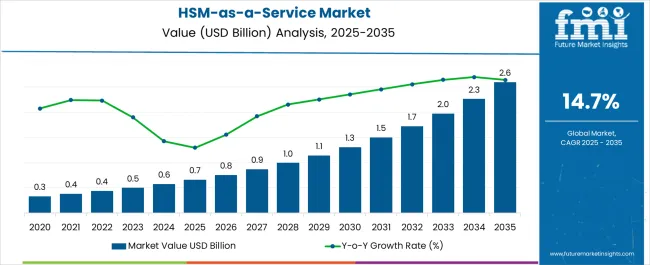
The global HSM-as-a-service market size totaled US$ 500.6 million in 2023. The market is expected to reach US$ 1,978.6 million by 2033, capturing a CAGR of 14.7% between 2023 and 2033.

HSM-as-a-service is capable of managing encryption keys. FinTechs and organizations in the financial services industry can manage all the cryptography required for their crucial channels, such as ATMs, mPOS/POS, and mobile devices. They can also use this service to support multiple standards (PCI), thereby enabling secure interactions with networks, issuers, and acquirers.

Hardware security modules (HSMs) protect belongings as bank lockers do and provide safe key management and cryptography services, such as tokenization, secret management, and cloud key management, to protect sensitive data in multi-cloud environments. The HSM-as-a-service market currently holds nearly 35% of the global hardware security modules market.

Attributes Key Statistics
Global HSM-as-a-Service Market Estimated Size (2023) US$ 500.6 million
Projected Market Valuation (2033) US$ 1,978.6 million
Value-based CAGR (2023 to 2033) 14.7%
Collective Value Share: Top 5 Vendors Around 20%

East Asia is anticipated to continue to be one of the most alluring markets for hardware security module services, as it may exhibit a CAGR between 2023 and 2033. Various countries, including China and Japan, are using advanced hardware encryption methods in their systems. The rise in cyberattacks is another vital factor driving the East Asia hardware security module services market.

Due to the deployment of HSM services for effective transaction security in payment processing environments, the BFSI and healthcare & life sciences industries in Europe are set to create new growth opportunities in the market. Additionally, it is anticipated that the current rollout of 5G infrastructure may push the demand for HSM services in Europe.

Don't pay for what you don't need

Customize your report by selecting specific countries or regions and save 30%!

2018 to 2022 HSM-as-a-Service Demand Outlook Compared to 2023 to 2033 Forecast

The HSM-as-a-service market is expected to grow at 14.3% CAGR between 2023 and 2033, in comparison with the 12.1% CAGR registered from 2018 to 2022. Users of HSM-as-a-service can create encryption keys and utilize and store them safely without worrying about time-consuming tasks like evaluating, configuring, maintaining, and updating their own HSM.

HSM-as-a-service provides consumers with a highly useful additional layer of security for storing and managing data encryption keys, doing away with the requirement of on-premises hardware devices. The service is a general-purpose key vault that may be applied to numerous use cases. Users can easily handle a wide range of sophisticated use cases from the cloud by employing HSM-as-a-service.

Various key players focus on launching cutting-edge services equipped with multiple features to attract more worldwide consumers. In June 2022, for instance, Thales announced that it is helping NAVER Cloud to introduce the first Korean sovereign cloud, HSM as a service. It is powered by the Luna Network Hardware Security Module of Thales. The new service may enable companies to meet the stringent industry and regulatory mandates for controlling their encryption and data.

Top Trend Driving Sales in the Global Market

  • Surging Adoption of User-friendly Interfaces

The global market is growing rapidly due to the rising demand for information and data security, as well as the wide technical change that increased acceptance of cutting-edge IoT and cloud computing technologies. Due to the rising adoption of a user-friendly interface to incorporate a blockchain transaction security system for clients, the market is anticipated to exhibit significant growth.

The rapidly expanding requirement for the administration of cryptographic keys is anticipated to fuel market expansion. Future-proofing the hardware protection module with effective and specialized solutions that take changing customer needs into account can be a crucial requirement.

Sudip Saha
Sudip Saha

Principal Consultant

Talk to Analyst

Find your sweet spots for generating winning opportunities in this market.

Which Factor is Expected to Hamper Growth in the Global Market?

Risks of Data Exposure May Hinder Sales of Cloud-based HSM

When a business, program, or other organization mistakenly exposes sensitive data, it gives out personal information of clients, employees, and consumers. When a database where the information is stored is not adequately protected, sensitive data may be exposed. This could happen for several reasons, such as when the data is accidentally uploaded to the wrong database or when there is inadequate or no encryption. This factor is expected to hamper the market in the next decade.

Country-wise Insights

Cloud HSM Companies in France to Come up with Advanced Solutions

Due to the growing need for data protection, France may soon experience a rise in demand for HSM services. Organizations across the country use HSM for key management, encryption, and decryption.

The solution has developed into a crucial element of a company's encryption and key management strategy. Since this deployment method has become more feasible and cost-effective, especially among mid-sized and small enterprises, the majority of businesses in France are likewise heading in that direction.

Besides, the presence of many renowned companies in France is likely to boost growth. In May 2019, Atos, a French multinational IT services firm, introduced a new hardware security module for IoT systems and a quantum simulator. The new product is a part of the company's Horus portfolio and may be available for applications running in software-as-a-service mode. Owing to the above-mentioned factors, sales in France are predicted to expand at the highest CAGR of 13.7% during the forecast period.

How Big Is the Opportunity for HSM-as-a-Service Market in the United Kingdom?

Expansion of the Retail Banking Sector in the United Kingdom to Push Demand for HSM Hosting Platforms

Strong security and fraud prevention technologies are becoming more crucial in the United Kingdom as businesses transition to the digital age. The retail banking sector handles the personal information and financial data of many customers daily; hence, sophisticated security measures are needed to safeguard this sensitive data. According to FMI, the United Kingdom held about 17.9% of the Europe market share in 2021.

To protect information cryptographically, retail banks across the country are boosting their investments in HSM services. They are shielding businesses from security flaws while enabling customers to execute transactions securely using their preferred payment method. As a result, the market for hardware security modules in the United Kingdom is experiencing increased demand due to the growth in retail banking.

As per the United Kingdom Finance report, in 2020, unauthorized financial fraud losses across checks, remote banking, and payment cards totaled £783.8 million across Europe, which is a decrease of about 5%, as compared to 2019. Thus, the need for innovative HSM services to protect crucial financial information in banks is set to drive the United Kingdom market.
What is the United States HSM-as-a-Service Market Outlook?

Pharmaceutical Industry in the United States to Use HSM Cloud Service for Cutting Shipping Cost

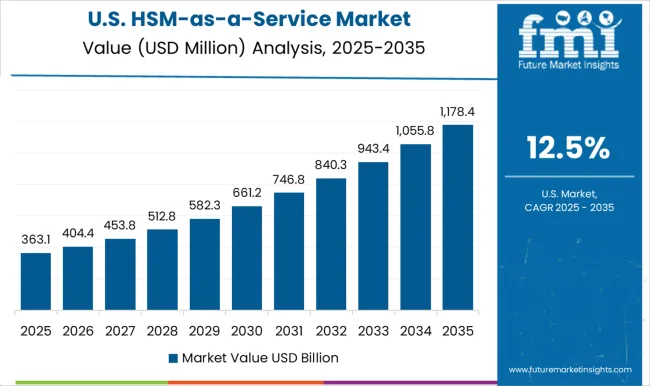
Demand for hardware security modules in the United States is anticipated to increase at a CAGR of 8.2% from 2023 to 2033, finds FMI. The presence of key manufacturers of hardware security modules like Entrust Corporation and IBM in the country is set to drive growth. These market participants are concentrating on new product launches to strengthen their positions.

For instance, Entrust Corporation announced the geographic expansion of its hardware security module service called nShield as a Service in December 2021. The business established two new data centers in Australia in response to the growing demand for cloud-based HSM services.

HSMs' code and document signing applications are helping pharmaceutical companies to cut costs on shipping and medication development. These factors are expected to help the market to grow in the United States.

Get the data you need at a Fraction of the cost

Personalize your report by choosing insights you need
and save 40%!

Category-wise Insights

Which is the Highly Preferred Service Type?

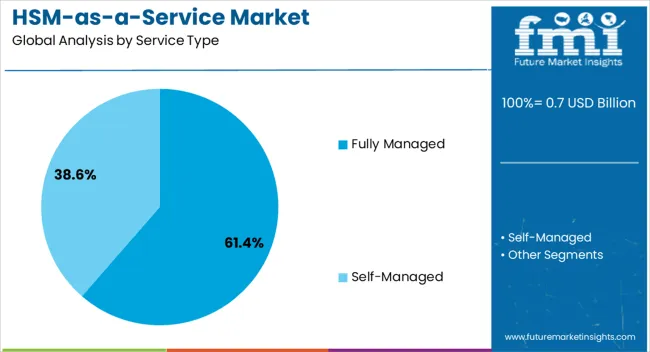
Fully Managed HSM Services to Gain Impetus in the Global Market

Business applications such as TLS/SSL encryption key protection, public key infrastructures (PKIs), code signing, digital signature, and blockchain use fully managed HSM services as the root of trust. Fully managed HSM services may continue to initiate crucial security measures like device authentication by using digital certificates as the Internet of Things develops and increases the demand for device IDs and certificates.

This service also supports the most popular operating systems and APIs in the market, as well as a wide variety of cryptographic methods, such as elliptic-curve cryptography techniques that allow for high-speed transactions perfectly suited to today's computing environments. As a result, the fully managed HSM service segment accounted for 54.5% of the market share in 2021.

Which is the Leading Industry in the Global Market?

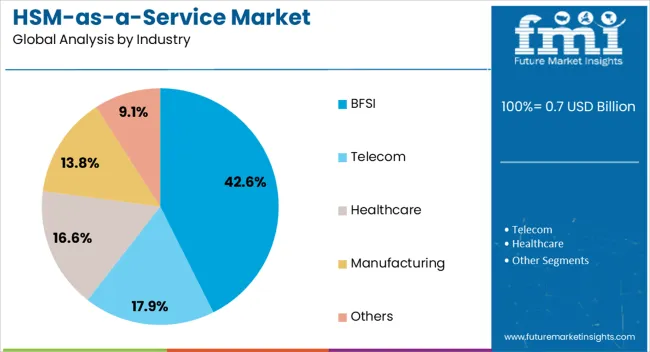
Healthcare Industry to Utilize HSM Networking to Minimize Paperwork

Pharmaceutical companies are required to adhere to stringent security and privacy regulations while producing new medications. Additionally, these businesses are routinely audited. A cloud-based HSM service enables pharmaceutical businesses to minimize paperwork, transfer documents effortlessly, automate document handling, and record regulatory-compliant signatures on portable devices like tablets and smartphones in the case of remote secure access.

Pharmaceutical firms benefit from significant shipping cost savings, accelerated time to market, and faster development of new products with the help of cloud signing solutions. On the back of these factors, the healthcare segment is anticipated to record a CAGR of 17.8% from 2023 to 2033.

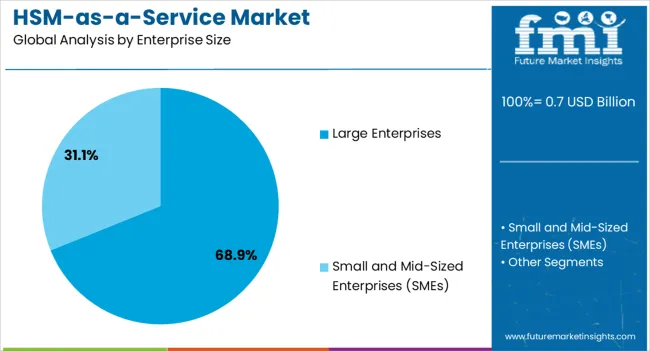
Which Enterprise Size Segment is Expected to Dominate the Market by 2033?

SMEs are Looking for Cloud-based HSM to Secure Crucial Data

Small and medium businesses have used hardware security modules for a long time to provide security functions throughout the firm. An extensive range of HSM functions is currently maintained and used for the security of data assets, including hosted data operations, authentication, and encryption key management.

A top priority is to create an encryption key management and maintenance plan, especially if small and medium businesses want to keep HSMs operating at peak efficiency throughout the duration of each encryption certificate. To fully actualize secure techniques for data security, managing encryption keys over private and public networks and hybrid mixes of physical and cloud-based HSM functions is required. As per FMI, the small and mid-sized enterprises (SMEs) segment is expected to grow at a CAGR of 14.7% from 2023 to 2033.

Competitive Landscape

Leading vendors in the global HSM-as-a-service market are introducing new products and increasing their services in emerging nations to provide improved technology and new and upgraded solutions. These vendors are focusing on improving vendor productivity and product quality by employing this method.

  • In June 2022, Futurex unveiled the hardware security module solution for its VirtuCrypt financial cloud platform. Key management and critical payment system cryptography requirements of financial services organizations are supported in the cloud by VirtuCrypt's financial cloud HSM service.
  • In October 2021, Infineon Technologies AG launched the SLS37 V2X hardware security module, a plug-and-play security solution for vehicle-to-everything communication (V2X). The new product is based on a tamper-resistant, highly secured microcontroller designed to meet the security needs of V2X applications.
  • According to Thales Group (HSM), Microsoft Azure Payment Hardware Security Module (HSM) may be available in February 2022 using payShield 10K technology. Using cryptographic key operations, this new service secures vital real-time financial transactions made in Azure.

Entrust Corporation, Utimaco, and Fortanix - The Three Musketeers of HSM-as-a-Service

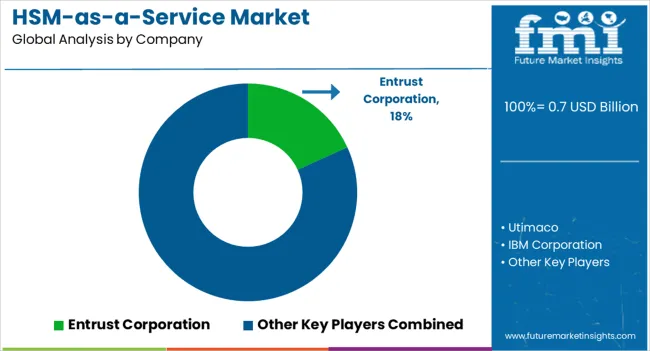
Entrust Corporation, Utimaco, and Fortanix are the top three players in the field of HSM-as-a-service. Entrust Corporation enables clients to smoothly migrate from their on-premises nShield HSM estate to nShield as a Service through its Entrust Cloud Concierge service. The company’s Professional Services team organizes and carries out the seamless migration of the current keys, customers, and applications.

In December 2021, Entrust expanded its nShield as a Service hardware security module with new data centers located in Europe. It is also planning to expand in the Asia Pacific region. Entrust nShield as a Service may help customers take advantage of nShield cloud HSM and geo-fence their significant cryptographic keys within their jurisdictions to facilitate compliance with regional data protection norms and address various concerns related to data sovereignty.

Entrust offers proactive solutions that assist businesses in complying with legal and regulatory obligations all over the world. The company has also created safe online experiences using SSL technology and protected devices & networks using the authentication product suite.

Utimaco, on the other hand, has emerged as a leading provider of HSM-as-a-service. The company's devices have been securing private and sensitive data against theft and misuse while defending people worldwide against terrorism and crime.

Utimaco's main product lines are hardware security modules and lawful interception management system solutions. To address the difficulty of keeping crypto a secret, the company offers solutions for safe key management and centralized HSM administration and monitoring.

The company's solutions provide a single point of contact for centralized, transparent monitoring, control, and administration. They also have audit logs to help with the attestation. It protects clients against unforeseen outages through a collection of HSMs placed in geographically distinct data centers and offers 99.999% availability.

Fortanix is another reputed name in the space of HSM. To protect sensitive data in public, private, hybrid, or multi-cloud environments, Fortanix Data Security Manager SaaS (DSM SaaS) is an integrated data security as a service that provides secure key management and cryptography services, including cloud key management, secret management, and tokenization. The service is entirely administered remotely, without the need for physical access. It can be accessed online and is launched with a single click in a matter of minutes.

Scope of the Report

Attribute Details
Estimated Market Size (2023) US$ 500.6 million
Projected Market Valuation (2033) US$ 1978.6 million
Value-based CAGR (2023 to 2033) 14.7%
Forecast Period 2023 to 2033
Historical Data Available for 2018 to 2022
Market Analysis Value (US$ million)
Key Regions Covered North America, Latin America, Europe, East Asia, South Asia & Pacific, and the Middle East & Africa
Key Countries Covered United States, Canada, Germany, United Kingdom, France, Italy, Spain, Russia, China, Japan, South Korea, India, Australia & New Zealand, GCC Countries, Turkey, and South Africa
Key Segments Covered Service Type, Enterprise Size, Industry, and Region
Key Companies Profiled
  • Entrust Corporation
  • Utimaco
  • IBM Corporation
  • Thales
  • Futures
  • Fortanix
  • Atos
  • Security
  • Ultra Electronics
  • Yubico
  • Syprus Inc.
  • Kryptos
  • Nitrokey
  • Adweb Technologies
  • Sansec
Report Coverage Market Forecast, Company Share Analysis, Competition Intelligence, Drivers, Restraints, Opportunities and Threats Analysis, Market Dynamics and Challenges, and Strategic Growth Initiatives

HSM-as-a-Service Market Outlook by Category

By Service Type :

  • Fully Managed
  • Self-Managed

By Enterprise Size :

  • Large Enterprises
  • Small and Mid-Sized Enterprises (SMEs)

By Industry :

  • BFSI
  • Telecom
  • Healthcare
  • Manufacturing
  • Others

By Region :

  • North America
  • Latin America
  • Europe
  • East Asia
  • South Asia & Pacific
  • The Middle East and Africa (MEA)

Frequently Asked Questions

How is the Historical Performance of the HAM-as-a-service Market?

From 2018 to 2022, the market registered a CAGR of 14.3%.

How Big will the HSM-as-a-service Market by 2033?

The HSM-as-a-service market is estimated to reach US$ 1,978.6 million by 2033.

Which Service Type Holds Lucrative Opportunities?

Fully managed HSM services hold high revenue potential.

Which Countries Dominate the HSM-as-a-service Market?

The United Kingdom, France and the United States dominate the global market.

What is the Growth Forecast for HSM-as-a-service Market?

The market is forecast to register a CAGR of 5.9% through 2033.

Table of Content

1. Executive Summary

    1.1. Global Market Outlook

    1.2. Demand-side Trends

    1.3. Supply-side Trends

    1.4. Technology Roadmap Analysis

    1.5. Analysis and Recommendations

2. Market Overview

    2.1. Market Coverage / Taxonomy

    2.2. Market Definition / Scope / Limitations

3. Market Background

    3.1. Market Dynamics

        3.1.1. Drivers

        3.1.2. Restraints

        3.1.3. Opportunity

        3.1.4. Trends

    3.2. Scenario Forecast

        3.2.1. Demand in Optimistic Scenario

        3.2.2. Demand in Likely Scenario

        3.2.3. Demand in Conservative Scenario

    3.3. Opportunity Map Analysis

    3.4. Investment Feasibility Matrix

    3.5. PESTLE and Porter’s Analysis

    3.6. Regulatory Landscape

        3.6.1. By Key Regions

        3.6.2. By Key Countries

    3.7. Regional Parent Market Outlook

4. Global Market Analysis 2018 to 2022 and Forecast, 2023 to 2033

    4.1. Historical Market Size Value (US$ Million) Analysis, 2018 to 2022

    4.2. Current and Future Market Size Value (US$ Million) Projections, 2023 to 2033

        4.2.1. Y-o-Y Growth Trend Analysis

        4.2.2. Absolute $ Opportunity Analysis

5. Global Market Analysis 2018 to 2022 and Forecast 2023 to 2033, By Service Type

    5.1. Introduction / Key Findings

    5.2. Historical Market Size Value (US$ Million) Analysis By Service Type, 2018 to 2022

    5.3. Current and Future Market Size Value (US$ Million) Analysis and Forecast By Service Type, 2023 to 2033

        5.3.1. Fully Managed

        5.3.2. Self-Managed

    5.4. Y-o-Y Growth Trend Analysis By Service Type, 2018 to 2022

    5.5. Absolute $ Opportunity Analysis By Service Type, 2023 to 2033

6. Global Market Analysis 2018 to 2022 and Forecast 2023 to 2033, By Enterprise Size

    6.1. Introduction / Key Findings

    6.2. Historical Market Size Value (US$ Million) Analysis By Enterprise Size, 2018 to 2022

    6.3. Current and Future Market Size Value (US$ Million) Analysis and Forecast By Enterprise Size, 2023 to 2033

        6.3.1. Large Enterprises

        6.3.2. Small and Mid-Sized Enterprises (SMEs)

    6.4. Y-o-Y Growth Trend Analysis By Enterprise Size, 2018 to 2022

    6.5. Absolute $ Opportunity Analysis By Enterprise Size, 2023 to 2033

7. Global Market Analysis 2018 to 2022 and Forecast 2023 to 2033, By Industry

    7.1. Introduction / Key Findings

    7.2. Historical Market Size Value (US$ Million) Analysis By Industry, 2018 to 2022

    7.3. Current and Future Market Size Value (US$ Million) Analysis and Forecast By Industry, 2023 to 2033

        7.3.1. BFSI

        7.3.2. Telecom

        7.3.3. Healthcare

        7.3.4. Manufacturing

        7.3.5. Others

    7.4. Y-o-Y Growth Trend Analysis By Industry, 2018 to 2022

    7.5. Absolute $ Opportunity Analysis By Industry, 2023 to 2033

8. Global Market Analysis 2018 to 2022 and Forecast 2023 to 2033, By Region

    8.1. Introduction

    8.2. Historical Market Size Value (US$ Million) Analysis By Region, 2018 to 2022

    8.3. Current Market Size Value (US$ Million) Analysis and Forecast By Region, 2023 to 2033

        8.3.1. North America

        8.3.2. Latin America

        8.3.3. Western Europe

        8.3.4. Eastern Europe

        8.3.5. South Asia and Pacific

        8.3.6. East Asia

        8.3.7. Middle East and Africa

    8.4. Market Attractiveness Analysis By Region

9. North America Market Analysis 2018 to 2022 and Forecast 2023 to 2033, By Country

    9.1. Historical Market Size Value (US$ Million) Trend Analysis By Market Taxonomy, 2018 to 2022

    9.2. Market Size Value (US$ Million) Forecast By Market Taxonomy, 2023 to 2033

        9.2.1. By Country

            9.2.1.1. USA

            9.2.1.2. Canada

        9.2.2. By Service Type

        9.2.3. By Enterprise Size

        9.2.4. By Industry

    9.3. Market Attractiveness Analysis

        9.3.1. By Country

        9.3.2. By Service Type

        9.3.3. By Enterprise Size

        9.3.4. By Industry

    9.4. Key Takeaways

10. Latin America Market Analysis 2018 to 2022 and Forecast 2023 to 2033, By Country

    10.1. Historical Market Size Value (US$ Million) Trend Analysis By Market Taxonomy, 2018 to 2022

    10.2. Market Size Value (US$ Million) Forecast By Market Taxonomy, 2023 to 2033

        10.2.1. By Country

            10.2.1.1. Brazil

            10.2.1.2. Mexico

            10.2.1.3. Rest of Latin America

        10.2.2. By Service Type

        10.2.3. By Enterprise Size

        10.2.4. By Industry

    10.3. Market Attractiveness Analysis

        10.3.1. By Country

        10.3.2. By Service Type

        10.3.3. By Enterprise Size

        10.3.4. By Industry

    10.4. Key Takeaways

11. Western Europe Market Analysis 2018 to 2022 and Forecast 2023 to 2033, By Country

    11.1. Historical Market Size Value (US$ Million) Trend Analysis By Market Taxonomy, 2018 to 2022

    11.2. Market Size Value (US$ Million) Forecast By Market Taxonomy, 2023 to 2033

        11.2.1. By Country

            11.2.1.1. Germany

            11.2.1.2. UK

            11.2.1.3. France

            11.2.1.4. Spain

            11.2.1.5. Italy

            11.2.1.6. Rest of Western Europe

        11.2.2. By Service Type

        11.2.3. By Enterprise Size

        11.2.4. By Industry

    11.3. Market Attractiveness Analysis

        11.3.1. By Country

        11.3.2. By Service Type

        11.3.3. By Enterprise Size

        11.3.4. By Industry

    11.4. Key Takeaways

12. Eastern Europe Market Analysis 2018 to 2022 and Forecast 2023 to 2033, By Country

    12.1. Historical Market Size Value (US$ Million) Trend Analysis By Market Taxonomy, 2018 to 2022

    12.2. Market Size Value (US$ Million) Forecast By Market Taxonomy, 2023 to 2033

        12.2.1. By Country

            12.2.1.1. Poland

            12.2.1.2. Russia

            12.2.1.3. Czech Republic

            12.2.1.4. Romania

            12.2.1.5. Rest of Eastern Europe

        12.2.2. By Service Type

        12.2.3. By Enterprise Size

        12.2.4. By Industry

    12.3. Market Attractiveness Analysis

        12.3.1. By Country

        12.3.2. By Service Type

        12.3.3. By Enterprise Size

        12.3.4. By Industry

    12.4. Key Takeaways

13. South Asia and Pacific Market Analysis 2018 to 2022 and Forecast 2023 to 2033, By Country

    13.1. Historical Market Size Value (US$ Million) Trend Analysis By Market Taxonomy, 2018 to 2022

    13.2. Market Size Value (US$ Million) Forecast By Market Taxonomy, 2023 to 2033

        13.2.1. By Country

            13.2.1.1. India

            13.2.1.2. Bangladesh

            13.2.1.3. Australia

            13.2.1.4. New Zealand

            13.2.1.5. Rest of South Asia and Pacific

        13.2.2. By Service Type

        13.2.3. By Enterprise Size

        13.2.4. By Industry

    13.3. Market Attractiveness Analysis

        13.3.1. By Country

        13.3.2. By Service Type

        13.3.3. By Enterprise Size

        13.3.4. By Industry

    13.4. Key Takeaways

14. East Asia Market Analysis 2018 to 2022 and Forecast 2023 to 2033, By Country

    14.1. Historical Market Size Value (US$ Million) Trend Analysis By Market Taxonomy, 2018 to 2022

    14.2. Market Size Value (US$ Million) Forecast By Market Taxonomy, 2023 to 2033

        14.2.1. By Country

            14.2.1.1. China

            14.2.1.2. Japan

            14.2.1.3. South Korea

        14.2.2. By Service Type

        14.2.3. By Enterprise Size

        14.2.4. By Industry

    14.3. Market Attractiveness Analysis

        14.3.1. By Country

        14.3.2. By Service Type

        14.3.3. By Enterprise Size

        14.3.4. By Industry

    14.4. Key Takeaways

15. Middle East and Africa Market Analysis 2018 to 2022 and Forecast 2023 to 2033, By Country

    15.1. Historical Market Size Value (US$ Million) Trend Analysis By Market Taxonomy, 2018 to 2022

    15.2. Market Size Value (US$ Million) Forecast By Market Taxonomy, 2023 to 2033

        15.2.1. By Country

            15.2.1.1. GCC Countries

            15.2.1.2. South Africa

            15.2.1.3. Israel

            15.2.1.4. Rest of MEA

        15.2.2. By Service Type

        15.2.3. By Enterprise Size

        15.2.4. By Industry

    15.3. Market Attractiveness Analysis

        15.3.1. By Country

        15.3.2. By Service Type

        15.3.3. By Enterprise Size

        15.3.4. By Industry

    15.4. Key Takeaways

16. Key Countries Market Analysis

    16.1. USA

        16.1.1. Pricing Analysis

        16.1.2. Market Share Analysis, 2022

            16.1.2.1. By Service Type

            16.1.2.2. By Enterprise Size

            16.1.2.3. By Industry

    16.2. Canada

        16.2.1. Pricing Analysis

        16.2.2. Market Share Analysis, 2022

            16.2.2.1. By Service Type

            16.2.2.2. By Enterprise Size

            16.2.2.3. By Industry

    16.3. Brazil

        16.3.1. Pricing Analysis

        16.3.2. Market Share Analysis, 2022

            16.3.2.1. By Service Type

            16.3.2.2. By Enterprise Size

            16.3.2.3. By Industry

    16.4. Mexico

        16.4.1. Pricing Analysis

        16.4.2. Market Share Analysis, 2022

            16.4.2.1. By Service Type

            16.4.2.2. By Enterprise Size

            16.4.2.3. By Industry

    16.5. Germany

        16.5.1. Pricing Analysis

        16.5.2. Market Share Analysis, 2022

            16.5.2.1. By Service Type

            16.5.2.2. By Enterprise Size

            16.5.2.3. By Industry

    16.6. UK

        16.6.1. Pricing Analysis

        16.6.2. Market Share Analysis, 2022

            16.6.2.1. By Service Type

            16.6.2.2. By Enterprise Size

            16.6.2.3. By Industry

    16.7. France

        16.7.1. Pricing Analysis

        16.7.2. Market Share Analysis, 2022

            16.7.2.1. By Service Type

            16.7.2.2. By Enterprise Size

            16.7.2.3. By Industry

    16.8. Spain

        16.8.1. Pricing Analysis

        16.8.2. Market Share Analysis, 2022

            16.8.2.1. By Service Type

            16.8.2.2. By Enterprise Size

            16.8.2.3. By Industry

    16.9. Italy

        16.9.1. Pricing Analysis

        16.9.2. Market Share Analysis, 2022

            16.9.2.1. By Service Type

            16.9.2.2. By Enterprise Size

            16.9.2.3. By Industry

    16.10. Poland

        16.10.1. Pricing Analysis

        16.10.2. Market Share Analysis, 2022

            16.10.2.1. By Service Type

            16.10.2.2. By Enterprise Size

            16.10.2.3. By Industry

    16.11. Russia

        16.11.1. Pricing Analysis

        16.11.2. Market Share Analysis, 2022

            16.11.2.1. By Service Type

            16.11.2.2. By Enterprise Size

            16.11.2.3. By Industry

    16.12. Czech Republic

        16.12.1. Pricing Analysis

        16.12.2. Market Share Analysis, 2022

            16.12.2.1. By Service Type

            16.12.2.2. By Enterprise Size

            16.12.2.3. By Industry

    16.13. Romania

        16.13.1. Pricing Analysis

        16.13.2. Market Share Analysis, 2022

            16.13.2.1. By Service Type

            16.13.2.2. By Enterprise Size

            16.13.2.3. By Industry

    16.14. India

        16.14.1. Pricing Analysis

        16.14.2. Market Share Analysis, 2022

            16.14.2.1. By Service Type

            16.14.2.2. By Enterprise Size

            16.14.2.3. By Industry

    16.15. Bangladesh

        16.15.1. Pricing Analysis

        16.15.2. Market Share Analysis, 2022

            16.15.2.1. By Service Type

            16.15.2.2. By Enterprise Size

            16.15.2.3. By Industry

    16.16. Australia

        16.16.1. Pricing Analysis

        16.16.2. Market Share Analysis, 2022

            16.16.2.1. By Service Type

            16.16.2.2. By Enterprise Size

            16.16.2.3. By Industry

    16.17. New Zealand

        16.17.1. Pricing Analysis

        16.17.2. Market Share Analysis, 2022

            16.17.2.1. By Service Type

            16.17.2.2. By Enterprise Size

            16.17.2.3. By Industry

    16.18. China

        16.18.1. Pricing Analysis

        16.18.2. Market Share Analysis, 2022

            16.18.2.1. By Service Type

            16.18.2.2. By Enterprise Size

            16.18.2.3. By Industry

    16.19. Japan

        16.19.1. Pricing Analysis

        16.19.2. Market Share Analysis, 2022

            16.19.2.1. By Service Type

            16.19.2.2. By Enterprise Size

            16.19.2.3. By Industry

    16.20. South Korea

        16.20.1. Pricing Analysis

        16.20.2. Market Share Analysis, 2022

            16.20.2.1. By Service Type

            16.20.2.2. By Enterprise Size

            16.20.2.3. By Industry

    16.21. GCC Countries

        16.21.1. Pricing Analysis

        16.21.2. Market Share Analysis, 2022

            16.21.2.1. By Service Type

            16.21.2.2. By Enterprise Size

            16.21.2.3. By Industry

    16.22. South Africa

        16.22.1. Pricing Analysis

        16.22.2. Market Share Analysis, 2022

            16.22.2.1. By Service Type

            16.22.2.2. By Enterprise Size

            16.22.2.3. By Industry

    16.23. Israel

        16.23.1. Pricing Analysis

        16.23.2. Market Share Analysis, 2022

            16.23.2.1. By Service Type

            16.23.2.2. By Enterprise Size

            16.23.2.3. By Industry

17. Market Structure Analysis

    17.1. Competition Dashboard

    17.2. Competition Benchmarking

    17.3. Market Share Analysis of Top Players

        17.3.1. By Regional

        17.3.2. By Service Type

        17.3.3. By Enterprise Size

        17.3.4. By Industry

18. Competition Analysis

    18.1. Competition Deep Dive

        18.1.1. Entrust Corporation

            18.1.1.1. Overview

            18.1.1.2. Product Portfolio

            18.1.1.3. Profitability by Market Segments

            18.1.1.4. Sales Footprint

            18.1.1.5. Strategy Overview

                18.1.1.5.1. Marketing Strategy

        18.1.2. Utimaco

            18.1.2.1. Overview

            18.1.2.2. Product Portfolio

            18.1.2.3. Profitability by Market Segments

            18.1.2.4. Sales Footprint

            18.1.2.5. Strategy Overview

                18.1.2.5.1. Marketing Strategy

        18.1.3. IBM Corporation

            18.1.3.1. Overview

            18.1.3.2. Product Portfolio

            18.1.3.3. Profitability by Market Segments

            18.1.3.4. Sales Footprint

            18.1.3.5. Strategy Overview

                18.1.3.5.1. Marketing Strategy

        18.1.4. Thales

            18.1.4.1. Overview

            18.1.4.2. Product Portfolio

            18.1.4.3. Profitability by Market Segments

            18.1.4.4. Sales Footprint

            18.1.4.5. Strategy Overview

                18.1.4.5.1. Marketing Strategy

        18.1.5. Futures

            18.1.5.1. Overview

            18.1.5.2. Product Portfolio

            18.1.5.3. Profitability by Market Segments

            18.1.5.4. Sales Footprint

            18.1.5.5. Strategy Overview

                18.1.5.5.1. Marketing Strategy

        18.1.6. Fortanix

            18.1.6.1. Overview

            18.1.6.2. Product Portfolio

            18.1.6.3. Profitability by Market Segments

            18.1.6.4. Sales Footprint

            18.1.6.5. Strategy Overview

                18.1.6.5.1. Marketing Strategy

        18.1.7. Atos

            18.1.7.1. Overview

            18.1.7.2. Product Portfolio

            18.1.7.3. Profitability by Market Segments

            18.1.7.4. Sales Footprint

            18.1.7.5. Strategy Overview

                18.1.7.5.1. Marketing Strategy

        18.1.8. Security

            18.1.8.1. Overview

            18.1.8.2. Product Portfolio

            18.1.8.3. Profitability by Market Segments

            18.1.8.4. Sales Footprint

            18.1.8.5. Strategy Overview

                18.1.8.5.1. Marketing Strategy

        18.1.9. Ultra Electronics

            18.1.9.1. Overview

            18.1.9.2. Product Portfolio

            18.1.9.3. Profitability by Market Segments

            18.1.9.4. Sales Footprint

            18.1.9.5. Strategy Overview

                18.1.9.5.1. Marketing Strategy

        18.1.10. Yubico

            18.1.10.1. Overview

            18.1.10.2. Product Portfolio

            18.1.10.3. Profitability by Market Segments

            18.1.10.4. Sales Footprint

            18.1.10.5. Strategy Overview

                18.1.10.5.1. Marketing Strategy

        18.1.11. Syprus Inc.

            18.1.11.1. Overview

            18.1.11.2. Product Portfolio

            18.1.11.3. Profitability by Market Segments

            18.1.11.4. Sales Footprint

            18.1.11.5. Strategy Overview

                18.1.11.5.1. Marketing Strategy

        18.1.12. Kryptos

            18.1.12.1. Overview

            18.1.12.2. Product Portfolio

            18.1.12.3. Profitability by Market Segments

            18.1.12.4. Sales Footprint

            18.1.12.5. Strategy Overview

                18.1.12.5.1. Marketing Strategy

        18.1.13. Nitrokey

            18.1.13.1. Overview

            18.1.13.2. Product Portfolio

            18.1.13.3. Profitability by Market Segments

            18.1.13.4. Sales Footprint

            18.1.13.5. Strategy Overview

                18.1.13.5.1. Marketing Strategy

        18.1.14. Adweb Technologies

            18.1.14.1. Overview

            18.1.14.2. Product Portfolio

            18.1.14.3. Profitability by Market Segments

            18.1.14.4. Sales Footprint

            18.1.14.5. Strategy Overview

                18.1.14.5.1. Marketing Strategy

        18.1.15. Sansec

            18.1.15.1. Overview

            18.1.15.2. Product Portfolio

            18.1.15.3. Profitability by Market Segments

            18.1.15.4. Sales Footprint

            18.1.15.5. Strategy Overview

                18.1.15.5.1. Marketing Strategy

19. Assumptions & Acronyms Used

20. Research Methodology

Don't pay for what you don't need

Customize your report by selecting specific countries or regions and save 30%!

List of Tables

Table 01: Global Market Value (US$ Million) Forecast by Region, 2018 to 2033

Table 02: Global Market Value (US$ Million) Forecast by Service Type, 2018 to 2033

Table 03: Global Market Value (US$ Million) Forecast by Enterprise Size, 2018 to 2033

Table 04: Global Market Value (US$ Million) Forecast by Industry, 2018 to 2033

Table 05: North America Market Value (US$ Million) Forecast by Country, 2018 to 2033

Table 06: North America Market Value (US$ Million) Forecast by Service Type, 2018 to 2033

Table 07: North America Market Value (US$ Million) Forecast by Enterprise Size, 2018 to 2033

Table 08: North America Market Value (US$ Million) Forecast by Industry, 2018 to 2033

Table 09: Latin America Market Value (US$ Million) Forecast by Country, 2018 to 2033

Table 10: Latin America Market Value (US$ Million) Forecast by Service Type, 2018 to 2033

Table 11: Latin America Market Value (US$ Million) Forecast by Enterprise Size, 2018 to 2033

Table 12: Latin America Market Value (US$ Million) Forecast by Industry, 2018 to 2033

Table 13: Western Europe Market Value (US$ Million) Forecast by Country, 2018 to 2033

Table 14: Western Europe Market Value (US$ Million) Forecast by Service Type, 2018 to 2033

Table 15: Western Europe Market Value (US$ Million) Forecast by Enterprise Size, 2018 to 2033

Table 16: Western Europe Market Value (US$ Million) Forecast by Industry, 2018 to 2033

Table 17: Eastern Europe Market Value (US$ Million) Forecast by Country, 2018 to 2033

Table 18: Eastern Europe Market Value (US$ Million) Forecast by Service Type, 2018 to 2033

Table 19: Eastern Europe Market Value (US$ Million) Forecast by Enterprise Size, 2018 to 2033

Table 20: Eastern Europe Market Value (US$ Million) Forecast by Industry, 2018 to 2033

Table 21: South Asia and Pacific Market Value (US$ Million) Forecast by Country, 2018 to 2033

Table 22: South Asia and Pacific Market Value (US$ Million) Forecast by Service Type, 2018 to 2033

Table 23: South Asia and Pacific Market Value (US$ Million) Forecast by Enterprise Size, 2018 to 2033

Table 24: South Asia and Pacific Market Value (US$ Million) Forecast by Industry, 2018 to 2033

Table 25: East Asia Market Value (US$ Million) Forecast by Country, 2018 to 2033

Table 26: East Asia Market Value (US$ Million) Forecast by Service Type, 2018 to 2033

Table 27: East Asia Market Value (US$ Million) Forecast by Enterprise Size, 2018 to 2033

Table 28: East Asia Market Value (US$ Million) Forecast by Industry, 2018 to 2033

Table 29: Middle East and Africa Market Value (US$ Million) Forecast by Country, 2018 to 2033

Table 30: Middle East and Africa Market Value (US$ Million) Forecast by Service Type, 2018 to 2033

Table 31: Middle East and Africa Market Value (US$ Million) Forecast by Enterprise Size, 2018 to 2033

Table 32: Middle East and Africa Market Value (US$ Million) Forecast by Industry, 2018 to 2033
Sudip Saha
Sudip Saha

Principal Consultant

Talk to Analyst

Find your sweet spots for generating winning opportunities in this market.

List of Charts

Figure 01: Global Market Value (US$ Million) by Service Type, 2023 to 2033

Figure 02: Global Market Value (US$ Million) by Enterprise Size, 2023 to 2033

Figure 03: Global Market Value (US$ Million) by Industry, 2023 to 2033

Figure 04: Global Market Value (US$ Million) by Region, 2023 to 2033

Figure 05: Global Market Value (US$ Million) Analysis by Region, 2018 to 2033

Figure 06: Global Market Value Share (%) and BPS Analysis by Region, 2023 to 2033

Figure 07: Global Market Y-o-Y Growth (%) Projections by Region, 2023 to 2033

Figure 08: Global Market Value (US$ Million) Analysis by Service Type, 2018 to 2033

Figure 09: Global Market Value Share (%) and BPS Analysis by Service Type, 2023 to 2033

Figure 10: Global Market Y-o-Y Growth (%) Projections by Service Type, 2023 to 2033

Figure 11: Global Market Value (US$ Million) Analysis by Enterprise Size, 2018 to 2033

Figure 12: Global Market Value Share (%) and BPS Analysis by Enterprise Size, 2023 to 2033

Figure 13: Global Market Y-o-Y Growth (%) Projections by Enterprise Size, 2023 to 2033

Figure 14: Global Market Value (US$ Million) Analysis by Industry, 2018 to 2033

Figure 15: Global Market Value Share (%) and BPS Analysis by Industry, 2023 to 2033

Figure 16: Global Market Y-o-Y Growth (%) Projections by Industry, 2023 to 2033

Figure 17: Global Market Attractiveness by Service Type, 2023 to 2033

Figure 18: Global Market Attractiveness by Enterprise Size, 2023 to 2033

Figure 19: Global Market Attractiveness by Industry, 2023 to 2033

Figure 20: Global Market Attractiveness by Region, 2023 to 2033

Figure 21: North America Market Value (US$ Million) by Service Type, 2023 to 2033

Figure 22: North America Market Value (US$ Million) by Enterprise Size, 2023 to 2033

Figure 23: North America Market Value (US$ Million) by Industry, 2023 to 2033

Figure 24: North America Market Value (US$ Million) by Country, 2023 to 2033

Figure 25: North America Market Value (US$ Million) Analysis by Country, 2018 to 2033

Figure 26: North America Market Value Share (%) and BPS Analysis by Country, 2023 to 2033

Figure 27: North America Market Y-o-Y Growth (%) Projections by Country, 2023 to 2033

Figure 28: North America Market Value (US$ Million) Analysis by Service Type, 2018 to 2033

Figure 29: North America Market Value Share (%) and BPS Analysis by Service Type, 2023 to 2033

Figure 30: North America Market Y-o-Y Growth (%) Projections by Service Type, 2023 to 2033

Figure 31: North America Market Value (US$ Million) Analysis by Enterprise Size, 2018 to 2033

Figure 32: North America Market Value Share (%) and BPS Analysis by Enterprise Size, 2023 to 2033

Figure 33: North America Market Y-o-Y Growth (%) Projections by Enterprise Size, 2023 to 2033

Figure 34: North America Market Value (US$ Million) Analysis by Industry, 2018 to 2033

Figure 35: North America Market Value Share (%) and BPS Analysis by Industry, 2023 to 2033

Figure 36: North America Market Y-o-Y Growth (%) Projections by Industry, 2023 to 2033

Figure 37: North America Market Attractiveness by Service Type, 2023 to 2033

Figure 38: North America Market Attractiveness by Enterprise Size, 2023 to 2033

Figure 39: North America Market Attractiveness by Industry, 2023 to 2033

Figure 40: North America Market Attractiveness by Country, 2023 to 2033

Figure 41: Latin America Market Value (US$ Million) by Service Type, 2023 to 2033

Figure 42: Latin America Market Value (US$ Million) by Enterprise Size, 2023 to 2033

Figure 43: Latin America Market Value (US$ Million) by Industry, 2023 to 2033

Figure 44: Latin America Market Value (US$ Million) by Country, 2023 to 2033

Figure 45: Latin America Market Value (US$ Million) Analysis by Country, 2018 to 2033

Figure 46: Latin America Market Value Share (%) and BPS Analysis by Country, 2023 to 2033

Figure 47: Latin America Market Y-o-Y Growth (%) Projections by Country, 2023 to 2033

Figure 48: Latin America Market Value (US$ Million) Analysis by Service Type, 2018 to 2033

Figure 49: Latin America Market Value Share (%) and BPS Analysis by Service Type, 2023 to 2033

Figure 50: Latin America Market Y-o-Y Growth (%) Projections by Service Type, 2023 to 2033

Figure 51: Latin America Market Value (US$ Million) Analysis by Enterprise Size, 2018 to 2033

Figure 52: Latin America Market Value Share (%) and BPS Analysis by Enterprise Size, 2023 to 2033

Figure 53: Latin America Market Y-o-Y Growth (%) Projections by Enterprise Size, 2023 to 2033

Figure 54: Latin America Market Value (US$ Million) Analysis by Industry, 2018 to 2033

Figure 55: Latin America Market Value Share (%) and BPS Analysis by Industry, 2023 to 2033

Figure 56: Latin America Market Y-o-Y Growth (%) Projections by Industry, 2023 to 2033

Figure 57: Latin America Market Attractiveness by Service Type, 2023 to 2033

Figure 58: Latin America Market Attractiveness by Enterprise Size, 2023 to 2033

Figure 59: Latin America Market Attractiveness by Industry, 2023 to 2033

Figure 60: Latin America Market Attractiveness by Country, 2023 to 2033

Figure 61: Western Europe Market Value (US$ Million) by Service Type, 2023 to 2033

Figure 62: Western Europe Market Value (US$ Million) by Enterprise Size, 2023 to 2033

Figure 63: Western Europe Market Value (US$ Million) by Industry, 2023 to 2033

Figure 64: Western Europe Market Value (US$ Million) by Country, 2023 to 2033

Figure 65: Western Europe Market Value (US$ Million) Analysis by Country, 2018 to 2033

Figure 66: Western Europe Market Value Share (%) and BPS Analysis by Country, 2023 to 2033

Figure 67: Western Europe Market Y-o-Y Growth (%) Projections by Country, 2023 to 2033

Figure 68: Western Europe Market Value (US$ Million) Analysis by Service Type, 2018 to 2033

Figure 69: Western Europe Market Value Share (%) and BPS Analysis by Service Type, 2023 to 2033

Figure 70: Western Europe Market Y-o-Y Growth (%) Projections by Service Type, 2023 to 2033

Figure 71: Western Europe Market Value (US$ Million) Analysis by Enterprise Size, 2018 to 2033

Figure 72: Western Europe Market Value Share (%) and BPS Analysis by Enterprise Size, 2023 to 2033

Figure 73: Western Europe Market Y-o-Y Growth (%) Projections by Enterprise Size, 2023 to 2033

Figure 74: Western Europe Market Value (US$ Million) Analysis by Industry, 2018 to 2033

Figure 75: Western Europe Market Value Share (%) and BPS Analysis by Industry, 2023 to 2033

Figure 76: Western Europe Market Y-o-Y Growth (%) Projections by Industry, 2023 to 2033

Figure 77: Western Europe Market Attractiveness by Service Type, 2023 to 2033

Figure 78: Western Europe Market Attractiveness by Enterprise Size, 2023 to 2033

Figure 79: Western Europe Market Attractiveness by Industry, 2023 to 2033

Figure 80: Western Europe Market Attractiveness by Country, 2023 to 2033

Figure 81: Eastern Europe Market Value (US$ Million) by Service Type, 2023 to 2033

Figure 82: Eastern Europe Market Value (US$ Million) by Enterprise Size, 2023 to 2033

Figure 83: Eastern Europe Market Value (US$ Million) by Industry, 2023 to 2033

Figure 84: Eastern Europe Market Value (US$ Million) by Country, 2023 to 2033

Figure 85: Eastern Europe Market Value (US$ Million) Analysis by Country, 2018 to 2033

Figure 86: Eastern Europe Market Value Share (%) and BPS Analysis by Country, 2023 to 2033

Figure 87: Eastern Europe Market Y-o-Y Growth (%) Projections by Country, 2023 to 2033

Figure 88: Eastern Europe Market Value (US$ Million) Analysis by Service Type, 2018 to 2033

Figure 89: Eastern Europe Market Value Share (%) and BPS Analysis by Service Type, 2023 to 2033

Figure 90: Eastern Europe Market Y-o-Y Growth (%) Projections by Service Type, 2023 to 2033

Figure 91: Eastern Europe Market Value (US$ Million) Analysis by Enterprise Size, 2018 to 2033

Figure 92: Eastern Europe Market Value Share (%) and BPS Analysis by Enterprise Size, 2023 to 2033

Figure 93: Eastern Europe Market Y-o-Y Growth (%) Projections by Enterprise Size, 2023 to 2033

Figure 94: Eastern Europe Market Value (US$ Million) Analysis by Industry, 2018 to 2033

Figure 95: Eastern Europe Market Value Share (%) and BPS Analysis by Industry, 2023 to 2033

Figure 96: Eastern Europe Market Y-o-Y Growth (%) Projections by Industry, 2023 to 2033

Figure 97: Eastern Europe Market Attractiveness by Service Type, 2023 to 2033

Figure 98: Eastern Europe Market Attractiveness by Enterprise Size, 2023 to 2033

Figure 99: Eastern Europe Market Attractiveness by Industry, 2023 to 2033

Figure 100: Eastern Europe Market Attractiveness by Country, 2023 to 2033

Figure 101: South Asia and Pacific Market Value (US$ Million) by Service Type, 2023 to 2033

Figure 102: South Asia and Pacific Market Value (US$ Million) by Enterprise Size, 2023 to 2033

Figure 103: South Asia and Pacific Market Value (US$ Million) by Industry, 2023 to 2033

Figure 104: South Asia and Pacific Market Value (US$ Million) by Country, 2023 to 2033

Figure 105: South Asia and Pacific Market Value (US$ Million) Analysis by Country, 2018 to 2033

Figure 106: South Asia and Pacific Market Value Share (%) and BPS Analysis by Country, 2023 to 2033

Figure 107: South Asia and Pacific Market Y-o-Y Growth (%) Projections by Country, 2023 to 2033

Figure 108: South Asia and Pacific Market Value (US$ Million) Analysis by Service Type, 2018 to 2033

Figure 109: South Asia and Pacific Market Value Share (%) and BPS Analysis by Service Type, 2023 to 2033

Figure 110: South Asia and Pacific Market Y-o-Y Growth (%) Projections by Service Type, 2023 to 2033

Figure 111: South Asia and Pacific Market Value (US$ Million) Analysis by Enterprise Size, 2018 to 2033

Figure 112: South Asia and Pacific Market Value Share (%) and BPS Analysis by Enterprise Size, 2023 to 2033

Figure 113: South Asia and Pacific Market Y-o-Y Growth (%) Projections by Enterprise Size, 2023 to 2033

Figure 114: South Asia and Pacific Market Value (US$ Million) Analysis by Industry, 2018 to 2033

Figure 115: South Asia and Pacific Market Value Share (%) and BPS Analysis by Industry, 2023 to 2033

Figure 116: South Asia and Pacific Market Y-o-Y Growth (%) Projections by Industry, 2023 to 2033

Figure 117: South Asia and Pacific Market Attractiveness by Service Type, 2023 to 2033

Figure 118: South Asia and Pacific Market Attractiveness by Enterprise Size, 2023 to 2033

Figure 119: South Asia and Pacific Market Attractiveness by Industry, 2023 to 2033

Figure 120: South Asia and Pacific Market Attractiveness by Country, 2023 to 2033

Figure 121: East Asia Market Value (US$ Million) by Service Type, 2023 to 2033

Figure 122: East Asia Market Value (US$ Million) by Enterprise Size, 2023 to 2033

Figure 123: East Asia Market Value (US$ Million) by Industry, 2023 to 2033

Figure 124: East Asia Market Value (US$ Million) by Country, 2023 to 2033

Figure 125: East Asia Market Value (US$ Million) Analysis by Country, 2018 to 2033

Figure 126: East Asia Market Value Share (%) and BPS Analysis by Country, 2023 to 2033

Figure 127: East Asia Market Y-o-Y Growth (%) Projections by Country, 2023 to 2033

Figure 128: East Asia Market Value (US$ Million) Analysis by Service Type, 2018 to 2033

Figure 129: East Asia Market Value Share (%) and BPS Analysis by Service Type, 2023 to 2033

Figure 130: East Asia Market Y-o-Y Growth (%) Projections by Service Type, 2023 to 2033

Figure 131: East Asia Market Value (US$ Million) Analysis by Enterprise Size, 2018 to 2033

Figure 132: East Asia Market Value Share (%) and BPS Analysis by Enterprise Size, 2023 to 2033

Figure 133: East Asia Market Y-o-Y Growth (%) Projections by Enterprise Size, 2023 to 2033

Figure 134: East Asia Market Value (US$ Million) Analysis by Industry, 2018 to 2033

Figure 135: East Asia Market Value Share (%) and BPS Analysis by Industry, 2023 to 2033

Figure 136: East Asia Market Y-o-Y Growth (%) Projections by Industry, 2023 to 2033

Figure 137: East Asia Market Attractiveness by Service Type, 2023 to 2033

Figure 138: East Asia Market Attractiveness by Enterprise Size, 2023 to 2033

Figure 139: East Asia Market Attractiveness by Industry, 2023 to 2033

Figure 140: East Asia Market Attractiveness by Country, 2023 to 2033

Figure 141: Middle East and Africa Market Value (US$ Million) by Service Type, 2023 to 2033

Figure 142: Middle East and Africa Market Value (US$ Million) by Enterprise Size, 2023 to 2033

Figure 143: Middle East and Africa Market Value (US$ Million) by Industry, 2023 to 2033

Figure 144: Middle East and Africa Market Value (US$ Million) by Country, 2023 to 2033

Figure 145: Middle East and Africa Market Value (US$ Million) Analysis by Country, 2018 to 2033

Figure 146: Middle East and Africa Market Value Share (%) and BPS Analysis by Country, 2023 to 2033

Figure 147: Middle East and Africa Market Y-o-Y Growth (%) Projections by Country, 2023 to 2033

Figure 148: Middle East and Africa Market Value (US$ Million) Analysis by Service Type, 2018 to 2033

Figure 149: Middle East and Africa Market Value Share (%) and BPS Analysis by Service Type, 2023 to 2033

Figure 150: Middle East and Africa Market Y-o-Y Growth (%) Projections by Service Type, 2023 to 2033

Figure 151: Middle East and Africa Market Value (US$ Million) Analysis by Enterprise Size, 2018 to 2033

Figure 152: Middle East and Africa Market Value Share (%) and BPS Analysis by Enterprise Size, 2023 to 2033

Figure 153: Middle East and Africa Market Y-o-Y Growth (%) Projections by Enterprise Size, 2023 to 2033

Figure 154: Middle East and Africa Market Value (US$ Million) Analysis by Industry, 2018 to 2033

Figure 155: Middle East and Africa Market Value Share (%) and BPS Analysis by Industry, 2023 to 2033

Figure 156: Middle East and Africa Market Y-o-Y Growth (%) Projections by Industry, 2023 to 2033

Figure 157: Middle East and Africa Market Attractiveness by Service Type, 2023 to 2033

Figure 158: Middle East and Africa Market Attractiveness by Enterprise Size, 2023 to 2033

Figure 159: Middle East and Africa Market Attractiveness by Industry, 2023 to 2033

Figure 160: Middle East and Africa Market Attractiveness by Country, 2023 to 2033

Recommendations

Technology

CDN Security Market

Published : October 2023

Technology

Hardware Security Module Market

Published : June 2023

Explore Technology Insights

View Reports