Hypercharger Market Size, Share, and Forecast Outlook 2025 to 2035

In 2025, the hypercharger market is valued at USD 5.6 billion and is expected to reach USD 33.2 billion by 2035, representing a compound annual growth rate of 19.5%.
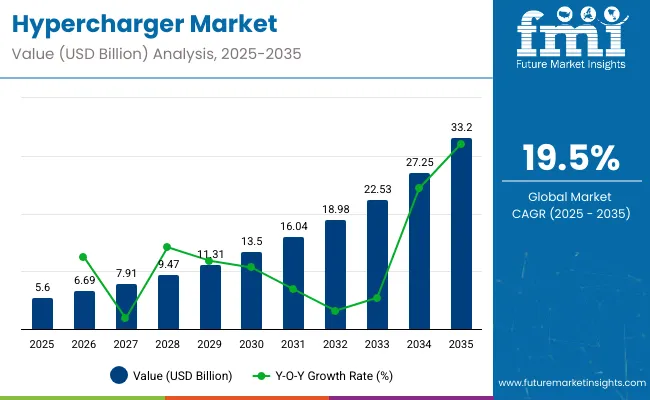
Quick Stats of Hypercharger Market

  • Hypercharger Market Size (2025): USD 5.6 billion
  • Projected Hypercharger Market Size (2035): USD 33.2 billion
  • Forecast CAGR of Hypercharger Market (2025–2035): 19.5%
  • Leading Segment of Hypercharger Market (2025): Passenger Cars (60%)
  • Dominant Charging Speed Segment (2025): 150-350 kW Chargers (45%)
  • Top Connector Type (2025): CCS Connector (65%)
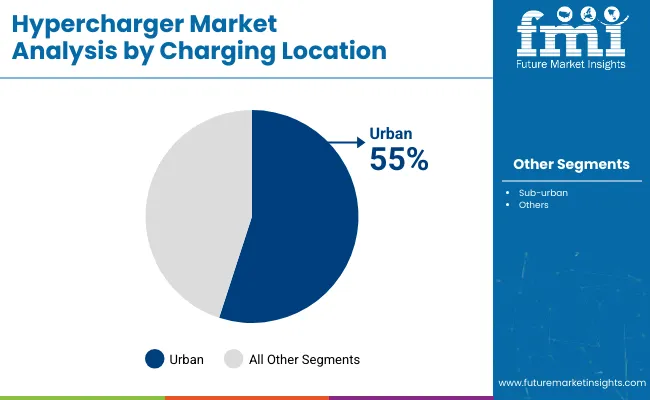
  • Leading Location for Installations (2025): Urban Areas (55%)
  • Key Growth Regions of Hypercharger Market: India, China, Germany, United States, United Kingdom
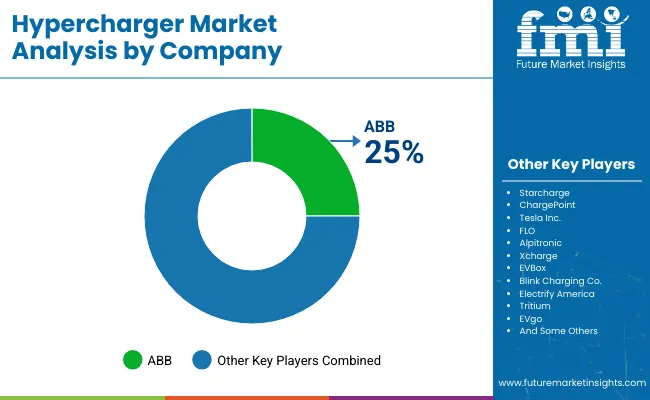
  • Top Key Players of Hypercharger Market: ABB 25% Industry share , Starcharge, ChargePoint, Tesla Inc., FLO, Alpitronic, Xcharge, EVBox, Blink Charging Co., Electrify America, Tritium, EVgo

Hypercharger Market

Metric Value
Industry Size (2025E) USD 5.6 billion
Industry Value (2035F) USD 33.2 billion
CAGR (2025 to 2035) 19.5%

This growth translates to an increase by a factor of approximately 5.93 over the decade. The expansion is driven by the growing adoption of electric vehicles alongside the demand for fast and dependable charging infrastructure worldwide. Peak-to-trough analysis reveals typical market fluctuations driven by investment cycles, regulatory support, and technological advancements. Peak phases often align with periods of accelerated infrastructure deployment, supported by government incentives and rising EV sales.

Troughs occur due to temporary supply chain issues, infrastructure bottlenecks, or shifts in funding priorities, which can slow market expansion temporarily. Despite these cyclical variations, the overall upward trend remains strong, with each growth peak higher than the previous one and trough durations becoming shorter as the market matures.

The multiplying factor of nearly six times within a decade highlights the significant revenue potential and resilience of the hypercharger market. Continued technological innovation and regulatory backing are expected to further minimize trough impacts, supporting sustained growth and expanding opportunities for manufacturers, network operators, and service providers through 2035.

The hypercharger market represents a key segment of the electric vehicle charging infrastructure industry. It holds an estimated 5-7% share of the global EV charging infrastructure market. Within the broader electric vehicle market, hyperchargers account for about 1-2%.

Their presence is notably stronger in regions with high electric vehicle adoption, including parts of Europe and North America, where their share can exceed 10%. These figures highlight the increasing importance of ultra-fast charging solutions, which play a critical role in supporting the growth and convenience of electric vehicle usage worldwide.

The industry is advancing rapidly, fueled by the rise in electric vehicle adoption and the need for faster charging solutions. Key players are focusing on expanding ultra-fast charging networks capable of supporting both passenger and commercial vehicles. Integration of renewable energy with charging stations is becoming a priority, reducing environmental impact.

Strategic collaborations aim to accelerate infrastructure deployment and improve customer access. Technological innovations include higher power output chargers and smart charging systems to optimize energy use. These developments are essential to accommodate the growing electric vehicle ecosystem and enhance user convenience and sustainability.

Top Hypercharger Market Dynamics

The market is expanding alongside the increasing global adoption of electric vehicles (EVs). Technological progress in ultra-fast charging systems enables charging speeds up to 350 kW, reducing vehicle charge time by more than 50% compared to conventional chargers. Investments in EV infrastructure have surpassed USD 15 billion globally in recent years, supporting hypercharger deployment in urban and highway locations.

Government incentives and stricter emission regulations in regions like Europe, China, and North America accelerate the shift to EVs, driving demand for efficient charging solutions. Despite infrastructure challenges, hyperchargers offer operational advantages, including better grid management and enhanced user convenience, contributing to market growth.

Growing EV Sales and Government Support Drive Increasing Demand for Hypercharger Installations

The rise in electric vehicle sales, with global EV stock growing over 40% annually, directly influences the hypercharger market demand. Several governments have set ambitious EV adoption targets supported by subsidies and grants, fueling infrastructure investments. Expansion of public and private charging networks addresses range anxiety among consumers, which remains a key barrier to EV adoption.

The ability of hyperchargers to deliver rapid charging in under 20 minutes attracts fleet operators and individual users alike. The trend of integrating renewable energy sources into charging stations further enhances market appeal, aligning with clean energy goals and boosting demand for hyperchargers.

High Infrastructure Costs and Grid Limitations Challenge Hypercharger Market Expansion

The installation cost of hypercharger stations can exceed USD 200,000 per unit, presenting a significant barrier for widespread deployment, particularly in developing regions. Integrating hyperchargers requires substantial upgrades to local power grids, often involving complex permitting processes and coordination with utility providers.

Electrical grid constraints, including limited capacity and instability in some regions, restrict the ability to support multiple high-power chargers simultaneously. High maintenance and operation costs add further financial strain. These challenges slow infrastructure rollouts and require innovative solutions such as energy storage systems and smart grid integration to enable broader hypercharger adoption.

Emerging Opportunities from Renewable Integration and Battery Energy Storage Systems

Growing incorporation of renewable energy, such as solar and wind, with hypercharger stations creates opportunities for sustainable charging solutions. Combining energy storage systems with hyperchargers reduces grid stress during peak demand and enables load balancing, improving overall efficiency.

Advances in smart grid technologies and vehicle-to-grid (V2G) capabilities offer additional growth potential by allowing bidirectional energy flows. Expanding EV fleets in emerging economies present untapped markets for hypercharger installations. Strategic partnerships between utility companies, charging infrastructure providers, and automakers foster innovation and create scalable business models, supporting market expansion.

Technological Innovations, Smart Charging, and Policy Frameworks Shape Future Market Trends

Smart charging systems that optimize energy use based on grid conditions and user demand are becoming standard in hypercharger installations. Integration of AI and IoT enables predictive maintenance, reducing downtime and operational costs. Autonomous vehicle growth increases the need for fully automated charging stations.

Governments continue to update policies to encourage fast charger deployment, including standardized connectors and interoperability requirements. Environmental focus leads manufacturers to develop more efficient chargers with recyclable materials. Collaborative innovation between tech firms and infrastructure providers accelerates advancements, positioning the hypercharger market to meet evolving EV charging needs globally.

Analyzing Hypercharger Market by Key Investment Segments

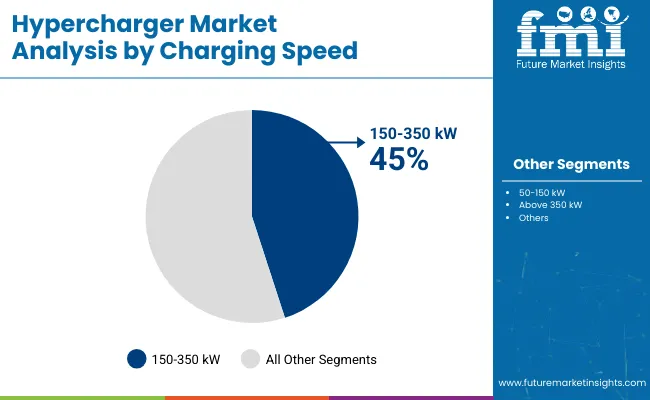
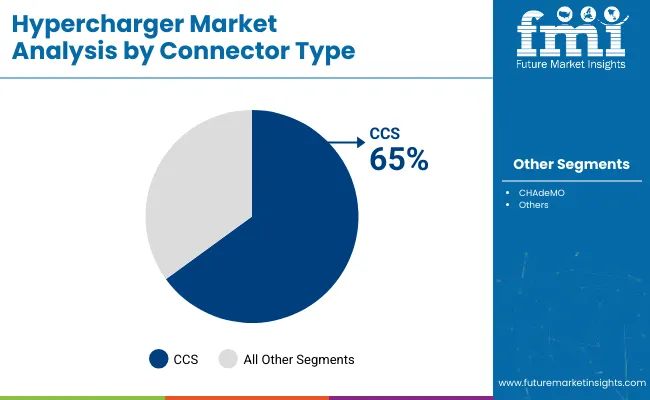
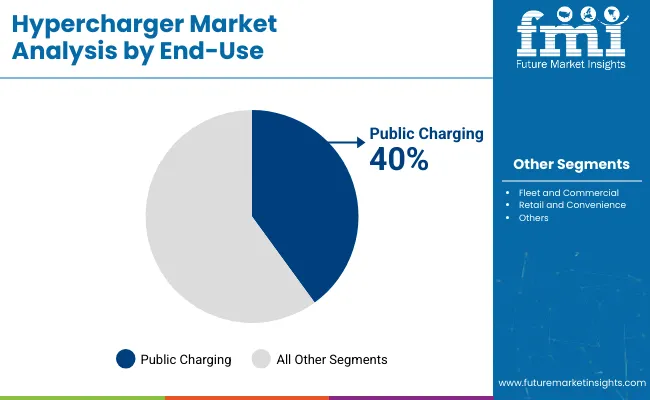
The hypercharger market in 2025 is led by passenger cars, comprising 60% of demand due to expanding electric vehicle ownership. Charging speeds between 150 and 350 kW represent 45% of the market, balancing fast recharging and manageable power draw. CCS connectors hold a 65% share, becoming the dominant standard. Urban charging locations account for 55%, reflecting dense EV populations in cities. Public charging services represent the largest end-use with 40%, driven by infrastructure expansion.
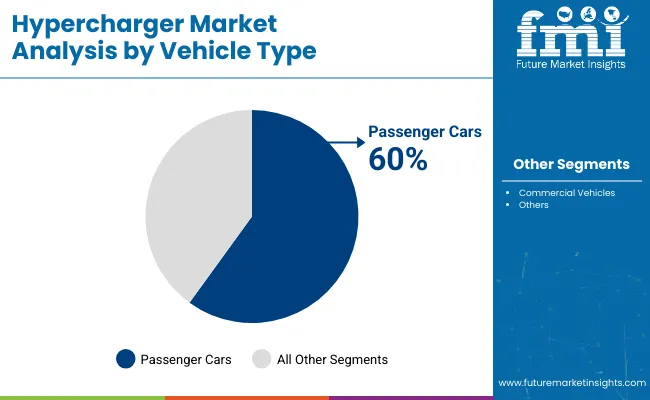
Passenger cars drive demand with 60% share

Hypercharger Market By Vehicle

Passenger vehicles form the largest segment at 60%, fueled by rising consumer interest and a growing electric vehicle model lineup. Chargers in this category aim to deliver an 80% charge within 25-30 minutes, reducing downtime for drivers. Companies such as Tesla and Blink emphasize multi-brand compatibility, increasing accessibility for diverse users.

Advances in thermal regulation technology help lower battery wear by approximately 15%, thereby prolonging vehicle battery life. Incentives and policies supporting personal EV ownership continue to push charger installations in residential and public areas.
  • Enables rapid 80% battery recharge within 25-30 minutes
  • Thermal controls reduce battery degradation by roughly 15%
  • Wide compatibility enhances access for multiple EV brands

150-350 kW charging speed leads with 45% market share

Hypercharger Market By Charging

Chargers operating within the 150-350 kW range capture 45% of the market by providing fast charging while maintaining grid stability. This power bracket supports a broad variety of EVs, cutting charge times by up to 40% compared to slower units. Installation and maintenance costs are lower than ultra-high-speed chargers, enabling wider deployment in urban and suburban areas.

Smart energy management software optimizes peak demand, resulting in approximately 20% lower electricity costs for operators. These chargers also help reduce wait times during peak usage, enhancing overall user satisfaction.
  • Cuts charging session duration by up to 40% versus slower chargers
  • Lower infrastructure expenses facilitate broader rollout
  • Advanced software reduces peak electricity costs by 20%

CCS connector type dominates with 65% share

Hypercharger Market By Connector

The CCS connector holds 65% of the market due to its widespread acceptance and technical advantages. Its compatibility with fast-charging standards makes it the preferred choice for most passenger and commercial EV models. The connector supports power delivery up to 350 kW, accommodating both mid-range and ultra-fast charging requirements.

Its robust design minimizes connection failures by about 15%, decreasing maintenance needs. Infrastructure developers favor CCS to align with evolving global EV standards, ensuring easier scalability and network interoperability.
  • Supports fast charging up to 350 kW for a wide vehicle range
  • Durable design cuts connector failures by around 15%
  • Global acceptance facilitates scalable and interoperable networks

Urban locations lead with 55% market share

Hypercharger Market By Analysis

Urban hypercharger installations account for 55% of the market, reflecting the concentration of electric vehicles in city environments. High population density and frequent EV use in urban areas drive demand for convenient and accessible charging points. Chargers in urban settings often incorporate advanced queue management systems that reduce wait times by up to 25%.

Urban deployments also focus on integrating with renewable energy sources, enabling up to 30% of charging energy to come from green electricity, lowering carbon footprints. Location density improves charging availability, increasing customer satisfaction and repeat usage.
  • Advanced queue systems reduce wait times by approximately 25%
  • Up to 30% of energy supplied from renewables lowers emissions
  • High charger density enhances accessibility and customer retention

Public charging dominates end-use with 40% share

Hypercharger Market By Enduse

Public charging stations make up 40% of the hypercharger market, driven by expanding networks aimed at general EV users. These stations often feature multiple connectors and flexible payment systems, supporting diverse user preferences and increasing adoption. Integration with mobile apps provides real-time availability, reducing search times by nearly 20%.

Public chargers serve as essential infrastructure for long-distance travel, with many offering amenities like restrooms and retail access, improving the overall customer experience. Operators continuously invest in upgrading software for seamless interoperability across different charging networks.

  • Multi-connector setups accommodate diverse user needs
  • Real-time availability tracking cuts charger search time by 20%
  • Station amenities improve driver comfort during charging stops

Commercial vehicles hold 40% vehicle type share

Commercial vehicles represent 40% of the hypercharger market, growing due to increasing electrification in logistics and public transport fleets. These chargers often support higher power outputs, enabling fast turnaround times essential for fleet operations. Companies focus on durability and uptime, achieving over 95% availability rates to meet operational demands.

Fleet chargers also integrate with fleet management software for route planning and energy optimization, reducing charging-related delays by approximately 18%. Investment in heavy-duty thermal management ensures battery longevity under frequent fast charging cycles.

  • Supports rapid recharge critical for fleet operational efficiency
  • Maintains over 95% charger availability for uninterrupted use
  • Software integration cuts charging delays by about 18%

Sub-urban charging locations cover 45% of market

Sub-urban hypercharging accounts for 45% of installations, catering to EV users commuting between urban centers and outlying areas. Chargers in these zones balance power output and cost-efficiency, with many stations offering mid-range speeds around 150 kW. Sub-urban sites often leverage local grid capacity, reducing infrastructure strain and improving reliability.

These locations focus on ease of access, often situated near shopping centers or highways, increasing convenience. Demand is supported by expanding residential EV ownership and commercial fleets operating beyond city limits.

  • Mid-range chargers balance cost and power demand effectively
  • Strategic placement near highways and retail boosts user convenience
  • Leverages grid capacity to maintain stable, reliable service

Fleet and commercial end-use capture 35% of the market

Fleet and commercial operations represent 35% of hypercharger utilization, driven by electrification of buses, trucks, and delivery vehicles. Chargers serving fleets prioritize high uptime and fast turnaround, with average charge sessions under 45 minutes. Integration with fleet software allows real-time monitoring, optimizing charging schedules and energy costs.

Charging infrastructure for commercial vehicles often includes heavy-duty connectors supporting higher currents, reducing battery recharge times by 25%. Growing regulatory mandates for cleaner transport propel investment in this segment.

  • Average charging session times under 45 minutes improve fleet efficiency
  • Heavy-duty connectors support higher currents for faster recharges
  • Real-time monitoring optimizes scheduling and reduces energy expenses

Retail and convenience locations hold 25% share

Retail and convenience locations comprise 25% of the market, providing charging services where consumers shop or take breaks. These sites focus on customer experience by offering chargers integrated with loyalty programs and contactless payments. Charging speed typically ranges between 150-350 kW, balancing user wait times with infrastructure costs.

Retail chargers also often feature energy storage systems to manage peak loads, reducing grid impact by approximately 15%. Such locations encourage EV adoption by enhancing convenience and combining charging with everyday errands.
  • Loyalty program integration improves customer engagement
  • Energy storage systems reduce grid demand spikes by 15%
  • Combines charging with shopping to maximize user convenience

Top Countries Driving Hypercharger Market Growth

Hypercharger Market By Country

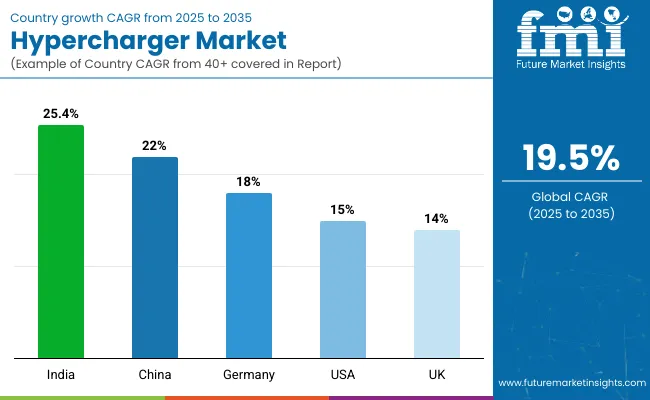
The global hypercharger market is forecasted to expand at a CAGR of 19.5% between 2025 and 2035. India leads with a CAGR of 25.4%, exceeding the global average by 30%. China follows at 22.0%, maintaining a 13% premium over the global rate. Germany registers 18.0%, slightly below the global benchmark by 8%. The United States and United Kingdom record growth rates of 15.0% and 14.0%, respectively, trailing the global CAGR by 23% and 28%.

Growth in India and China is driven by rapid electric vehicle adoption and government policies promoting charging infrastructure. Germany and other OECD members focus on enhancing existing networks and incorporating advanced technology. ASEAN regions, while not leading, are expected to gradually increase market participation through regional electrification initiatives. Distinct growth patterns highlight the evolving hypercharger market across BRICS, OECD, and ASEAN economies, reflecting differences in infrastructure development, regulatory support, and market maturity.

Rapid Expansion of Hypercharger Market in India

The hypercharger market in India is expected to grow at a CAGR of 25.4%, driven by a fast-growing electric vehicle fleet and supportive government policies. The development of fast-charging infrastructure along highways and in metropolitan areas aims to reduce charging times and alleviate range anxiety. Private investments and collaborations between energy firms and EV manufacturers accelerate network expansion.

Integration of renewable energy sources such as solar power in hypercharger stations helps reduce operational costs and carbon impact. Growing consumer awareness and incentives for EV adoption further encourage infrastructure build-out. The focus on making chargers affordable and accessible in tier 2 and tier 3 cities is gaining momentum.

  • Fast-charging stations on national highways increased by 45% in two years.
  • Solar-powered hyperchargers rose by 20% among new installations.
  • Public-private partnerships account for 40% of current hypercharger projects.

Demand Forecast for Hypercharger Market in China

The hypercharger market in China is projected to grow at a CAGR of 22.0%, driven by the country’s position as the largest EV market globally. Extensive government support enables rapid deployment of fast-charging stations, especially in urban areas and along major transport corridors. State-owned enterprises and private companies invest heavily in high-capacity chargers to accommodate increasing EV traffic.

Improvements in battery technology allow higher charging speeds, reducing wait times significantly. Integration with smart grid systems optimizes power consumption, balancing demand and supply. Additionally, subsidies and incentives reduce installation and operational costs, encouraging rapid network expansion.

  • Battery charging speeds improved by 25% with latest hypercharger models.
  • Smart grid integration lowered peak load at stations by 15%.
  • Installation costs decreased by 30% due to government subsidies over three years.

Growth Outlook for Hypercharger Market in Germany

The Demand of hypercharger in Germany is forecast to expand at a CAGR of 18.0%, supported by ambitious EV adoption goals and environmental policies. Deployment of ultra-fast chargers in urban centres and along autobahns facilitates longer EV trips and daily commuting. The market sees strong collaboration between energy companies and automakers to enhance technology and coverage.

Integration of renewable energy sources and battery storage systems stabilizes grid load and improves sustainability. Digital features such as app-based reservation systems enhance user convenience and charger availability. The focus on clean energy ensures the charging infrastructure aligns with national emission reduction targets.

  • Ultra-fast chargers constitute 50% of newly installed hyperchargers.
  • Renewable energy uses at stations increased by 25%.
  • App reservation systems improved charger utilization by 18%.

Growth Analysis of Hypercharger Market in the United States

The United States hypercharger market is anticipated to grow at a CAGR of 15.0%, backed by federal and state incentives promoting EV adoption and infrastructure development. Priority focuses include expanding fast-charging networks along intercity corridors and urban hubs to reduce range anxiety. Significant investments in grid modernization enable higher power delivery and enhance reliability.

Collaboration between major automakers, utilities, and private providers accelerates deployment. Interoperability standards ensure chargers work seamlessly across different EV brands, improving user experience. Consumer demand for convenient, fast charging is pushing network density higher, supporting wider EV adoption.

  • Intercity corridor chargers grew by 35% in two years.
  • Grid upgrades improved power delivery reliability by 20%.
  • 85% of chargers now support multi-network interoperability standards.

Future Outlook for Hypercharger Market in the United Kingdom

The United Kingdom’s hypercharger market is forecast to grow at a CAGR of 14.0%, driven by government policies promoting zero-emission vehicles and expanding charging infrastructure. Focus is on installing ultra-fast chargers along motorways and in urban centers to support commuter and long-distance EV use.

Investments in battery storage at charging hubs enhance grid stability and allow for renewable energy integration. Increasing customer expectations have led to widespread adoption of contactless payments and mobile app-based access. Market growth is supported by collaboration among government agencies, energy providers, and private investors to meet national climate goals.
  • Motorway fast-charging hubs increased by 30% in three years.
  • Battery storage integration at stations rose by 22%.
  • Contactless payments adopted by 75% of hypercharger locations.

Leading Hypercharger Manufacturers, Suppliers, Distributor

Hypercharger Market By Company

Leading hypercharger manufacturers, suppliers, and distributors adopt distinct strategies to expand their market presence and address evolving charging needs. ABB introduces high-power chargers designed for reliability and seamless integration, while Starcharge emphasizes modular, scalable solutions for commercial and public applications.

ChargePoint expands its network through strategic partnerships and launches faster chargers to reduce charging times. Tesla Inc. operates an extensive Supercharger network, increasing station numbers and enhancing charger performance for its vehicle lineup. FLO improves customer experience and broadens coverage across North America. Alpitronic targets highway corridors with ultra-high-power chargers that minimize charging duration.

Xcharge grows internationally by collaborating with local operators and adapting chargers to regional power grids. EVBox offers versatile charging units suitable for residential, commercial, and fleet users. Blink Charging Co. strengthens user engagement through app-based controls and subscription models. Electrify America rapidly deploys high-capacity chargers in key locations.

Tritium focuses on compact, fast chargers optimized for easy installation and maintenance. EVgo emphasizes network expansion and loyalty programs to build its customer base. Emerging companies leverage flexible models and cost-effective technology to enter competitive markets. These approaches reflect how industry players position themselves to meet varying demands and enhance charging infrastructure.

Recent Industry News

  • In May 2025, Tritium launched TRI-FLEX. TRI-FLEX is an advanced EV charging platform that delivers a charging speed ranging from 100 kW to 400 kW.
  • In April 2025, Huawei launched a new supercharger for EVs. This supercharger is capable of charging any heavy truck to around 90% by 15 minutes.

Leading Players

  • ABB
  • Starcharge
  • ChargePoint
  • Tesla Inc.
  • FLO
  • Alpitronic
  • Xcharge
  • EVBox
  • Blink Charging Co.
  • Electrify America
  • Tritium
  • EVgo
  • and some others

Report scope

Report Attributes Details
Market Size (2025) USD 5.6 billion
Projected Market Size (2035) USD 33.2 billion
CAGR (2025 to 2035) 19.5%
Base Year for Estimation 2024
Historical Period 2020 to 2024
Projections Period 2025 to 2035
Quantitative Units USD billion for value
Vehicle Types Analyzed (Segment 1) Passenger Cars, Commercial Vehicles
Charging Speeds Analyzed (Segment 2) 50-150 kW, 150-350 kW, Above 350 kW
Connector Types Analyzed (Segment 3) CCS, CHAdeMO, Others
Charging Locations Analyzed (Segment 4) Urban, Sub-urban
End-Use Segments Analyzed (Segment 5) Retail and Convenience, Public Charging, Fleet and Commercial
Regions Covered North America, Latin America, Western Europe, Eastern Europe, Asia Pacific, Middle East and Africa
Countries Covered United States, Canada, Mexico, Germany, United Kingdom, France, China, Japan, South Korea, India, Brazil, South Africa, UAE
Key Players Influencing the Market ABB, Starcharge, ChargePoint, Tesla Inc., FLO, Alpitronic, Xcharge, EVBox, Blink Charging Co., Electrify America, Tritium, EVgo
Additional Attributes Dollar sales by charger type and vehicle category, demand trends across passenger cars, commercial vehicles, and buses, regional adoption in North America, Europe, and Asia-Pacific, innovation in ultra-fast charging, smart grid integration, and wireless charging, environmental impact of energy sourcing and infrastructure, and emerging uses in fleet electrification and highway charging networks.

Hypercharger Market Analyzed by Key Investment Segments 

By Vehicle Type:

  • Passenger Cars
  • Commercial Vehicles

By Charging Speed:

  • 50-150 kW
  • 150-350 kW
  • Above 350 kW

By Connector Type:

  • CCS
  • CHAdeMO
  • Others

By Charging Location:

  • Urban
  • Sub-urban

By End-Use:

  • Retail and Convenience
  • Public Charging
  • Fleet and Commercial

By Region:

  • North America
  • Latin America
  • Western Europe
  • Eastern Europe
  • Asia Pacific
  • The Middle East and Africa

Table of Content

  1. Executive Summary
    • Global Market Outlook
    • Demand-side Trends
    • Supply-side Trends
    • Technology Roadmap Analysis
    • Analysis and Recommendations
  2. Market Overview
    • Market Coverage / Taxonomy
    • Market Definition / Scope / Limitations
  3. Market Background
    • Market Dynamics
      • Drivers
      • Restraints
      • Opportunity
      • Trends
    • Scenario Forecast
      • Demand in Optimistic Scenario
      • Demand in Likely Scenario
      • Demand in Conservative Scenario
    • Opportunity Map Analysis
    • Product Life Cycle Analysis
    • Supply Chain Analysis
      • Supply Side Participants and their Roles
        • Producers
        • Mid-Level Participants (Traders/ Agents/ Brokers)
        • Wholesalers and Distributors
      • Value Added and Value Created at Node in the Supply Chain
      • List of Raw Material Suppliers
      • List of Existing and Potential Buyer’s
    • Investment Feasibility Matrix
    • Value Chain Analysis
      • Profit Margin Analysis
      • Wholesalers and Distributors
      • Retailers
    • PESTLE and Porter’s Analysis
    • Regulatory Landscape
      • By Key Regions
      • By Key Countries
    • Regional Parent Market Outlook
    • Production and Consumption Statistics
    • Import and Export Statistics
  4. Global Market Analysis 2020 to 2024 and Forecast, 2025 to 2035
    • Historical Market Size Value (USD Billion) & Volume (Units) Analysis, 2020 to 2024
    • Current and Future Market Size Value (USD Billion) & Volume (Units) Projections, 2025 to 2035
      • Y-o-Y Growth Trend Analysis
      • Absolute $ Opportunity Analysis
  5. Global Market Pricing Analysis 2020 to 2024 and Forecast 2025 to 2035
  6. Global Market Analysis 2020 to 2024 and Forecast 2025 to 2035, By Vehicle Type
    • Introduction / Key Findings
    • Historical Market Size Value (USD Billion) & Volume (Units) Analysis By Vehicle Type, 2020 to 2024
    • Current and Future Market Size Value (USD Billion) & Volume (Units) Analysis and Forecast By Vehicle Type, 2025 to 2035
      • Passenger Cars
      • Commercial Vehicles
    • Y-o-Y Growth Trend Analysis By Vehicle Type, 2020 to 2024
    • Absolute $ Opportunity Analysis By Vehicle Type, 2025 to 2035
  7. Global Market Analysis 2020 to 2024 and Forecast 2025 to 2035, By Charging Speed
    • Introduction / Key Findings
    • Historical Market Size Value (USD Billion) & Volume (Units) Analysis By Charging Speed, 2020 to 2024
    • Current and Future Market Size Value (USD Billion) & Volume (Units) Analysis and Forecast By Charging Speed, 2025 to 2035
      • 150-350 kW
      • Above 350 kW
      • 50-150 kW
    • Y-o-Y Growth Trend Analysis By Charging Speed, 2020 to 2024
    • Absolute $ Opportunity Analysis By Charging Speed, 2025 to 2035
  8. Global Market Analysis 2020 to 2024 and Forecast 2025 to 2035, By Connector Type
    • Introduction / Key Findings
    • Historical Market Size Value (USD Billion) & Volume (Units) Analysis By Connector Type, 2020 to 2024
    • Current and Future Market Size Value (USD Billion) & Volume (Units) Analysis and Forecast By Connector Type, 2025 to 2035
      • CCS
      • CHAdeMO
      • Others
    • Y-o-Y Growth Trend Analysis By Connector Type, 2020 to 2024
    • Absolute $ Opportunity Analysis By Connector Type, 2025 to 2035
  9. Global Market Analysis 2020 to 2024 and Forecast 2025 to 2035, By Charging Location
    • Introduction / Key Findings
    • Historical Market Size Value (USD Billion) & Volume (Units) Analysis By Charging Location, 2020 to 2024
    • Current and Future Market Size Value (USD Billion) & Volume (Units) Analysis and Forecast By Charging Location, 2025 to 2035
      • Urban
      • Sub-urban
    • Y-o-Y Growth Trend Analysis By Charging Location, 2020 to 2024
    • Absolute $ Opportunity Analysis By Charging Location, 2025 to 2035
  10. Global Market Analysis 2020 to 2024 and Forecast 2025 to 2035, By End-Use
    • Introduction / Key Findings
    • Historical Market Size Value (USD Billion) & Volume (Units) Analysis By End-Use, 2020 to 2024
    • Current and Future Market Size Value (USD Billion) & Volume (Units) Analysis and Forecast By End-Use, 2025 to 2035
      • Public Charging
      • Fleet and Commercial
      • Retail and Convenience
    • Y-o-Y Growth Trend Analysis By End-Use, 2020 to 2024
    • Absolute $ Opportunity Analysis By End-Use, 2025 to 2035
  11. Global Market Analysis 2020 to 2024 and Forecast 2025 to 2035, By Region
    • Introduction
    • Historical Market Size Value (USD Billion) & Volume (Units) Analysis By Region, 2020 to 2024
    • Current Market Size Value (USD Billion) & Volume (Units) Analysis and Forecast By Region, 2025 to 2035
      • North America
      • Latin America
      • Western Europe
      • Eastern Europe
      • East Asia
      • South Asia & Pacific
      • Middle East and Africa
    • Market Attractiveness Analysis By Region
  12. North America Market Analysis 2020 to 2024 and Forecast 2025 to 2035, By Country
    • Historical Market Size Value (USD Billion) & Volume (Units) Trend Analysis By Market Taxonomy, 2020 to 2024
    • Market Size Value (USD Billion) & Volume (Units) Forecast By Market Taxonomy, 2025 to 2035
      • By Country
        • USA
        • Canada
        • Mexico
      • By Vehicle Type
      • By Charging Speed
      • By Connector Type
      • By Charging Location
      • By End-Use
    • Market Attractiveness Analysis
      • By Country
      • By Vehicle Type
      • By Charging Speed
      • By Connector Type
      • By Charging Location
      • By End-Use
    • Key Takeaways
  13. Latin America Market Analysis 2020 to 2024 and Forecast 2025 to 2035, By Country
    • Historical Market Size Value (USD Billion) & Volume (Units) Trend Analysis By Market Taxonomy, 2020 to 2024
    • Market Size Value (USD Billion) & Volume (Units) Forecast By Market Taxonomy, 2025 to 2035
      • By Country
        • Brazil
        • Argentina
        • Rest of LATAM
      • By Vehicle Type
      • By Charging Speed
      • By Connector Type
      • By Charging Location
      • By End-Use
    • Market Attractiveness Analysis
      • By Country
      • By Vehicle Type
      • By Charging Speed
      • By Connector Type
      • By Charging Location
      • By End-Use
    • Key Takeaways
  14. Western Europe Market Analysis 2020 to 2024 and Forecast 2025 to 2035, By Country
    • Historical Market Size Value (USD Billion) & Volume (Units) Trend Analysis By Market Taxonomy, 2020 to 2024
    • Market Size Value (USD Billion) & Volume (Units) Forecast By Market Taxonomy, 2025 to 2035
      • By Country
        • Germany
        • Italy
        • France
        • UK
        • Spain
        • BENELUX
        • Nordic
        • Rest of W.Europe
      • By Vehicle Type
      • By Charging Speed
      • By Connector Type
      • By Charging Location
      • By End-Use
    • Market Attractiveness Analysis
      • By Country
      • By Vehicle Type
      • By Charging Speed
      • By Connector Type
      • By Charging Location
      • By End-Use
    • Key Takeaways
  15. Eastern Europe Market Analysis 2020 to 2024 and Forecast 2025 to 2035, By Country
    • Historical Market Size Value (USD Billion) & Volume (Units) Trend Analysis By Market Taxonomy, 2020 to 2024
    • Market Size Value (USD Billion) & Volume (Units) Forecast By Market Taxonomy, 2025 to 2035
      • By Country
        • Russia
        • Hungary
        • Poland
        • Balkan & Baltics
        • Rest of E. Europe
      • By Vehicle Type
      • By Charging Speed
      • By Connector Type
      • By Charging Location
      • By End-Use
    • Market Attractiveness Analysis
      • By Country
      • By Vehicle Type
      • By Charging Speed
      • By Connector Type
      • By Charging Location
      • By End-Use
    • Key Takeaways
  16. East Asia Market Analysis 2020 to 2024 and Forecast 2025 to 2035, By Country
    • Historical Market Size Value (USD Billion) & Volume (Units) Trend Analysis By Market Taxonomy, 2020 to 2024
    • Market Size Value (USD Billion) & Volume (Units) Forecast By Market Taxonomy, 2025 to 2035
      • By Country
        • China
        • Japan
        • South Korea
      • By Vehicle Type
      • By Charging Speed
      • By Connector Type
      • By Charging Location
      • By End-Use
    • Market Attractiveness Analysis
      • By Country
      • By Vehicle Type
      • By Charging Speed
      • By Connector Type
      • By Charging Location
      • By End-Use
    • Key Takeaways
  17. South Asia & Pacific Market Analysis 2020 to 2024 and Forecast 2025 to 2035, By Country
    • Historical Market Size Value (USD Billion) & Volume (Units) Trend Analysis By Market Taxonomy, 2020 to 2024
    • Market Size Value (USD Billion) & Volume (Units) Forecast By Market Taxonomy, 2025 to 2035
      • By Country
        • India
        • Australia & New Zealand
        • ASEAN
        • Rest of SAP
      • By Vehicle Type
      • By Charging Speed
      • By Connector Type
      • By Charging Location
      • By End-Use
    • Market Attractiveness Analysis
      • By Country
      • By Vehicle Type
      • By Charging Speed
      • By Connector Type
      • By Charging Location
      • By End-Use
    • Key Takeaways
  18. Middle East and Africa Market Analysis 2020 to 2024 and Forecast 2025 to 2035, By Country
    • Historical Market Size Value (USD Billion) & Volume (Units) Trend Analysis By Market Taxonomy, 2020 to 2024
    • Market Size Value (USD Billion) & Volume (Units) Forecast By Market Taxonomy, 2025 to 2035
      • By Country
        • GCC Countries
        • Northern Africa
        • South Africa
        • Turkiye
        • Rest of MEA
      • By Vehicle Type
      • By Charging Speed
      • By Connector Type
      • By Charging Location
      • By End-Use
    • Market Attractiveness Analysis
      • By Country
      • By Vehicle Type
      • By Charging Speed
      • By Connector Type
      • By Charging Location
      • By End-Use
    • Key Takeaways
  19. Key Countries Market Analysis
    • USA
      • Pricing Analysis
      • Market Share Analysis, 2024
        • By Vehicle Type
        • By Charging Speed
        • By Connector Type
        • By Charging Location
        • By End-Use
    • Canada
      • Pricing Analysis
      • Market Share Analysis, 2024
        • By Vehicle Type
        • By Charging Speed
        • By Connector Type
        • By Charging Location
        • By End-Use
    • Brazil
      • Pricing Analysis
      • Market Share Analysis, 2024
        • By Vehicle Type
        • By Charging Speed
        • By Connector Type
        • By Charging Location
        • By End-Use
    • Mexico
      • Pricing Analysis
      • Market Share Analysis, 2024
        • By Vehicle Type
        • By Charging Speed
        • By Connector Type
        • By Charging Location
        • By End-Use
    • Argentina
      • Pricing Analysis
      • Market Share Analysis, 2024
        • By Vehicle Type
        • By Charging Speed
        • By Connector Type
        • By Charging Location
        • By End-Use
  20. Market Structure Analysis
    • Competition Dashboard
    • Competition Benchmarking
    • Market Share Analysis of Top Players
      • By Regional
      • By Vehicle Type
      • By Charging Speed
      • By Connector Type
      • By Charging Location
      • By End-Use
  21. Competition Analysis
    • Competition Deep Dive
      • Starcharge
        • Overview
        • Product Portfolio
        • Profitability by Market Segments (Product/Age /Sales Channel/Region)
        • Sales Footprint
        • Strategy Overview
          • Marketing Strategy
          • Product Strategy
          • Channel Strategy
      • ChargePoint
        • Overview
        • Product Portfolio
        • Profitability by Market Segments (Product/Age /Sales Channel/Region)
        • Sales Footprint
        • Strategy Overview
          • Marketing Strategy
          • Product Strategy
          • Channel Strategy
      • Tesla Inc.
        • Overview
        • Product Portfolio
        • Profitability by Market Segments (Product/Age /Sales Channel/Region)
        • Sales Footprint
        • Strategy Overview
          • Marketing Strategy
          • Product Strategy
          • Channel Strategy
      • EVBox
        • Overview
        • Product Portfolio
        • Profitability by Market Segments (Product/Age /Sales Channel/Region)
        • Sales Footprint
        • Strategy Overview
          • Marketing Strategy
          • Product Strategy
          • Channel Strategy
      • Electrify America
        • Overview
        • Product Portfolio
        • Profitability by Market Segments (Product/Age /Sales Channel/Region)
        • Sales Footprint
        • Strategy Overview
          • Marketing Strategy
          • Product Strategy
          • Channel Strategy
      • EVo
        • Overview
        • Product Portfolio
        • Profitability by Market Segments (Product/Age /Sales Channel/Region)
        • Sales Footprint
        • Strategy Overview
          • Marketing Strategy
          • Product Strategy
          • Channel Strategy
      • FLO
        • Overview
        • Product Portfolio
        • Profitability by Market Segments (Product/Age /Sales Channel/Region)
        • Sales Footprint
        • Strategy Overview
          • Marketing Strategy
          • Product Strategy
          • Channel Strategy
      • Alpitronic
        • Overview
        • Product Portfolio
        • Profitability by Market Segments (Product/Age /Sales Channel/Region)
        • Sales Footprint
        • Strategy Overview
          • Marketing Strategy
          • Product Strategy
          • Channel Strategy
      • Xcharge
        • Overview
        • Product Portfolio
        • Profitability by Market Segments (Product/Age /Sales Channel/Region)
        • Sales Footprint
        • Strategy Overview
          • Marketing Strategy
          • Product Strategy
          • Channel Strategy
      • Blink Charging Co.
        • Overview
        • Product Portfolio
        • Profitability by Market Segments (Product/Age /Sales Channel/Region)
        • Sales Footprint
        • Strategy Overview
          • Marketing Strategy
          • Product Strategy
          • Channel Strategy
      • Tritium
        • Overview
        • Product Portfolio
        • Profitability by Market Segments (Product/Age /Sales Channel/Region)
        • Sales Footprint
        • Strategy Overview
          • Marketing Strategy
          • Product Strategy
          • Channel Strategy
      • ABB
        • Overview
        • Product Portfolio
        • Profitability by Market Segments (Product/Age /Sales Channel/Region)
        • Sales Footprint
        • Strategy Overview
          • Marketing Strategy
          • Product Strategy
          • Channel Strategy
  22. Assumptions & Acronyms Used
  23. Research Methodology

List of Tables

  • Table 1: Global Market Value (USD Billion) Forecast by Region, 2020-2035
  • Table 2: Global Market Volume (Units) Forecast by Region, 2020-2035
  • Table 3: Global Market Value (USD Billion) Forecast by Vehicle Type, 2020-2035
  • Table 4: Global Market Volume (Units) Forecast by Vehicle Type, 2020-2035
  • Table 5: Global Market Value (USD Billion) Forecast by Charging Speed, 2020-2035
  • Table 6: Global Market Volume (Units) Forecast by Charging Speed, 2020-2035
  • Table 7: Global Market Value (USD Billion) Forecast by Connector Type, 2020-2035
  • Table 8: Global Market Volume (Units) Forecast by Connector Type, 2020-2035
  • Table 9: Global Market Value (USD Billion) Forecast by Charging Location, 2020-2035
  • Table 10: Global Market Volume (Units) Forecast by Charging Location, 2020-2035
  • Table 11: Global Market Value (USD Billion) Forecast by End-Use, 2020-2035
  • Table 12: Global Market Volume (Units) Forecast by End-Use, 2020-2035
  • Table 13: North America Market Value (USD Billion) Forecast by Country, 2020-2035
  • Table 14: North America Market Volume (Units) Forecast by Country, 2020-2035
  • Table 15: North America Market Value (USD Billion) Forecast by Vehicle Type, 2020-2035
  • Table 16: North America Market Volume (Units) Forecast by Vehicle Type, 2020-2035
  • Table 17: North America Market Value (USD Billion) Forecast by Charging Speed, 2020-2035
  • Table 18: North America Market Volume (Units) Forecast by Charging Speed, 2020-2035
  • Table 19: North America Market Value (USD Billion) Forecast by Connector Type, 2020-2035
  • Table 20: North America Market Volume (Units) Forecast by Connector Type, 2020-2035
  • Table 21: North America Market Value (USD Billion) Forecast by Charging Location, 2020-2035
  • Table 22: North America Market Volume (Units) Forecast by Charging Location, 2020-2035
  • Table 23: North America Market Value (USD Billion) Forecast by End-Use, 2020-2035
  • Table 24: North America Market Volume (Units) Forecast by End-Use, 2020-2035
  • Table 25: Latin America Market Value (USD Billion) Forecast by Country, 2020-2035
  • Table 26: Latin America Market Volume (Units) Forecast by Country, 2020-2035
  • Table 27: Latin America Market Value (USD Billion) Forecast by Vehicle Type, 2020-2035
  • Table 28: Latin America Market Volume (Units) Forecast by Vehicle Type, 2020-2035
  • Table 29: Latin America Market Value (USD Billion) Forecast by Charging Speed, 2020-2035
  • Table 30: Latin America Market Volume (Units) Forecast by Charging Speed, 2020-2035
  • Table 31: Latin America Market Value (USD Billion) Forecast by Connector Type, 2020-2035
  • Table 32: Latin America Market Volume (Units) Forecast by Connector Type, 2020-2035
  • Table 33: Latin America Market Value (USD Billion) Forecast by Charging Location, 2020-2035
  • Table 34: Latin America Market Volume (Units) Forecast by Charging Location, 2020-2035
  • Table 35: Latin America Market Value (USD Billion) Forecast by End-Use, 2020-2035
  • Table 36: Latin America Market Volume (Units) Forecast by End-Use, 2020-2035
  • Table 37: Western Europe Market Value (USD Billion) Forecast by Country, 2020-2035
  • Table 38: Western Europe Market Volume (Units) Forecast by Country, 2020-2035
  • Table 39: Western Europe Market Value (USD Billion) Forecast by Vehicle Type, 2020-2035
  • Table 40: Western Europe Market Volume (Units) Forecast by Vehicle Type, 2020-2035
  • Table 41: Western Europe Market Value (USD Billion) Forecast by Charging Speed, 2020-2035
  • Table 42: Western Europe Market Volume (Units) Forecast by Charging Speed, 2020-2035
  • Table 43: Western Europe Market Value (USD Billion) Forecast by Connector Type, 2020-2035
  • Table 44: Western Europe Market Volume (Units) Forecast by Connector Type, 2020-2035
  • Table 45: Western Europe Market Value (USD Billion) Forecast by Charging Location, 2020-2035
  • Table 46: Western Europe Market Volume (Units) Forecast by Charging Location, 2020-2035
  • Table 47: Western Europe Market Value (USD Billion) Forecast by End-Use, 2020-2035
  • Table 48: Western Europe Market Volume (Units) Forecast by End-Use, 2020-2035
  • Table 49: Eastern Europe Market Value (USD Billion) Forecast by Country, 2020-2035
  • Table 50: Eastern Europe Market Volume (Units) Forecast by Country, 2020-2035
  • Table 51: Eastern Europe Market Value (USD Billion) Forecast by Vehicle Type, 2020-2035
  • Table 52: Eastern Europe Market Volume (Units) Forecast by Vehicle Type, 2020-2035
  • Table 53: Eastern Europe Market Value (USD Billion) Forecast by Charging Speed, 2020-2035
  • Table 54: Eastern Europe Market Volume (Units) Forecast by Charging Speed, 2020-2035
  • Table 55: Eastern Europe Market Value (USD Billion) Forecast by Connector Type, 2020-2035
  • Table 56: Eastern Europe Market Volume (Units) Forecast by Connector Type, 2020-2035
  • Table 57: Eastern Europe Market Value (USD Billion) Forecast by Charging Location, 2020-2035
  • Table 58: Eastern Europe Market Volume (Units) Forecast by Charging Location, 2020-2035
  • Table 59: Eastern Europe Market Value (USD Billion) Forecast by End-Use, 2020-2035
  • Table 60: Eastern Europe Market Volume (Units) Forecast by End-Use, 2020-2035
  • Table 61: East Asia Market Value (USD Billion) Forecast by Country, 2020-2035
  • Table 62: East Asia Market Volume (Units) Forecast by Country, 2020-2035
  • Table 63: East Asia Market Value (USD Billion) Forecast by Vehicle Type, 2020-2035
  • Table 64: East Asia Market Volume (Units) Forecast by Vehicle Type, 2020-2035
  • Table 65: East Asia Market Value (USD Billion) Forecast by Charging Speed, 2020-2035
  • Table 66: East Asia Market Volume (Units) Forecast by Charging Speed, 2020-2035
  • Table 67: East Asia Market Value (USD Billion) Forecast by Connector Type, 2020-2035
  • Table 68: East Asia Market Volume (Units) Forecast by Connector Type, 2020-2035
  • Table 69: East Asia Market Value (USD Billion) Forecast by Charging Location, 2020-2035
  • Table 70: East Asia Market Volume (Units) Forecast by Charging Location, 2020-2035
  • Table 71: East Asia Market Value (USD Billion) Forecast by End-Use, 2020-2035
  • Table 72: East Asia Market Volume (Units) Forecast by End-Use, 2020-2035
  • Table 73: South Asia & Pacific Market Value (USD Billion) Forecast by Country, 2020-2035
  • Table 74: South Asia & Pacific Market Volume (Units) Forecast by Country, 2020-2035
  • Table 75: South Asia & Pacific Market Value (USD Billion) Forecast by Vehicle Type, 2020-2035
  • Table 76: South Asia & Pacific Market Volume (Units) Forecast by Vehicle Type, 2020-2035
  • Table 77: South Asia & Pacific Market Value (USD Billion) Forecast by Charging Speed, 2020-2035
  • Table 78: South Asia & Pacific Market Volume (Units) Forecast by Charging Speed, 2020-2035
  • Table 79: South Asia & Pacific Market Value (USD Billion) Forecast by Connector Type, 2020-2035
  • Table 80: South Asia & Pacific Market Volume (Units) Forecast by Connector Type, 2020-2035
  • Table 81: South Asia & Pacific Market Value (USD Billion) Forecast by Charging Location, 2020-2035
  • Table 82: South Asia & Pacific Market Volume (Units) Forecast by Charging Location, 2020-2035
  • Table 83: South Asia & Pacific Market Value (USD Billion) Forecast by End-Use, 2020-2035
  • Table 84: South Asia & Pacific Market Volume (Units) Forecast by End-Use, 2020-2035
  • Table 85: Middle East and Africa Market Value (USD Billion) Forecast by Country, 2020-2035
  • Table 86: Middle East and Africa Market Volume (Units) Forecast by Country, 2020-2035
  • Table 87: Middle East and Africa Market Value (USD Billion) Forecast by Vehicle Type, 2020-2035
  • Table 88: Middle East and Africa Market Volume (Units) Forecast by Vehicle Type, 2020-2035
  • Table 89: Middle East and Africa Market Value (USD Billion) Forecast by Charging Speed, 2020-2035
  • Table 90: Middle East and Africa Market Volume (Units) Forecast by Charging Speed, 2020-2035
  • Table 91: Middle East and Africa Market Value (USD Billion) Forecast by Connector Type, 2020-2035
  • Table 92: Middle East and Africa Market Volume (Units) Forecast by Connector Type, 2020-2035
  • Table 93: Middle East and Africa Market Value (USD Billion) Forecast by Charging Location, 2020-2035
  • Table 94: Middle East and Africa Market Volume (Units) Forecast by Charging Location, 2020-2035
  • Table 95: Middle East and Africa Market Value (USD Billion) Forecast by End-Use, 2020-2035
  • Table 96: Middle East and Africa Market Volume (Units) Forecast by End-Use, 2020-2035

List of Figures

  • Figure 1: Global Market Volume (Units) Forecast 2020-2035
  • Figure 2: Global Market Pricing Analysis
  • Figure 3: Global Market Value (USD Billion) Forecast 2020-2035
  • Figure 4: Global Market Value Share and BPS Analysis by Vehicle Type, 2025 and 2035
  • Figure 5: Global Market Y-o-Y Growth Comparison by Vehicle Type, 2025-2035
  • Figure 6: Global Market Attractiveness Analysis by Vehicle Type
  • Figure 7: Global Market Value Share and BPS Analysis by Charging Speed, 2025 and 2035
  • Figure 8: Global Market Y-o-Y Growth Comparison by Charging Speed, 2025-2035
  • Figure 9: Global Market Attractiveness Analysis by Charging Speed
  • Figure 10: Global Market Value Share and BPS Analysis by Connector Type, 2025 and 2035
  • Figure 11: Global Market Y-o-Y Growth Comparison by Connector Type, 2025-2035
  • Figure 12: Global Market Attractiveness Analysis by Connector Type
  • Figure 13: Global Market Value Share and BPS Analysis by Charging Location, 2025 and 2035
  • Figure 14: Global Market Y-o-Y Growth Comparison by Charging Location, 2025-2035
  • Figure 15: Global Market Attractiveness Analysis by Charging Location
  • Figure 16: Global Market Value Share and BPS Analysis by End-Use, 2025 and 2035
  • Figure 17: Global Market Y-o-Y Growth Comparison by End-Use, 2025-2035
  • Figure 18: Global Market Attractiveness Analysis by End-Use
  • Figure 19: Global Market Value (USD Billion) Share and BPS Analysis by Region, 2025 and 2035
  • Figure 20: Global Market Y-o-Y Growth Comparison by Region, 2025-2035
  • Figure 21: Global Market Attractiveness Analysis by Region
  • Figure 22: North America Market Incremental $ Opportunity, 2025-2035
  • Figure 23: Latin America Market Incremental $ Opportunity, 2025-2035
  • Figure 24: Western Europe Market Incremental $ Opportunity, 2025-2035
  • Figure 25: Eastern Europe Market Incremental $ Opportunity, 2025-2035
  • Figure 26: East Asia Market Incremental $ Opportunity, 2025-2035
  • Figure 27: South Asia & Pacific Market Incremental $ Opportunity, 2025-2035
  • Figure 28: Middle East and Africa Market Incremental $ Opportunity, 2025-2035
  • Figure 29: North America Market Value Share and BPS Analysis by Country, 2025 and 2035
  • Figure 30: North America Market Value Share and BPS Analysis by Vehicle Type, 2025 and 2035
  • Figure 31: North America Market Y-o-Y Growth Comparison by Vehicle Type, 2025-2035
  • Figure 32: North America Market Attractiveness Analysis by Vehicle Type
  • Figure 33: North America Market Value Share and BPS Analysis by Charging Speed, 2025 and 2035
  • Figure 34: North America Market Y-o-Y Growth Comparison by Charging Speed, 2025-2035
  • Figure 35: North America Market Attractiveness Analysis by Charging Speed
  • Figure 36: North America Market Value Share and BPS Analysis by Connector Type, 2025 and 2035
  • Figure 37: North America Market Y-o-Y Growth Comparison by Connector Type, 2025-2035
  • Figure 38: North America Market Attractiveness Analysis by Connector Type
  • Figure 39: North America Market Value Share and BPS Analysis by Charging Location, 2025 and 2035
  • Figure 40: North America Market Y-o-Y Growth Comparison by Charging Location, 2025-2035
  • Figure 41: North America Market Attractiveness Analysis by Charging Location
  • Figure 42: North America Market Value Share and BPS Analysis by End-Use, 2025 and 2035
  • Figure 43: North America Market Y-o-Y Growth Comparison by End-Use, 2025-2035
  • Figure 44: North America Market Attractiveness Analysis by End-Use
  • Figure 45: Latin America Market Value Share and BPS Analysis by Country, 2025 and 2035
  • Figure 46: Latin America Market Value Share and BPS Analysis by Vehicle Type, 2025 and 2035
  • Figure 47: Latin America Market Y-o-Y Growth Comparison by Vehicle Type, 2025-2035
  • Figure 48: Latin America Market Attractiveness Analysis by Vehicle Type
  • Figure 49: Latin America Market Value Share and BPS Analysis by Charging Speed, 2025 and 2035
  • Figure 50: Latin America Market Y-o-Y Growth Comparison by Charging Speed, 2025-2035
  • Figure 51: Latin America Market Attractiveness Analysis by Charging Speed
  • Figure 52: Latin America Market Value Share and BPS Analysis by Connector Type, 2025 and 2035
  • Figure 53: Latin America Market Y-o-Y Growth Comparison by Connector Type, 2025-2035
  • Figure 54: Latin America Market Attractiveness Analysis by Connector Type
  • Figure 55: Latin America Market Value Share and BPS Analysis by Charging Location, 2025 and 2035
  • Figure 56: Latin America Market Y-o-Y Growth Comparison by Charging Location, 2025-2035
  • Figure 57: Latin America Market Attractiveness Analysis by Charging Location
  • Figure 58: Latin America Market Value Share and BPS Analysis by End-Use, 2025 and 2035
  • Figure 59: Latin America Market Y-o-Y Growth Comparison by End-Use, 2025-2035
  • Figure 60: Latin America Market Attractiveness Analysis by End-Use
  • Figure 61: Western Europe Market Value Share and BPS Analysis by Country, 2025 and 2035
  • Figure 62: Western Europe Market Value Share and BPS Analysis by Vehicle Type, 2025 and 2035
  • Figure 63: Western Europe Market Y-o-Y Growth Comparison by Vehicle Type, 2025-2035
  • Figure 64: Western Europe Market Attractiveness Analysis by Vehicle Type
  • Figure 65: Western Europe Market Value Share and BPS Analysis by Charging Speed, 2025 and 2035
  • Figure 66: Western Europe Market Y-o-Y Growth Comparison by Charging Speed, 2025-2035
  • Figure 67: Western Europe Market Attractiveness Analysis by Charging Speed
  • Figure 68: Western Europe Market Value Share and BPS Analysis by Connector Type, 2025 and 2035
  • Figure 69: Western Europe Market Y-o-Y Growth Comparison by Connector Type, 2025-2035
  • Figure 70: Western Europe Market Attractiveness Analysis by Connector Type
  • Figure 71: Western Europe Market Value Share and BPS Analysis by Charging Location, 2025 and 2035
  • Figure 72: Western Europe Market Y-o-Y Growth Comparison by Charging Location, 2025-2035
  • Figure 73: Western Europe Market Attractiveness Analysis by Charging Location
  • Figure 74: Western Europe Market Value Share and BPS Analysis by End-Use, 2025 and 2035
  • Figure 75: Western Europe Market Y-o-Y Growth Comparison by End-Use, 2025-2035
  • Figure 76: Western Europe Market Attractiveness Analysis by End-Use
  • Figure 77: Eastern Europe Market Value Share and BPS Analysis by Country, 2025 and 2035
  • Figure 78: Eastern Europe Market Value Share and BPS Analysis by Vehicle Type, 2025 and 2035
  • Figure 79: Eastern Europe Market Y-o-Y Growth Comparison by Vehicle Type, 2025-2035
  • Figure 80: Eastern Europe Market Attractiveness Analysis by Vehicle Type
  • Figure 81: Eastern Europe Market Value Share and BPS Analysis by Charging Speed, 2025 and 2035
  • Figure 82: Eastern Europe Market Y-o-Y Growth Comparison by Charging Speed, 2025-2035
  • Figure 83: Eastern Europe Market Attractiveness Analysis by Charging Speed
  • Figure 84: Eastern Europe Market Value Share and BPS Analysis by Connector Type, 2025 and 2035
  • Figure 85: Eastern Europe Market Y-o-Y Growth Comparison by Connector Type, 2025-2035
  • Figure 86: Eastern Europe Market Attractiveness Analysis by Connector Type
  • Figure 87: Eastern Europe Market Value Share and BPS Analysis by Charging Location, 2025 and 2035
  • Figure 88: Eastern Europe Market Y-o-Y Growth Comparison by Charging Location, 2025-2035
  • Figure 89: Eastern Europe Market Attractiveness Analysis by Charging Location
  • Figure 90: Eastern Europe Market Value Share and BPS Analysis by End-Use, 2025 and 2035
  • Figure 91: Eastern Europe Market Y-o-Y Growth Comparison by End-Use, 2025-2035
  • Figure 92: Eastern Europe Market Attractiveness Analysis by End-Use
  • Figure 93: East Asia Market Value Share and BPS Analysis by Country, 2025 and 2035
  • Figure 94: East Asia Market Value Share and BPS Analysis by Vehicle Type, 2025 and 2035
  • Figure 95: East Asia Market Y-o-Y Growth Comparison by Vehicle Type, 2025-2035
  • Figure 96: East Asia Market Attractiveness Analysis by Vehicle Type
  • Figure 97: East Asia Market Value Share and BPS Analysis by Charging Speed, 2025 and 2035
  • Figure 98: East Asia Market Y-o-Y Growth Comparison by Charging Speed, 2025-2035
  • Figure 99: East Asia Market Attractiveness Analysis by Charging Speed
  • Figure 100: East Asia Market Value Share and BPS Analysis by Connector Type, 2025 and 2035
  • Figure 101: East Asia Market Y-o-Y Growth Comparison by Connector Type, 2025-2035
  • Figure 102: East Asia Market Attractiveness Analysis by Connector Type
  • Figure 103: East Asia Market Value Share and BPS Analysis by Charging Location, 2025 and 2035
  • Figure 104: East Asia Market Y-o-Y Growth Comparison by Charging Location, 2025-2035
  • Figure 105: East Asia Market Attractiveness Analysis by Charging Location
  • Figure 106: East Asia Market Value Share and BPS Analysis by End-Use, 2025 and 2035
  • Figure 107: East Asia Market Y-o-Y Growth Comparison by End-Use, 2025-2035
  • Figure 108: East Asia Market Attractiveness Analysis by End-Use
  • Figure 109: South Asia & Pacific Market Value Share and BPS Analysis by Country, 2025 and 2035
  • Figure 110: South Asia & Pacific Market Value Share and BPS Analysis by Vehicle Type, 2025 and 2035
  • Figure 111: South Asia & Pacific Market Y-o-Y Growth Comparison by Vehicle Type, 2025-2035
  • Figure 112: South Asia & Pacific Market Attractiveness Analysis by Vehicle Type
  • Figure 113: South Asia & Pacific Market Value Share and BPS Analysis by Charging Speed, 2025 and 2035
  • Figure 114: South Asia & Pacific Market Y-o-Y Growth Comparison by Charging Speed, 2025-2035
  • Figure 115: South Asia & Pacific Market Attractiveness Analysis by Charging Speed
  • Figure 116: South Asia & Pacific Market Value Share and BPS Analysis by Connector Type, 2025 and 2035
  • Figure 117: South Asia & Pacific Market Y-o-Y Growth Comparison by Connector Type, 2025-2035
  • Figure 118: South Asia & Pacific Market Attractiveness Analysis by Connector Type
  • Figure 119: South Asia & Pacific Market Value Share and BPS Analysis by Charging Location, 2025 and 2035
  • Figure 120: South Asia & Pacific Market Y-o-Y Growth Comparison by Charging Location, 2025-2035
  • Figure 121: South Asia & Pacific Market Attractiveness Analysis by Charging Location
  • Figure 122: South Asia & Pacific Market Value Share and BPS Analysis by End-Use, 2025 and 2035
  • Figure 123: South Asia & Pacific Market Y-o-Y Growth Comparison by End-Use, 2025-2035
  • Figure 124: South Asia & Pacific Market Attractiveness Analysis by End-Use
  • Figure 125: Middle East and Africa Market Value Share and BPS Analysis by Country, 2025 and 2035
  • Figure 126: Middle East and Africa Market Value Share and BPS Analysis by Vehicle Type, 2025 and 2035
  • Figure 127: Middle East and Africa Market Y-o-Y Growth Comparison by Vehicle Type, 2025-2035
  • Figure 128: Middle East and Africa Market Attractiveness Analysis by Vehicle Type
  • Figure 129: Middle East and Africa Market Value Share and BPS Analysis by Charging Speed, 2025 and 2035
  • Figure 130: Middle East and Africa Market Y-o-Y Growth Comparison by Charging Speed, 2025-2035
  • Figure 131: Middle East and Africa Market Attractiveness Analysis by Charging Speed
  • Figure 132: Middle East and Africa Market Value Share and BPS Analysis by Connector Type, 2025 and 2035
  • Figure 133: Middle East and Africa Market Y-o-Y Growth Comparison by Connector Type, 2025-2035
  • Figure 134: Middle East and Africa Market Attractiveness Analysis by Connector Type
  • Figure 135: Middle East and Africa Market Value Share and BPS Analysis by Charging Location, 2025 and 2035
  • Figure 136: Middle East and Africa Market Y-o-Y Growth Comparison by Charging Location, 2025-2035
  • Figure 137: Middle East and Africa Market Attractiveness Analysis by Charging Location
  • Figure 138: Middle East and Africa Market Value Share and BPS Analysis by End-Use, 2025 and 2035
  • Figure 139: Middle East and Africa Market Y-o-Y Growth Comparison by End-Use, 2025-2035
  • Figure 140: Middle East and Africa Market Attractiveness Analysis by End-Use
  • Figure 141: Global Market - Tier Structure Analysis
  • Figure 142: Global Market - Company Share Analysis

Frequently Asked Questions

What is the projected size of the hypercharger market by 2035?

The hypercharger market is expected to reach USD 33.2 billion by 2035.

What is the forecasted CAGR of the hypercharger market from 2025 to 2035?

The market is growing at a CAGR of 19.5% during this period.

Which segment leads the hypercharger market in 2025 by application?

Passenger cars hold the leading segment with 60% market share in 2025.

What charging speed segment dominates the hypercharger market in 2025?

The 150-350 kW chargers segment leads with 45% share.

Which company holds the largest industry share in the hypercharger market?

ABB holds the largest share with 25% of the industry.

Future Market Insights

Hypercharger Market