The Hypervisor Market is estimated to be valued at USD 7.0 billion in 2025 and is projected to reach USD 10.7 billion by 2035, registering a compound annual growth rate (CAGR) of 4.3% over the forecast period.
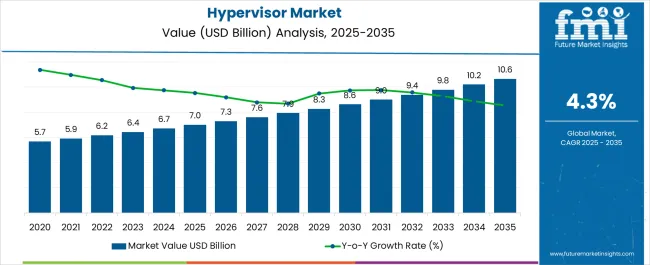
| Metric | Value |
|---|---|
| Hypervisor Market Estimated Value in (2025 E) | USD 7.0 billion |
| Hypervisor Market Forecast Value in (2035 F) | USD 10.7 billion |
| Forecast CAGR (2025 to 2035) | 4.3% |
The hypervisor market is progressing at a steady pace, driven by increasing adoption of virtualization technologies across industries and the rising need for optimized IT infrastructure. Industry announcements and company reports have emphasized that hypervisors play a central role in enhancing system utilization, enabling workload consolidation, and improving scalability. The growing volume of data generated by connected devices and enterprise applications has created demand for efficient resource management, where hypervisors offer critical value.
Cloud service providers and enterprise IT departments have expanded virtualization deployments to reduce hardware dependency, improve disaster recovery, and ensure workload portability across diverse environments. Furthermore, advancements in hardware-assisted virtualization and improvements in hypervisor security features have widened deployment across both consumer and enterprise settings.
Looking forward, the market is expected to be shaped by integration with edge computing, increasing demand for lightweight hypervisors for IoT devices, and continuous innovation in multi-cloud management platforms. Segmental growth is anticipated to be led by hardware components, consumer electronics applications, and large enterprise adoption due to their scale, efficiency requirements, and technology integration priorities.
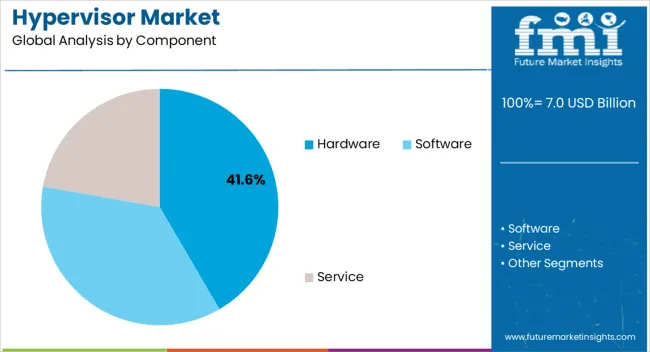
The hardware segment is projected to contribute 41.6% of the hypervisor market revenue in 2025, maintaining its leading position among components. This segment’s growth has been supported by the role of hardware-based virtualization accelerators, including processors with embedded virtualization extensions, in delivering higher efficiency and reduced overhead.
Hardware innovations have enhanced system stability, reduced latency, and improved security isolation between virtual machines, driving adoption across critical enterprise and consumer workloads.
Additionally, hypervisor performance has increasingly relied on hardware features that enable compatibility with cloud-native environments and container orchestration systems. Market demand for robust and scalable virtualization has further reinforced the reliance on hardware-backed solutions, ensuring that this segment continues to anchor growth in the hypervisor ecosystem.
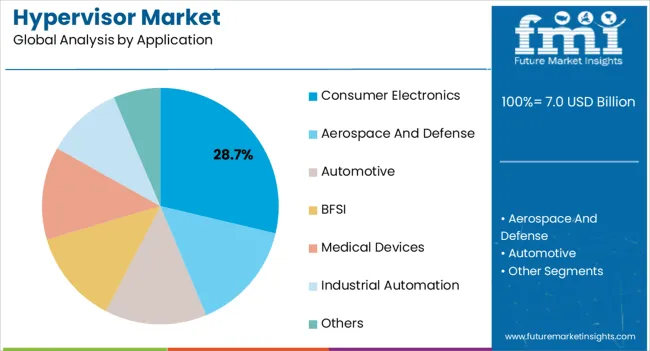
The consumer electronics segment is projected to account for 28.7% of the hypervisor market revenue in 2025, emerging as a significant application area. Growth has been fueled by the integration of virtualization technologies into devices such as smartphones, smart TVs, and gaming consoles, where hypervisors enable secure multi-OS environments and workload separation.
Industry updates have indicated that device manufacturers are adopting hypervisors to enhance system performance, extend device functionality, and support advanced security features.
The rapid proliferation of IoT-enabled consumer devices has also created new opportunities for virtualization at the device level. With consumer expectations around device reliability, security, and seamless functionality continuing to rise, the consumer electronics segment is expected to remain a key contributor to the hypervisor market.
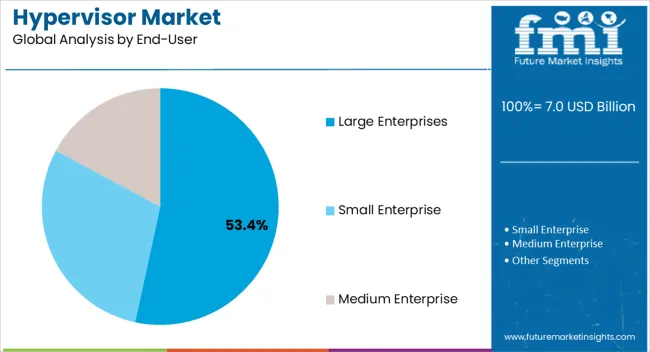
The large enterprises segment is projected to hold 53.4% of the hypervisor market revenue in 2025, sustaining its leadership in end-user adoption. This dominance has been driven by the extensive use of virtualization to reduce IT costs, improve workload flexibility, and ensure business continuity.
Annual reports and enterprise IT strategy documents have highlighted large organizations’ preference for hypervisors to support hybrid cloud models, streamline data center operations, and strengthen disaster recovery frameworks.
Large enterprises have also invested heavily in advanced virtualization management tools and hypervisor security features, ensuring compliance with regulatory requirements and data protection standards. As digital transformation accelerates across industries, the large enterprises segment is expected to maintain its stronghold, supported by the scale of operations, complex IT infrastructure needs, and ongoing investments in virtualized and cloud-driven environments.
Virtualization technology is increasingly being used in companies for performance and safety purposes. Another factor projected to boost the growth of the global hypervisor market is the adoption of virtual machines in the aerospace and military sectors. Among the other factors driving the growth of the global hypervisor market is the rapid rise in the use of smartphones and tablets.
Hypervisor technology is predicted to play an important part in the future of self-driving cars and mobility services. ADAS has already been shown to be a reliable system, and newer versions are being released. Demand for hypervisors is likely to expand as V2V and V2I technologies become more prevalent. Several companies are making considerable investments in the development of autonomous and semi-autonomous technologies. Tesla, for example, has begun manufacturing vehicles, including the Model 3, which has the technology required for complete self-driving capabilities at a safety level much superior to that of a human driver. Even car OEMs such as Toyota of Japan and Daimler of Germany are launching robot-taxi services. Such advancements are going to play a major role in bolstering the global hypervisor market during the forecast period.
Economy-class passenger cars include fewer advanced amenities such as digital clusters, entertainment applications, safety systems, and others, which are predicted to necessitate fewer multi-domain controllers. As a result, the economy vehicle sector has ECUs and a limited number of hypervisors per MDC. This hurts the economy .vehicle market. As a result, fewer infotainment options are given to keep the economy vehicle's cost low. This aspect limits automakers' ability to put modern features in economy passenger cars to keep overall vehicle prices low and maintain sales of these versions. As a result, advanced features such as ADAS and safety, body and comfort, cockpit telematics, and others are mostly found in mid-priced and luxury vehicles.
Compliance concerns with configurations in hypervisor converged systems and expensive initial infrastructure expenditures for implementation are a few of the challenges limiting the growth of the global hypervisor industry.Compliance concerns with configurations in hypervisor converged systems, as well as expensive initial infrastructure expenditures for implementation, are a few of the challenges limiting the growth of the global hypervisor industry.
A few well-known automobile manufacturers are partnering with technologically advanced companies to make steady progress in the development of autonomous vehicles. Companies including Ford, Nissan, General Motors, Tesla, Mercedes-Benz, and Honda have invested billions of dollars in the research and development of autonomous vehicles based on the platform developed by ADAS (Advanced Driver Assistance Systems).
Technology behemoths such as Apple, IBM, and Intel worked with top automakers to remain competitive. It is expected that autonomous vehicles will be on the road and commercialized. The introduction of ADAS (Advanced Driver Assistance Systems), such as adaptive braking, self-parking, backup cameras, and automatic cruise control, raises the safety of passengers in vehicles even more.In order to remain competitive, technology behemoths such as Apple, IBM, and Intel worked with top automakers. It is expected that autonomous vehicles would be on the road and commercialized. The introduction of ADAS (Advanced Driver Assistance Systems) such as adaptive braking, self-parking, backup cameras, and automatic cruise control raises the safety of passengers in vehicles even more.
Another trend in the vehicle ecosystem is shared mobility services. These vehicles are expected to have very advanced sensors for effective communication. As a result, these automotive electronic trends are likely to provide profitable prospects for the global hypervisor market participants during the forecast period.
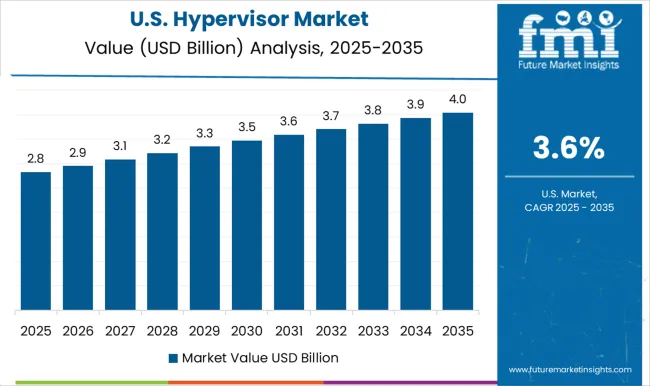
In terms of market share and revenue, the North American market is expected to be the most lucrative from 2025 to 2035. The analysts at Future Market Insights predict that by 2025, the market of hypervisors in North America is expected to acquire a global market size of 23.4%.
North America has the greatest market share for embedded hypervisor software globally. The market is growing due to rising IT requirements and rising demand for embedded hypervisor solutions from the smart home segment. Furthermore, significant technical improvements in smart gadgets encourage the use of embedded hypervisor software.
The presence of numerous significant technology vendors and well-established research and development institutes supports the region's hypervisor software market shares. Furthermore, increased expenditure on personal devices, wearables, and the technology environment, together with rising semiconductor markets, enhances the size of the region's hypervisor software industry.
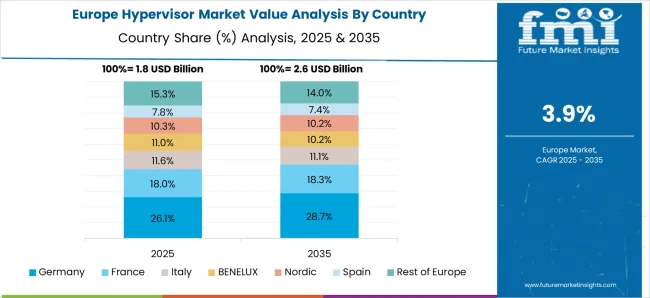
By 2025, Europe will hold approximately 20.4% of the global market share. This region is expected to grow steadily during the forecast period, 2025 to 2035. With rising disposable incomes in the EU, there has been a surge in sales of premium vehicles, including EVs. The luxury car industry is projected to be the automotive hypervisor market's fastest-expanding category. Because the development cost of hypervisor technology is always higher, it is usually used in luxury vehicles.
Luxury automobiles are outfitted with improved safety, comfort, and convenience amenities, making the embedded technology more complex with a high hardware content. Because of this, the market for virtualized techniques is higher in high-end vehicles. However, as technology advances, the use of hypervisors in economy-class vehicles is projected to increase in the future years.
By 2035, the Asia Pacific area is expected to be a big automotive hypervisor market. The region is home to some of the world's fastest-growing economies, including China and India. The Asia Pacific area is the largest automotive market due to rising consumer spending power, which has increased demand for automobiles in the region.
Financial benefits for OEMs, low automobile penetration levels, and rising vehicle production all present appealing market potential for automakers and automotive component suppliers. Because of the availability of cheap labor and low production costs, many large OEMs have established manufacturing units in the region or partnered with big local car makers. This is also fuelling demand for high-end passenger vehicles, which have shown to be a lucrative market for hypervisor technology in the coming years. Thus, the automotive section will boost the demand of the European hypervisor market.Thus the automotive section will boost the demand of the European hypervisor market.
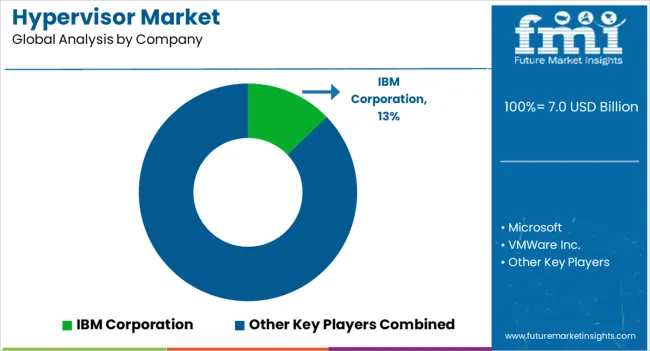
The key players of this market include IBM Corporation, Microsoft Corporation, Vmware, Inc., NXP Semiconductors N.V., QNX Software Systems Limited, Mentor Graphics, WindRiver Systems, Waymo, Inc., LRDA, BlackBerry Limited, TenAsys Corporation, Lynx Software Technologies, Inc, and Green Hills Software.
Recent Developments
| Attributes | Details |
|---|---|
| Growth Rate | CAGR of 4.3% from 2025 to 2035 |
| Market Value in 2025 | USD 7.0 billion |
| Market Value in 2035 | USD 10.7 billion |
| Base Year for Estimation | 2025 |
| Historical Data | 2020 to 2025 |
| Forecast Period | 2025 to 2035 |
| Quantitative Units | Revenue in USD million and CAGR from 2025 to 2035 |
| Report Coverage | Revenue Forecast, Company Ranking, Competitive Landscape, Growth Factors, Trends, and Pricing Analysis |
| Segments Covered | Component, Application, End User, Region |
| Regions Covered | North America; Latin America; Europe; Asia Pacific; Middle East and Africa |
| Key Countries Profiled | United States of America, Canada, Brazil, Mexico, Germany, United Kingdom, France, Spain, Italy, China, Japan, South Korea, Malaysia, Singapore, Australia, GCC Countries, South Africa, Israel |
| Key Companies Profiled | IBM Corporation; Microsoft; VMWare Inc.; NXP Semiconductors N.V; QNX Software Systems Limited; Siemens; WindRiver Systems Inc.; TenAsys Corporation; Lynx Software Technologies Inc.; Green Hills Software |
| Report Customization & Pricing | Available upon Request |
The global hypervisor market is estimated to be valued at USD 7.0 billion in 2025.
The market size for the hypervisor market is projected to reach USD 10.7 billion by 2035.
The hypervisor market is expected to grow at a 4.3% CAGR between 2025 and 2035.
The key product types in hypervisor market are hardware, software and service.
In terms of application, consumer electronics segment to command 28.7% share in the hypervisor market in 2025.


Full Research Suite comprises of:
Market outlook & trends analysis
Interviews & case studies
Strategic recommendations
Vendor profiles & capabilities analysis
5-year forecasts
8 regions and 60+ country-level data splits
Market segment data splits
12 months of continuous data updates
DELIVERED AS:
PDF EXCEL ONLINE
Embedded Hypervisor Market Report – Trends, Demand & Industry Forecast 2025–2035

Thank you!
You will receive an email from our Business Development Manager. Please be sure to check your SPAM/JUNK folder too.
Chat With
MaRIA