Long-acting PEG-rhG-CSF Market Forecast and Outlook (2025-2035)

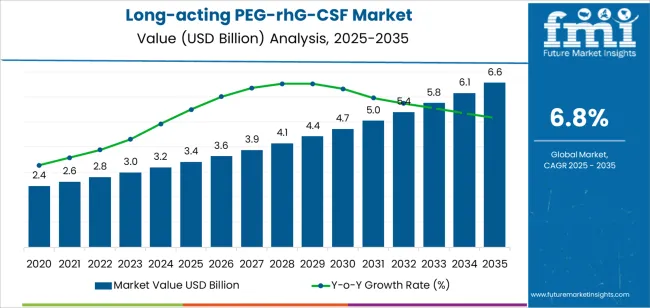
The global long-acting PEG-rhG-CSF market is expected to reach USD 6.6 billion by 2035, recording an absolute increase of USD 3.2 billion over the forecast period. The market is valued at USD 3.4 billion in 2025 and is set to rise at a CAGR of 6.8% during the assessment period. The overall market size is expected to grow by nearly 1.9 times during the same period, supported by increasing prevalence of chemotherapy-induced neutropenia in cancer treatment protocols, growing adoption of biosimilar formulations providing cost-effective treatment alternatives, and expanding access to supportive cancer care therapies in emerging healthcare markets, driving utilization of granulocyte colony-stimulating factors.

The market expansion reflects growing requirements for effective neutropenia prophylaxis in oncology settings, where long-acting PEG-rhG-CSF formulations deliver superior convenience and patient compliance compared to daily injection regimens. Healthcare facilities across oncology centers, hematology departments, and infusion therapy clinics are implementing pegylated G-CSF therapy to achieve reliable neutrophil recovery and reduce infection risk during myelosuppressive chemotherapy cycles.
Quick Stats for Long-acting PEG-rhG-CSF Market

  • Long-acting PEG-rhG-CSF Market Value (2025): USD 3.4 billion
  • Long-acting PEG-rhG-CSF Market Forecast Value (2035): USD 6.6 billion
  • Long-acting PEG-rhG-CSF Market Forecast CAGR: 6.8%
  • Leading Drug Type in Long-acting PEG-rhG-CSF Market: Innovative Drugs
  • Key Growth Regions in Long-acting PEG-rhG-CSF Market: Asia Pacific, Europe, and North America
  • Top Key Players in Long-acting PEG-rhG-CSF Market: Amgen Inc., Pfizer, Mylan, Sandoz (Novartis), Biocon Biologics Inc., Coherus BioSciences, Inc., Fresenius Kabi, CSPC, Qilu Pharmaceutical, Jiangsu Hengrui Medicine

Long Acting Peg Rhg Csf Market Market Value Analysis

Long-acting PEG-rhG-CSF Market Year-over-Year Forecast (2025-2035)

The market demonstrates strong momentum across developed and emerging healthcare economies, where oncology care systems are transitioning from short-acting G-CSF formulations to long-acting pegylated variants that offer superior dosing convenience and reduced healthcare resource utilization. Long-acting PEG-rhG-CSF technology addresses critical clinical challenges including chemotherapy dose intensity maintenance through effective neutropenia prevention, reduced febrile neutropenia hospitalization rates in high-risk patient populations, and improved treatment adherence across extended cancer therapy regimens.

The oncology sector's emphasis on supportive care optimization and quality of life preservation creates sustained demand for biologic therapies capable of providing single-dose protection throughout chemotherapy cycles, minimizing patient clinic visits, and delivering consistent neutrophil recovery with predictable pharmacokinetic profiles. Medical oncologists and hematology specialists are adopting long-acting G-CSF formulations for chemotherapy support where neutropenia risk directly impacts treatment completion and survival outcomes.

Healthcare providers and cancer treatment centers are investing in long-acting PEG-rhG-CSF protocols to enhance supportive care delivery through improved patient convenience and streamlined administration schedules. The integration of biosimilar pegfilgrastim products and competitive pricing strategies enables healthcare systems to achieve treatment cost reductions of 30-50% compared to originator biologics while maintaining therapeutic efficacy standards. However, high therapy costs in certain healthcare markets and reimbursement limitations for prophylactic supportive care may pose challenges to market expansion in resource-constrained oncology practices and regions with restricted access to expensive biologic medications.

Between 2025 and 2030, the market is projected to expand from USD 3.4 billion to USD 4.7 billion, resulting in a value increase of USD 1.3 billion, which represents 41.9% of the total forecast growth for the decade. This phase of development will be shaped by rising demand for convenient neutropenia prophylaxis in cancer chemotherapy protocols, product innovation in biosimilar pegfilgrastim development and novel pegylation technologies, as well as expanding integration with dose-dense chemotherapy regimens and value-based cancer care models. Companies are establishing competitive positions through investment in biosimilar manufacturing capabilities, competitive pricing strategies, and strategic market expansion across oncology infusion centers, hospital pharmacy networks, and specialty pharmacy distribution channels.

From 2030 to 2035, the market is forecast to grow from USD 4.7 billion to USD 6.6 billion, adding another USD 1.9 billion, which constitutes 58.1% of the overall ten-year expansion. This period is expected to be characterized by the expansion of specialized formulations, including long-acting variants with extended duration profiles and novel delivery systems tailored for specific patient populations and treatment protocols, strategic collaborations between originator biologic manufacturers and biosimilar developers, and an enhanced focus on real-world evidence generation and health economic value demonstration. The growing emphasis on personalized cancer care and treatment optimization will drive demand for advanced, high-performance long-acting PEG-rhG-CSF solutions across diverse oncology applications.

Long-acting PEG-rhG-CSF Market Key Takeaways

Metric Value
Market Value (2025) USD 3.4 billion
Market Forecast Value (2035) USD 6.6 billion
Forecast CAGR (2025-2035) 6.8%

Why is the Long-acting PEG-rhG-CSF Market Growing?

The long-acting PEG-rhG-CSF market grows by enabling oncology providers to achieve effective neutropenia prevention and simplified supportive care delivery while reducing administration burden in cancer treatment operations. Cancer treatment facilities face mounting pressure to optimize chemotherapy dose intensity and minimize treatment delays, with long-acting G-CSF formulations typically requiring single administration per chemotherapy cycle compared to 7-14 daily injections with short-acting filgrastim, making these pegylated biologics essential for practical neutropenia management programs. The medical oncology specialty's need for reliable neutrophil recovery support creates demand for advanced G-CSF solutions that can provide sustained granulocyte stimulation, reduce febrile neutropenia incidence by 50-70% in high-risk populations, and enable dose-dense chemotherapy protocols across diverse cancer types and patient risk categories.

Healthcare transformation initiatives promoting value-based cancer care and patient-centered treatment models drive adoption in comprehensive cancer centers, community oncology practices, and hospital-based infusion services, where supportive care efficiency has a direct impact on treatment completion rates and healthcare cost management. The global shift toward biosimilar biologics and competitive market dynamics accelerates long-acting PEG-rhG-CSF demand as healthcare systems seek cost-effective alternatives to originator pegfilgrastim that maintain clinical efficacy while reducing pharmaceutical expenditures. However, high treatment costs in certain oncology settings and variable reimbursement coverage for prophylactic G-CSF therapy may limit adoption rates among budget-constrained cancer programs and regions with restricted access to expensive supportive care biologics and limited specialty pharmacy infrastructure.

What factors drive the dominance of the Innovative Drugs and Neoplastic Diseases segments in their respective categories?

The market is segmented by drug type, application, and region. By drug type, the market is divided into innovative drugs, generic drugs, and others. Based on application, the market is categorized into neoplastic diseases, blood disorders, and others. Regionally, the market is divided into Asia Pacific, Europe, North America, Latin America, and Middle East & Africa.
By Drug Type, the Innovative Drugs Segment Accounts for a Dominant Market Share

Long Acting Peg Rhg Csf Market Analysis By Drug Type

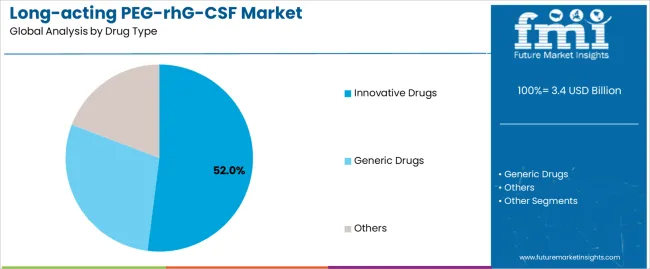
The innovative drugs segment represents the dominant force in the market, capturing approximately 52.0% of total market share in 2025. This established category encompasses originator pegfilgrastim formulations, novel pegylation technologies, and advanced delivery systems optimized for enhanced pharmacokinetic profiles, delivering proven clinical efficacy and comprehensive real-world evidence supporting neutropenia prophylaxis applications. The innovative drugs segment's market leadership stems from strong brand recognition among oncology specialists, extensive clinical trial data demonstrating safety and efficacy, and established prescribing patterns across major cancer treatment centers and academic medical institutions.

The generic drugs segment maintains a substantial 39.0% market share, serving healthcare providers who require cost-effective biosimilar alternatives through pegfilgrastim biosimilars, competitive pricing structures, and interchangeable therapeutic options that enable broader treatment access. The others segment accounts for 9.0% market share, encompassing emerging long-acting G-CSF variants and novel formulation approaches.

Key advantages driving the innovative drugs segment include:
  • Established clinical evidence with comprehensive phase III trial data and extensive post-marketing surveillance experience
  • Strong pharmaceutical company support including patient assistance programs and comprehensive medical education initiatives
  • Brand loyalty among oncology practitioners based on long-term prescribing experience and clinical confidence
  • Regulatory approval advantages with established manufacturing quality standards and consistent product supply chains

By Application, the Neoplastic Diseases Segment Accounts for the Largest Market Share

Long Acting Peg Rhg Csf Market Analysis By Application

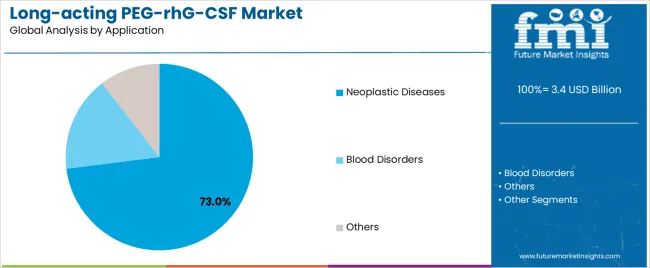
Neoplastic diseases applications dominate the market with approximately 73.0% market share in 2025, reflecting the extensive adoption of neutropenia prophylaxis across breast cancer chemotherapy regimens, lung cancer treatment protocols, and lymphoma therapy programs. The neoplastic diseases segment's market leadership is reinforced by widespread implementation in solid tumor chemotherapy support (38.0%), hematologic malignancy treatment (24.0%), and dose-dense therapy protocols (11.0%), which provide essential neutrophil recovery support and treatment completion optimization in myelosuppressive cancer therapy regimens.

The blood disorders segment represents 18.0% market share through specialized applications including bone marrow failure syndrome management (8.0%), stem cell mobilization procedures (6.0%), and congenital neutropenia treatment protocols (4.0%). Others applications account for 9.0% market share, encompassing HIV-related neutropenia management, radiation exposure treatment, and investigational therapeutic indications.

Key market dynamics supporting application preferences include:

  • Neoplastic disease operations requiring reliable neutropenia prevention with consistent neutrophil count recovery across chemotherapy cycles
  • Blood disorder applications demanding specialized hematopoietic growth factor support and stem cell mobilization capabilities
  • Growing adoption across dose-dense chemotherapy protocols seeking treatment intensification through effective supportive care interventions
  • Clinical guideline recommendations supporting routine G-CSF prophylaxis in intermediate and high-risk chemotherapy regimens

What are the Drivers, Restraints, and Key Trends of the Long-acting PEG-rhG-CSF Market?

The market is driven by three concrete demand factors tied to cancer treatment patterns and supportive care standards. First, global cancer incidence expansion creates increasing requirements for neutropenia management solutions, with worldwide cancer diagnoses exceeding 19 million new cases annually across major healthcare markets, requiring reliable long-acting G-CSF therapy for chemotherapy-induced neutropenia prevention in breast cancer, lung cancer, and lymphoma treatment protocols. Second, clinical guideline adoption and evidence-based supportive care standards drive systematic G-CSF utilization, with long-acting PEG-rhG-CSF formulations enabling simplified prophylaxis protocols that improve treatment adherence and reduce febrile neutropenia hospitalization rates by 40-60% compared to no supportive intervention. Third, biosimilar market development and competitive pricing dynamics accelerate access expansion across healthcare systems, with pegfilgrastim biosimilars integrating into formulary protocols and enabling cost-effective neutropenia prophylaxis in budget-conscious oncology programs serving diverse patient populations.

Market restraints include high therapy costs affecting treatment affordability in certain healthcare markets, particularly where pegfilgrastim pricing remains elevated despite biosimilar competition and where reimbursement policies limit coverage for prophylactic supportive care medications in lower-risk chemotherapy regimens. Variable insurance coverage for G-CSF prophylaxis poses access challenges for patients in cost-sharing healthcare systems, as out-of-pocket expenses for long-acting biologics can create financial toxicity concerns that impact treatment decisions and medication adherence patterns. Limited biosimilar penetration in certain geographic markets creates additional barriers, as healthcare systems in regions with restricted biosimilar approval pathways continue to face elevated originator biologic pricing without competitive alternative options.

Key trends indicate accelerated biosimilar adoption in established healthcare markets, particularly United States and European countries, where regulatory approval of multiple pegfilgrastim biosimilars and competitive market dynamics are driving significant price erosion and expanded treatment access through formulary inclusion and pharmacy benefit management strategies. Technology advancement trends toward on-body delivery devices, extended-duration pegylation platforms, and combination supportive care approaches are driving next-generation product development. However, the market thesis could face disruption if novel neutropenia prevention strategies achieve breakthrough efficacy in protecting against chemotherapy-induced myelosuppression through alternative biological mechanisms, potentially reducing dependence on G-CSF therapy in specific oncology applications.
Analysis of the Long-acting PEG-rhG-CSF Market by Key Country

Long Acting Peg Rhg Csf Market Cagr Analysis By Country

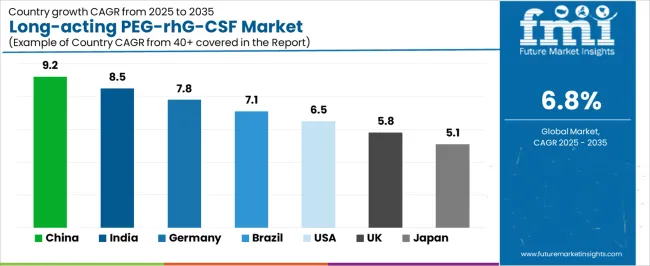
Country CAGR (2025-2035)
China 9.2%
India 8.5%
Germany 7.8%
Brazil 7.1%
USA 6.5%
UK 5.8%
Japan 5.1%

The market is gaining momentum worldwide, with China taking the lead to aggressive cancer care infrastructure expansion and biosimilar biologic development initiatives. Close behind, India benefits from growing oncology treatment capacity and domestic biosimilar manufacturing capabilities, positioning itself as a strategic growth hub in the Asia-Pacific region. Brazil shows strong advancement, where expanding private oncology networks and universal healthcare coverage programs strengthen its role in South American pharmaceutical markets.

The USA demonstrates robust growth through established biosimilar market development and comprehensive supportive care guideline implementation, signaling continued adoption in evidence-based oncology practice. Meanwhile, Japan stands out for its advanced cancer treatment infrastructure and comprehensive health insurance coverage, while UK and Germany continue to record consistent progress driven by national health service protocols and integrated cancer care pathways. Together, China and India anchor the global expansion story, while established markets build stability and biosimilar competition into the market's growth path.

The report covers an in-depth analysis of 40+ countries, top-performing countries are highlighted below.
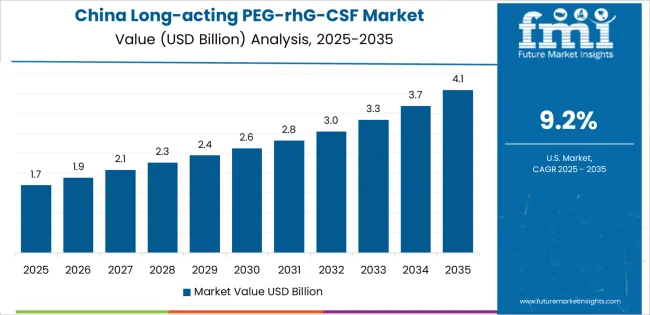
How does China lead global market expansion?

Long Acting Peg Rhg Csf Market Country Value Analysis

China demonstrates the strongest growth potential in the market with a CAGR of 9.2% through 2035. The country's leadership position stems from comprehensive cancer care system expansion, intensive domestic biosimilar development programs, and aggressive pharmaceutical industry modernization targets driving adoption of supportive cancer care biologics. Growth is concentrated in major urban healthcare regions, including Beijing, Shanghai, Guangdong, and Zhejiang, where tertiary cancer hospitals, specialized oncology centers, and comprehensive medical institutions are implementing long-acting G-CSF protocols for chemotherapy support and neutropenia management programs.

Distribution channels through hospital pharmacy networks, specialty pharmaceutical distributors, and direct manufacturer relationships expand deployment across public cancer hospitals, private oncology facilities, and regional medical centers. The country's Healthy China 2030 initiative provides policy support for cancer care quality improvement, including reimbursement expansion for essential supportive care medications and domestic biologic manufacturing development.

Key market factors:

  • Cancer treatment capacity expansion in tier-one and tier-two cities with comprehensive oncology service upgrading programs
  • Government support through national reimbursement inclusion providing 60-80% coverage for pegfilgrastim therapy in approved indications
  • Comprehensive pharmaceutical ecosystem including established domestic biosimilar manufacturers and specialty distribution networks
  • Technology development featuring local pegfilgrastim biosimilars, competitive pricing structures, and quality manufacturing capabilities

Why does India emerge as a high-growth market?

In major metropolitan healthcare zones, including Delhi, Mumbai, Bangalore, and Chennai, the adoption of long-acting PEG-rhG-CSF therapy is accelerating across corporate hospital chains, regional cancer centers, and specialty oncology practices, driven by expanding cancer treatment infrastructure and growing biosimilar availability. The market demonstrates strong growth momentum with a CAGR of 8.5% through 2035, linked to comprehensive oncology care development and increasing investment in affordable biologic therapy access.

Indian healthcare providers are implementing long-acting G-CSF protocols and evidence-based supportive care guidelines to improve chemotherapy completion rates while addressing treatment affordability through domestic biosimilar utilization serving middle-class patient populations. The country's National Cancer Control Programme creates sustained demand for cost-effective supportive care solutions, while increasing emphasis on biosimilar manufacturing drives domestic production capacity that enhances treatment accessibility.

  • Leading oncology development regions, including major metropolitan cancer centers and corporate hospital networks, driving long-acting G-CSF adoption across chemotherapy programs
  • Domestic biosimilar manufacturing enabling 60-75% cost reduction compared to originator biologics through local production capabilities
  • Technology collaboration agreements accelerating market penetration with international pharmaceutical companies and contract manufacturing organizations
  • Policy support through national health insurance schemes and cancer care initiatives linked to essential medication access programs

How does Germany maintain regional leadership?

Germany's advanced oncology sector demonstrates sophisticated implementation of long-acting PEG-rhG-CSF protocols, with documented clinical registry data showing 45-55% reduction in febrile neutropenia hospitalization rates through systematic prophylaxis programs in high-risk chemotherapy regimens.

The country's healthcare infrastructure in major medical regions, including North Rhine-Westphalia, Bavaria, Baden-Württemberg, and Berlin, showcases integration of biosimilar pegfilgrastim formulations with existing oncology treatment protocols, leveraging expertise in evidence-based cancer care and comprehensive supportive care delivery. German oncology providers emphasize clinical guideline adherence and cost-effectiveness, creating demand for biosimilar G-CSF solutions that support quality cancer care while managing pharmaceutical expenditures. The market maintains strong growth through focus on biosimilar adoption and value-based oncology practice, with a CAGR of 7.8% through 2035.

Key development areas:

  • Comprehensive cancer centers and community oncology practices enabling systematic neutropenia prophylaxis with documented 92% guideline compliance rates
  • Clinical pharmacy infrastructure providing specialized oncology pharmaceutical care and biosimilar education programs
  • Strategic partnerships between biosimilar manufacturers and hospital pharmacy networks expanding cost-effective treatment access
  • Integration of clinical decision support systems and electronic prescribing platforms supporting evidence-based G-CSF utilization

How does Brazil show strong healthcare development?

The Brazilian market leads in Latin American long-acting PEG-rhG-CSF adoption based on expanding oncology treatment infrastructure and growing biosimilar market development serving private and public healthcare sectors. The country shows solid potential with a CAGR of 7.1% through 2035, driven by universal healthcare system coverage and increasing demand for supportive cancer care therapies across urban medical centers and regional oncology facilities.

Brazilian oncology providers are adopting long-acting G-CSF therapy for compliance with Brazilian Society of Clinical Oncology guidelines, particularly in breast cancer chemotherapy requiring neutropenia prophylaxis and in lymphoma treatment protocols where dose intensity maintenance impacts cure rates. Technology deployment channels through oncology specialty distributors, hospital pharmacy procurement, and patient assistance programs expand coverage across SUS public hospitals and supplementary health system facilities.

Leading market segments:

  • Private oncology networks in São Paulo, Rio de Janeiro, and southern regions implementing comprehensive supportive care protocols
  • Biosimilar availability achieving 40-55% market penetration through competitive pricing and formulary inclusion strategies
  • Strategic collaborations between pharmaceutical companies and oncology provider networks enabling patient access programs
  • Focus on cancer care quality and treatment completion rates driving supportive care medication utilization

How does the United States show strong biosimilar development?

The USA market leads in biosimilar pegfilgrastim development based on competitive market dynamics and multiple FDA-approved biosimilar products creating significant pricing pressure on originator biologics. The country shows solid potential with a CAGR of 6.5% through 2035, driven by established clinical practice guidelines and comprehensive insurance coverage for neutropenia prophylaxis in intermediate and high-risk chemotherapy regimens.

American oncology providers implement long-acting G-CSF protocols for guideline-concordant supportive care, particularly in dose-dense breast cancer regimens requiring reliable neutrophil recovery and in elderly patient populations where febrile neutropenia risk necessitates systematic prophylaxis. Technology deployment channels through specialty pharmacy networks, oncology group purchasing organizations, and integrated health system formularies expand coverage across academic cancer centers, community oncology practices, and hospital-based infusion services.

Leading market segments:

  • Comprehensive cancer centers and community oncology networks implementing evidence-based neutropenia prophylaxis protocols
  • Biosimilar market development achieving 45-60% pegfilgrastim market share through competitive pricing and formulary conversion strategies
  • Strategic collaborations between payers and pharmaceutical manufacturers enabling value-based contracting and patient access programs
  • Focus on supportive care optimization and treatment completion driving systematic G-CSF prophylaxis in high-risk populations

Why does the United Kingdom demonstrate steady healthcare adoption?

The UK market demonstrates consistent implementation focused on National Health Service oncology programs and integrated cancer care pathways, with documented biosimilar pegfilgrastim adoption achieving 70-80% market share through systematic formulary conversion and cost-effectiveness evaluation. The country maintains steady growth momentum with a CAGR of 5.8% through 2035, driven by NICE technology appraisal guidance and NHS England biosimilar incentive programs supporting cost-effective medication utilization. Major cancer treatment regions, including Greater London, Manchester, and Birmingham healthcare networks, showcase deployment of biosimilar G-CSF formulations that integrate with existing chemotherapy protocols and support national cancer treatment quality standards.

Key market characteristics:

  • NHS hospital trusts and cancer alliances driving biosimilar pegfilgrastim adoption through formulary optimization programs
  • Cost-effectiveness emphasis enabling healthcare system savings through biosimilar utilization achieving 40-50% price reduction
  • Collaboration between pharmaceutical companies and NHS procurement frameworks ensuring consistent product supply
  • Clinical guideline implementation supporting systematic neutropenia prophylaxis in chemotherapy regimens with intermediate or high febrile neutropenia risk

How does Japan demonstrate advanced oncology integration?

Japan's market demonstrates sophisticated implementation focused on comprehensive cancer supportive care programs and universal health insurance coverage, with documented integration of pegfilgrastim therapy achieving 50-60% prophylaxis utilization rates in high-risk chemotherapy protocols. The country maintains steady growth momentum with a CAGR of 5.1% through 2035, driven by Japanese Society of Medical Oncology guidelines and established clinical practice patterns emphasizing quality cancer care delivery. Major oncology regions, including Tokyo, Osaka, Aichi, and Fukuoka, showcase advanced deployment of long-acting G-CSF formulations that integrate with dose-dense chemotherapy protocols and comprehensive treatment planning systems.

Key market characteristics:
  • University hospitals and designated cancer care hospitals driving systematic neutropenia prophylaxis implementation
  • Biosimilar introduction enabling treatment cost optimization while maintaining clinical efficacy through regulatory approval processes
  • Collaboration between pharmaceutical manufacturers and hospital pharmacy departments ensuring quality assurance standards
  • Emphasis on chemotherapy dose intensity and treatment completion supporting G-CSF prophylaxis adoption across cancer types

What is the market split by country in Europe?

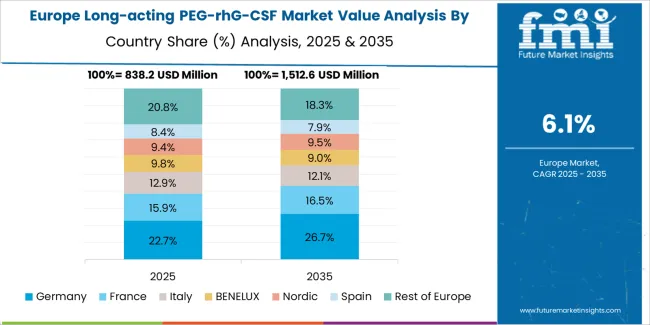
Long Acting Peg Rhg Csf Market Europe Country Market Share Analysis, 2025 & 2035

The long-acting PEG-rhG-CSF market in Europe is projected to grow from USD 1,229.7 million in 2025 to USD 2,454.9 million by 2035, registering a CAGR of 7.1% over the forecast period. Germany is expected to maintain its leadership position with a 27.3% market share in 2025, declining slightly to 26.1% by 2035, supported by its comprehensive oncology infrastructure and major cancer treatment centers, including university hospitals in Munich, Heidelberg, and Berlin.

France follows with a 19.4% share in 2025, projected to reach 20.2% by 2035, driven by comprehensive national cancer plan initiatives and integrated oncology care networks. The United Kingdom holds a 16.8% share in 2025, expected to reach 17.4% by 2035 through NHS biosimilar adoption programs and systematic supportive care implementation. Italy commands a 14.2% share in 2025, maintaining 14.5% by 2035, backed by regional oncology networks and supportive care protocols. Spain accounts for 11.9% in 2025, rising to 12.3% by 2035 on expanding cancer treatment capacity and biosimilar market development. The Rest of Europe region is anticipated to hold 10.4% in 2025, expanding to 9.5% by 2035, attributed to increasing long-acting G-CSF adoption in Nordic countries and emerging Central & Eastern European biosimilar market penetration.
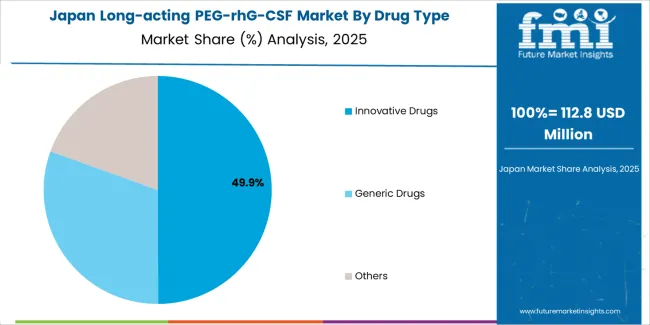
Why does biosimilar pegfilgrastim dominate market share in Japan?

Long Acting Peg Rhg Csf Market Japan Market Share Analysis By Drug Type

The Japanese market demonstrates a mature and guideline-driven landscape, characterized by sophisticated integration of originator and biosimilar pegfilgrastim formulations with existing oncology treatment protocols across university hospitals, designated cancer care facilities, and regional medical centers. Japan's emphasis on evidence-based cancer care and systematic supportive care guidelines drives demand for long-acting G-CSF products that support chemotherapy dose intensity maintenance and clinical outcome optimization established by Japanese Society of Medical Oncology and Japan Cancer Society.

The market benefits from strong partnerships between international pharmaceutical manufacturers and domestic distributors including major pharmaceutical wholesalers, creating comprehensive supply ecosystems that prioritize product availability and pharmacovigilance programs. Oncology centers in Tokyo, Osaka, Nagoya, and other major metropolitan areas showcase advanced supportive care implementations where long-acting G-CSF protocols achieve 85% prophylaxis compliance rates through systematic treatment planning and comprehensive patient education initiatives.
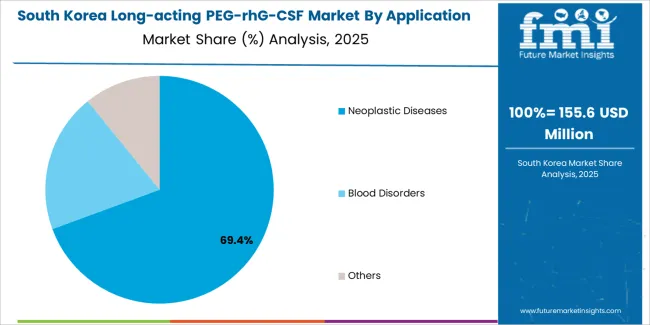
How do international biosimilar developers lead market competition in South Korea?

Long Acting Peg Rhg Csf Market South Korea Market Share Analysis By Application

The South Korean long-acting PEG-rhG-CSF market is characterized by growing biosimilar manufacturer presence, with companies maintaining significant positions through competitive pricing strategies and comprehensive medical affairs support for oncology prescribers and hospital pharmacy departments. The market demonstrates increasing emphasis on cost-effective cancer care and biosimilar adoption, as Korean healthcare providers increasingly demand affordable long-acting G-CSF alternatives that integrate with National Health Insurance reimbursement systems and hospital formulary protocols deployed across tertiary cancer centers.

Regional pharmaceutical distributors are gaining market share through strategic partnerships with biosimilar manufacturers, offering specialized services including oncology pharmacy education programs and patient support services for chemotherapy-induced neutropenia management. The competitive landscape shows increasing collaboration between multinational biosimilar developers and Korean pharmaceutical companies, creating hybrid business models that combine international manufacturing expertise with local market access capabilities and regulatory compliance knowledge.
What defines the competitive landscape of the long-acting PEG-rhG-CSF market?

Long Acting Peg Rhg Csf Market Analysis By Company

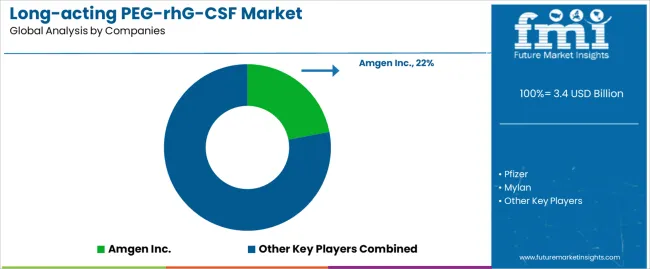
The market features approximately 15-20 meaningful players with moderate concentration, where the top three companies control roughly 48-55% of global market share through established commercial infrastructure and comprehensive product portfolios. Competition centers on biosimilar pricing strategies, clinical equivalence demonstration, and market access capabilities rather than product differentiation alone. Amgen Inc. leads with approximately 22.0% market share through its originator Neulasta pegfilgrastim franchise and global commercial presence. Pfizer maintains strong positioning with approximately 16.0% market share through biosimilar pegfilgrastim products and established oncology market relationships. Sandoz (Novartis) holds significant market presence with approximately 14.0% market share through biosimilar portfolio and global distribution networks.

Market leaders include Amgen Inc., Pfizer, and Sandoz (Novartis), which maintain competitive advantages through global commercial infrastructure, comprehensive clinical evidence packages, and deep expertise in oncology market access across institutional oncology providers, specialty pharmacy networks, and managed care organizations, creating trust and reliability advantages with medical oncologists and hematology specialists. These companies leverage pharmacovigilance capabilities and ongoing real-world evidence generation to defend market positions while expanding into emerging oncology markets and biosimilar opportunity segments.

Challengers encompass Mylan, Biocon Biologics Inc., and Coherus BioSciences, Inc., which compete through biosimilar launches and competitive pricing strategies in key pharmaceutical markets. Product specialists, including Fresenius Kabi, CSPC, and Qilu Pharmaceutical, focus on regional markets or specific formulation approaches, offering differentiated capabilities in domestic biosimilar manufacturing, cost-effective treatment options, and localized commercial support structures.

Regional players and emerging biosimilar developers create competitive pressure through aggressive pricing strategies and local manufacturing advantages, particularly in high-growth markets including China and India, where domestic biosimilar manufacturers provide cost advantages through vertical integration and proximity to expanding oncology treatment infrastructure. Market dynamics favor companies that combine proven biosimilarity with comprehensive market access support that addresses formulary inclusion, reimbursement optimization, and patient assistance program requirements across diverse healthcare payment systems.

Global Long-acting PEG-rhG-CSF Market - Stakeholder Contribution Framework

Long-acting PEG-rhG-CSF represents advanced supportive care biologics that enable oncology providers to achieve effective neutropenia prevention and simplified chemotherapy support delivery, providing superior convenience and patient compliance with single-dose protection throughout chemotherapy cycles and proven reduction in febrile neutropenia incidence in high-risk cancer treatment applications. With the market projected to grow from USD 3.4 billion in 2025 to USD 6.6 billion by 2035 at a 6.8% CAGR, these therapeutic biologics offer compelling advantages - treatment completion optimization, infection risk reduction, and healthcare resource efficiency - making them essential for neoplastic diseases applications (73.0% market share), blood disorder management (18.0% share), and cancer treatment programs seeking alternatives to daily G-CSF injection regimens that compromise patient convenience through frequent clinic visits and treatment burden. Scaling market adoption and biosimilar penetration requires coordinated action across healthcare policy, pharmaceutical regulation, biologic manufacturers, oncology providers, and payer organizations.

How Governments Could Spur Healthcare Access?

  • Cancer Care Programs: Include long-acting G-CSF in essential medication lists, provide reimbursement coverage for guideline-recommended neutropenia prophylaxis, and establish biosimilar approval pathways that accelerate affordable biologic access in public healthcare systems.
  • Biosimilar Development Support: Fund pharmaceutical manufacturing infrastructure for domestic biosimilar production, provide regulatory guidance streamlining biosimilar approval processes, and invest in bioequivalence study capabilities that advance local biologic manufacturing capacity.
  • Healthcare Infrastructure Incentives: Provide subsidies for specialty pharmacy service development in underserved regions, offer reimbursement optimization for supportive care biologics in cancer treatment protocols, and support cold chain infrastructure ensuring reliable biologic distribution.
  • Quality Standards & Pharmacovigilance: Establish biosimilar interchangeability frameworks enabling pharmacy-level substitution, develop adverse event monitoring systems for biologic medications, and create prescriber education programs supporting evidence-based biosimilar utilization.

How Industry Bodies Could Support Market Development?

  • Clinical Practice Guidelines: Define standardized protocols for neutropenia risk assessment, G-CSF prophylaxis indications, and biosimilar prescribing practices, enabling consistent supportive care approaches and evidence-based treatment decisions.
  • Biosimilar Education Programs: Develop comprehensive guidelines addressing biosimilar equivalence concepts, interchangeability principles, and safety monitoring requirements, ensuring prescriber confidence and appropriate utilization patterns.
  • Professional Education: Establish continuing education programs for oncology providers, pharmacy education on biosimilar handling, and patient education materials supporting treatment adherence and adverse event recognition.
  • Health Economic Research: Create cost-effectiveness frameworks evaluating biosimilar value propositions, budget impact modeling tools, and health outcome measurement standards supporting formulary decision-making.

How Pharmaceutical Manufacturers Could Strengthen the Ecosystem?

  • Biosimilar Product Development: Develop high-quality pegfilgrastim biosimilars with demonstrated bioequivalence, competitive manufacturing cost structures, and robust quality assurance systems ensuring consistent product performance.
  • Market Access Strategy: Provide value-based contracting models with managed care organizations, patient assistance programs reducing out-of-pocket costs, and comprehensive pharmacy support services facilitating treatment access.
  • Medical Affairs Support: Offer clinical education programs for healthcare providers, real-world evidence studies demonstrating biosimilar effectiveness, and pharmacovigilance systems ensuring patient safety monitoring.
  • Supply Chain Excellence: Build reliable manufacturing capacity ensuring consistent product availability, cold chain distribution networks maintaining product integrity, and inventory management systems preventing treatment disruptions.

How Oncology Providers Could Navigate Treatment Optimization?

  • Evidence-Based Protocols: Implement systematic risk assessment tools identifying patients requiring G-CSF prophylaxis, establish formulary pathways incorporating biosimilar options, and develop treatment algorithms supporting cost-effective supportive care decisions.
  • Quality Management: Execute comprehensive monitoring programs tracking neutrophil recovery patterns, adverse event surveillance systems, and outcome measurement initiatives validating prophylaxis program effectiveness.
  • Patient Education: Create awareness programs explaining neutropenia risks, G-CSF mechanism of action, and biosimilar equivalence concepts promoting treatment acceptance and medication adherence.
  • Cost Optimization: Evaluate biosimilar conversion opportunities within existing protocols, negotiate competitive pricing with pharmaceutical suppliers, and implement patient assistance program utilization maximizing treatment affordability.

How Payers Could Unlock Healthcare Value?

  • Formulary Management: Finance biosimilar pegfilgrastim inclusion in preferred medication tiers, develop value-based contracting arrangements with pharmaceutical manufacturers, and implement step therapy protocols promoting cost-effective treatment selection.
  • Market Access Innovation: Provide capital for specialty pharmacy network development, support patient assistance program infrastructure, and enable prior authorization process streamlining reducing administrative burden.
  • Outcomes Research: Back real-world evidence studies evaluating biosimilar effectiveness, health economic analyses quantifying cost savings, and quality metric development supporting value-based reimbursement models.
  • Healthcare System Integration: Support electronic prescribing system integration facilitating biosimilar prescribing, finance clinical decision support tool development, and enable data analytics platforms tracking utilization patterns and treatment outcomes.

Key Players in the Long-acting PEG-rhG-CSF Market

  • Amgen Inc.
  • Pfizer
  • Mylan
  • Sandoz (Novartis)
  • Biocon Biologics Inc.
  • Coherus BioSciences, Inc.
  • Fresenius Kabi
  • CSPC
  • Qilu Pharmaceutical
  • Jiangsu Hengrui Medicine

Scope of the Report

Item Value
Quantitative Units USD 3.4 billion
Drug Type Innovative Drugs, Generic Drugs, Others
Application Neoplastic Diseases, Blood Disorders, Others
Regions Covered Asia Pacific, Europe, North America, Latin America, Middle East & Africa
Country Covered China, India, Germany, Brazil, USA, UK, Japan, and 40+ countries
Key Companies Profiled Amgen Inc., Pfizer, Mylan, Sandoz (Novartis), Biocon Biologics Inc., Coherus BioSciences, Inc., Fresenius Kabi, CSPC, Qilu Pharmaceutical, Jiangsu Hengrui Medicine
Additional Attributes Dollar sales by drug type and application categories, regional adoption trends across Asia Pacific, Europe, and North America, competitive landscape with pharmaceutical manufacturers and biosimilar developers, healthcare facility requirements and specifications, integration with chemotherapy protocols and specialty pharmacy networks, innovations in pegylation technologies and biosimilar development platforms, and development of specialized formulations with enhanced pharmacokinetic profiles and patient convenience features.

Long-acting PEG-rhG-CSF Market by Segments

Drug Type:

  • Innovative Drugs
  • Generic Drugs
  • Others

Application:

  • Neoplastic Diseases
  • Blood Disorders
  • Others

Region:

  • Asia Pacific
    • China
    • India
    • Japan
    • South Korea
    • Australia & New Zealand
    • ASEAN
    • Rest of Asia Pacific
  • Europe
    • Germany
    • United Kingdom
    • France
    • Italy
    • Spain
    • Netherlands
    • Nordic
    • BENELUX
    • Rest of Europe
  • North America
    • United States
    • Canada
    • Mexico
  • Latin America
    • Brazil
    • Argentina
    • Rest of Latin America
  • Middle East & Africa
    • Kingdom of Saudi Arabia
    • Other GCC Countries
    • Turkey
    • South Africa
    • Other African Union
    • Rest of Middle East & Africa

Frequently Asked Questions

How big is the long-acting peg-rhg-csf market in 2025?

The global long-acting peg-rhg-csf market is estimated to be valued at USD 3.4 billion in 2025.

What will be the size of long-acting peg-rhg-csf market in 2035?

The market size for the long-acting peg-rhg-csf market is projected to reach USD 6.6 billion by 2035.

How much will be the long-acting peg-rhg-csf market growth between 2025 and 2035?

The long-acting peg-rhg-csf market is expected to grow at a 6.8% CAGR between 2025 and 2035.

What are the key product types in the long-acting peg-rhg-csf market?

The key product types in long-acting peg-rhg-csf market are innovative drugs, generic drugs and others.

Which application segment to contribute significant share in the long-acting peg-rhg-csf market in 2025?

In terms of application, neoplastic diseases segment to command 73.0% share in the long-acting peg-rhg-csf market in 2025.

Table of Content

  1. Executive Summary
    • Global Market Outlook
    • Demand to side Trends
    • Supply to side Trends
    • Technology Roadmap Analysis
    • Analysis and Recommendations
  2. Market Overview
    • Market Coverage / Taxonomy
    • Market Definition / Scope / Limitations
  3. Market Background
    • Market Dynamics
      • Drivers
      • Restraints
      • Opportunity
      • Trends
    • Scenario Forecast
      • Demand in Optimistic Scenario
      • Demand in Likely Scenario
      • Demand in Conservative Scenario
    • Opportunity Map Analysis
    • Product Life Cycle Analysis
    • Supply Chain Analysis
    • Investment Feasibility Matrix
    • Value Chain Analysis
    • PESTLE and Porter’s Analysis
    • Regulatory Landscape
    • Regional Parent Market Outlook
    • Production and Consumption Statistics
    • Import and Export Statistics
  4. Global Market Analysis 2020 to 2024 and Forecast, 2025 to 2035
    • Historical Market Size Value (USD Million) Analysis, 2020 to 2024
    • Current and Future Market Size Value (USD Million) Projections, 2025 to 2035
      • Y to o to Y Growth Trend Analysis
      • Absolute $ Opportunity Analysis
  5. Global Market Pricing Analysis 2020 to 2024 and Forecast 2025 to 2035
  6. Global Market Analysis 2020 to 2024 and Forecast 2025 to 2035, By Drug Type
    • Introduction / Key Findings
    • Historical Market Size Value (USD Million) Analysis By Drug Type , 2020 to 2024
    • Current and Future Market Size Value (USD Million) Analysis and Forecast By Drug Type , 2025 to 2035
      • Innovative Drugs
      • Generic Drugs
      • Others
    • Y to o to Y Growth Trend Analysis By Drug Type , 2020 to 2024
    • Absolute $ Opportunity Analysis By Drug Type , 2025 to 2035
  7. Global Market Analysis 2020 to 2024 and Forecast 2025 to 2035, By Application
    • Introduction / Key Findings
    • Historical Market Size Value (USD Million) Analysis By Application, 2020 to 2024
    • Current and Future Market Size Value (USD Million) Analysis and Forecast By Application, 2025 to 2035
      • Neoplastic Diseases
      • Blood Disorders
      • Others
    • Y to o to Y Growth Trend Analysis By Application, 2020 to 2024
    • Absolute $ Opportunity Analysis By Application, 2025 to 2035
  8. Global Market Analysis 2020 to 2024 and Forecast 2025 to 2035, By Region
    • Introduction
    • Historical Market Size Value (USD Million) Analysis By Region, 2020 to 2024
    • Current Market Size Value (USD Million) Analysis and Forecast By Region, 2025 to 2035
      • North America
      • Latin America
      • Western Europe
      • Eastern Europe
      • East Asia
      • South Asia and Pacific
      • Middle East & Africa
    • Market Attractiveness Analysis By Region
  9. North America Market Analysis 2020 to 2024 and Forecast 2025 to 2035, By Country
    • Historical Market Size Value (USD Million) Trend Analysis By Market Taxonomy, 2020 to 2024
    • Market Size Value (USD Million) Forecast By Market Taxonomy, 2025 to 2035
      • By Country
        • USA
        • Canada
        • Mexico
      • By Drug Type
      • By Application
    • Market Attractiveness Analysis
      • By Country
      • By Drug Type
      • By Application
    • Key Takeaways
  10. Latin America Market Analysis 2020 to 2024 and Forecast 2025 to 2035, By Country
    • Historical Market Size Value (USD Million) Trend Analysis By Market Taxonomy, 2020 to 2024
    • Market Size Value (USD Million) Forecast By Market Taxonomy, 2025 to 2035
      • By Country
        • Brazil
        • Chile
        • Rest of Latin America
      • By Drug Type
      • By Application
    • Market Attractiveness Analysis
      • By Country
      • By Drug Type
      • By Application
    • Key Takeaways
  11. Western Europe Market Analysis 2020 to 2024 and Forecast 2025 to 2035, By Country
    • Historical Market Size Value (USD Million) Trend Analysis By Market Taxonomy, 2020 to 2024
    • Market Size Value (USD Million) Forecast By Market Taxonomy, 2025 to 2035
      • By Country
        • Germany
        • UK
        • Italy
        • Spain
        • France
        • Nordic
        • BENELUX
        • Rest of Western Europe
      • By Drug Type
      • By Application
    • Market Attractiveness Analysis
      • By Country
      • By Drug Type
      • By Application
    • Key Takeaways
  12. Eastern Europe Market Analysis 2020 to 2024 and Forecast 2025 to 2035, By Country
    • Historical Market Size Value (USD Million) Trend Analysis By Market Taxonomy, 2020 to 2024
    • Market Size Value (USD Million) Forecast By Market Taxonomy, 2025 to 2035
      • By Country
        • Russia
        • Poland
        • Hungary
        • Balkan & Baltic
        • Rest of Eastern Europe
      • By Drug Type
      • By Application
    • Market Attractiveness Analysis
      • By Country
      • By Drug Type
      • By Application
    • Key Takeaways
  13. East Asia Market Analysis 2020 to 2024 and Forecast 2025 to 2035, By Country
    • Historical Market Size Value (USD Million) Trend Analysis By Market Taxonomy, 2020 to 2024
    • Market Size Value (USD Million) Forecast By Market Taxonomy, 2025 to 2035
      • By Country
        • China
        • Japan
        • South Korea
      • By Drug Type
      • By Application
    • Market Attractiveness Analysis
      • By Country
      • By Drug Type
      • By Application
    • Key Takeaways
  14. South Asia and Pacific Market Analysis 2020 to 2024 and Forecast 2025 to 2035, By Country
    • Historical Market Size Value (USD Million) Trend Analysis By Market Taxonomy, 2020 to 2024
    • Market Size Value (USD Million) Forecast By Market Taxonomy, 2025 to 2035
      • By Country
        • India
        • ASEAN
        • Australia & New Zealand
        • Rest of South Asia and Pacific
      • By Drug Type
      • By Application
    • Market Attractiveness Analysis
      • By Country
      • By Drug Type
      • By Application
    • Key Takeaways
  15. Middle East & Africa Market Analysis 2020 to 2024 and Forecast 2025 to 2035, By Country
    • Historical Market Size Value (USD Million) Trend Analysis By Market Taxonomy, 2020 to 2024
    • Market Size Value (USD Million) Forecast By Market Taxonomy, 2025 to 2035
      • By Country
        • Kingdom of Saudi Arabia
        • Other GCC Countries
        • Turkiye
        • South Africa
        • Other African Union
        • Rest of Middle East & Africa
      • By Drug Type
      • By Application
    • Market Attractiveness Analysis
      • By Country
      • By Drug Type
      • By Application
    • Key Takeaways
  16. Key Countries Market Analysis
    • USA
      • Pricing Analysis
      • Market Share Analysis, 2024
        • By Drug Type
        • By Application
    • Canada
      • Pricing Analysis
      • Market Share Analysis, 2024
        • By Drug Type
        • By Application
    • Mexico
      • Pricing Analysis
      • Market Share Analysis, 2024
        • By Drug Type
        • By Application
    • Brazil
      • Pricing Analysis
      • Market Share Analysis, 2024
        • By Drug Type
        • By Application
    • Chile
      • Pricing Analysis
      • Market Share Analysis, 2024
        • By Drug Type
        • By Application
    • Germany
      • Pricing Analysis
      • Market Share Analysis, 2024
        • By Drug Type
        • By Application
    • UK
      • Pricing Analysis
      • Market Share Analysis, 2024
        • By Drug Type
        • By Application
    • Italy
      • Pricing Analysis
      • Market Share Analysis, 2024
        • By Drug Type
        • By Application
    • Spain
      • Pricing Analysis
      • Market Share Analysis, 2024
        • By Drug Type
        • By Application
    • France
      • Pricing Analysis
      • Market Share Analysis, 2024
        • By Drug Type
        • By Application
    • India
      • Pricing Analysis
      • Market Share Analysis, 2024
        • By Drug Type
        • By Application
    • ASEAN
      • Pricing Analysis
      • Market Share Analysis, 2024
        • By Drug Type
        • By Application
    • Australia & New Zealand
      • Pricing Analysis
      • Market Share Analysis, 2024
        • By Drug Type
        • By Application
    • China
      • Pricing Analysis
      • Market Share Analysis, 2024
        • By Drug Type
        • By Application
    • Japan
      • Pricing Analysis
      • Market Share Analysis, 2024
        • By Drug Type
        • By Application
    • South Korea
      • Pricing Analysis
      • Market Share Analysis, 2024
        • By Drug Type
        • By Application
    • Russia
      • Pricing Analysis
      • Market Share Analysis, 2024
        • By Drug Type
        • By Application
    • Poland
      • Pricing Analysis
      • Market Share Analysis, 2024
        • By Drug Type
        • By Application
    • Hungary
      • Pricing Analysis
      • Market Share Analysis, 2024
        • By Drug Type
        • By Application
    • Kingdom of Saudi Arabia
      • Pricing Analysis
      • Market Share Analysis, 2024
        • By Drug Type
        • By Application
    • Turkiye
      • Pricing Analysis
      • Market Share Analysis, 2024
        • By Drug Type
        • By Application
    • South Africa
      • Pricing Analysis
      • Market Share Analysis, 2024
        • By Drug Type
        • By Application
  17. Market Structure Analysis
    • Competition Dashboard
    • Competition Benchmarking
    • Market Share Analysis of Top Players
      • By Regional
      • By Drug Type
      • By Application
  18. Competition Analysis
    • Competition Deep Dive
      • Amgen Inc.
        • Overview
        • Product Portfolio
        • Profitability by Market Segments (Product/Age /Sales Channel/Region)
        • Sales Footprint
        • Strategy Overview
          • Marketing Strategy
          • Product Strategy
          • Channel Strategy
      • Pfizer
      • Mylan
      • Sandoz (Novartis)
      • Biocon Biologics Inc.
      • Coherus BioSciences, Inc.
      • Fresenius Kabi
      • CSPC
      • Qilu Pharmaceutical
      • Jiangsu Hengrui Medicine
  19. Assumptions & Acronyms Used
  20. Research Methodology

List of Tables

  • Table 1: Global Market Value (USD Million) Forecast by Region, 2020 to 2035
  • Table 2: Global Market Value (USD Million) Forecast by Drug Type , 2020 to 2035
  • Table 3: Global Market Value (USD Million) Forecast by Application, 2020 to 2035
  • Table 4: North America Market Value (USD Million) Forecast by Country, 2020 to 2035
  • Table 5: North America Market Value (USD Million) Forecast by Drug Type , 2020 to 2035
  • Table 6: North America Market Value (USD Million) Forecast by Application, 2020 to 2035
  • Table 7: Latin America Market Value (USD Million) Forecast by Country, 2020 to 2035
  • Table 8: Latin America Market Value (USD Million) Forecast by Drug Type , 2020 to 2035
  • Table 9: Latin America Market Value (USD Million) Forecast by Application, 2020 to 2035
  • Table 10: Western Europe Market Value (USD Million) Forecast by Country, 2020 to 2035
  • Table 11: Western Europe Market Value (USD Million) Forecast by Drug Type , 2020 to 2035
  • Table 12: Western Europe Market Value (USD Million) Forecast by Application, 2020 to 2035
  • Table 13: Eastern Europe Market Value (USD Million) Forecast by Country, 2020 to 2035
  • Table 14: Eastern Europe Market Value (USD Million) Forecast by Drug Type , 2020 to 2035
  • Table 15: Eastern Europe Market Value (USD Million) Forecast by Application, 2020 to 2035
  • Table 16: East Asia Market Value (USD Million) Forecast by Country, 2020 to 2035
  • Table 17: East Asia Market Value (USD Million) Forecast by Drug Type , 2020 to 2035
  • Table 18: East Asia Market Value (USD Million) Forecast by Application, 2020 to 2035
  • Table 19: South Asia and Pacific Market Value (USD Million) Forecast by Country, 2020 to 2035
  • Table 20: South Asia and Pacific Market Value (USD Million) Forecast by Drug Type , 2020 to 2035
  • Table 21: South Asia and Pacific Market Value (USD Million) Forecast by Application, 2020 to 2035
  • Table 22: Middle East & Africa Market Value (USD Million) Forecast by Country, 2020 to 2035
  • Table 23: Middle East & Africa Market Value (USD Million) Forecast by Drug Type , 2020 to 2035
  • Table 24: Middle East & Africa Market Value (USD Million) Forecast by Application, 2020 to 2035

List of Figures

  • Figure 1: Global Market Pricing Analysis
  • Figure 2: Global Market Value (USD Million) Forecast 2020-2035
  • Figure 3: Global Market Value Share and BPS Analysis by Drug Type , 2025 and 2035
  • Figure 4: Global Market Y to o to Y Growth Comparison by Drug Type , 2025-2035
  • Figure 5: Global Market Attractiveness Analysis by Drug Type
  • Figure 6: Global Market Value Share and BPS Analysis by Application, 2025 and 2035
  • Figure 7: Global Market Y to o to Y Growth Comparison by Application, 2025-2035
  • Figure 8: Global Market Attractiveness Analysis by Application
  • Figure 9: Global Market Value (USD Million) Share and BPS Analysis by Region, 2025 and 2035
  • Figure 10: Global Market Y to o to Y Growth Comparison by Region, 2025-2035
  • Figure 11: Global Market Attractiveness Analysis by Region
  • Figure 12: North America Market Incremental Dollar Opportunity, 2025-2035
  • Figure 13: Latin America Market Incremental Dollar Opportunity, 2025-2035
  • Figure 14: Western Europe Market Incremental Dollar Opportunity, 2025-2035
  • Figure 15: Eastern Europe Market Incremental Dollar Opportunity, 2025-2035
  • Figure 16: East Asia Market Incremental Dollar Opportunity, 2025-2035
  • Figure 17: South Asia and Pacific Market Incremental Dollar Opportunity, 2025-2035
  • Figure 18: Middle East & Africa Market Incremental Dollar Opportunity, 2025-2035
  • Figure 19: North America Market Value Share and BPS Analysis by Country, 2025 and 2035
  • Figure 20: North America Market Value Share and BPS Analysis by Drug Type , 2025 and 2035
  • Figure 21: North America Market Y to o to Y Growth Comparison by Drug Type , 2025-2035
  • Figure 22: North America Market Attractiveness Analysis by Drug Type
  • Figure 23: North America Market Value Share and BPS Analysis by Application, 2025 and 2035
  • Figure 24: North America Market Y to o to Y Growth Comparison by Application, 2025-2035
  • Figure 25: North America Market Attractiveness Analysis by Application
  • Figure 26: Latin America Market Value Share and BPS Analysis by Country, 2025 and 2035
  • Figure 27: Latin America Market Value Share and BPS Analysis by Drug Type , 2025 and 2035
  • Figure 28: Latin America Market Y to o to Y Growth Comparison by Drug Type , 2025-2035
  • Figure 29: Latin America Market Attractiveness Analysis by Drug Type
  • Figure 30: Latin America Market Value Share and BPS Analysis by Application, 2025 and 2035
  • Figure 31: Latin America Market Y to o to Y Growth Comparison by Application, 2025-2035
  • Figure 32: Latin America Market Attractiveness Analysis by Application
  • Figure 33: Western Europe Market Value Share and BPS Analysis by Country, 2025 and 2035
  • Figure 34: Western Europe Market Value Share and BPS Analysis by Drug Type , 2025 and 2035
  • Figure 35: Western Europe Market Y to o to Y Growth Comparison by Drug Type , 2025-2035
  • Figure 36: Western Europe Market Attractiveness Analysis by Drug Type
  • Figure 37: Western Europe Market Value Share and BPS Analysis by Application, 2025 and 2035
  • Figure 38: Western Europe Market Y to o to Y Growth Comparison by Application, 2025-2035
  • Figure 39: Western Europe Market Attractiveness Analysis by Application
  • Figure 40: Eastern Europe Market Value Share and BPS Analysis by Country, 2025 and 2035
  • Figure 41: Eastern Europe Market Value Share and BPS Analysis by Drug Type , 2025 and 2035
  • Figure 42: Eastern Europe Market Y to o to Y Growth Comparison by Drug Type , 2025-2035
  • Figure 43: Eastern Europe Market Attractiveness Analysis by Drug Type
  • Figure 44: Eastern Europe Market Value Share and BPS Analysis by Application, 2025 and 2035
  • Figure 45: Eastern Europe Market Y to o to Y Growth Comparison by Application, 2025-2035
  • Figure 46: Eastern Europe Market Attractiveness Analysis by Application
  • Figure 47: East Asia Market Value Share and BPS Analysis by Country, 2025 and 2035
  • Figure 48: East Asia Market Value Share and BPS Analysis by Drug Type , 2025 and 2035
  • Figure 49: East Asia Market Y to o to Y Growth Comparison by Drug Type , 2025-2035
  • Figure 50: East Asia Market Attractiveness Analysis by Drug Type
  • Figure 51: East Asia Market Value Share and BPS Analysis by Application, 2025 and 2035
  • Figure 52: East Asia Market Y to o to Y Growth Comparison by Application, 2025-2035
  • Figure 53: East Asia Market Attractiveness Analysis by Application
  • Figure 54: South Asia and Pacific Market Value Share and BPS Analysis by Country, 2025 and 2035
  • Figure 55: South Asia and Pacific Market Value Share and BPS Analysis by Drug Type , 2025 and 2035
  • Figure 56: South Asia and Pacific Market Y to o to Y Growth Comparison by Drug Type , 2025-2035
  • Figure 57: South Asia and Pacific Market Attractiveness Analysis by Drug Type
  • Figure 58: South Asia and Pacific Market Value Share and BPS Analysis by Application, 2025 and 2035
  • Figure 59: South Asia and Pacific Market Y to o to Y Growth Comparison by Application, 2025-2035
  • Figure 60: South Asia and Pacific Market Attractiveness Analysis by Application
  • Figure 61: Middle East & Africa Market Value Share and BPS Analysis by Country, 2025 and 2035
  • Figure 62: Middle East & Africa Market Value Share and BPS Analysis by Drug Type , 2025 and 2035
  • Figure 63: Middle East & Africa Market Y to o to Y Growth Comparison by Drug Type , 2025-2035
  • Figure 64: Middle East & Africa Market Attractiveness Analysis by Drug Type
  • Figure 65: Middle East & Africa Market Value Share and BPS Analysis by Application, 2025 and 2035
  • Figure 66: Middle East & Africa Market Y to o to Y Growth Comparison by Application, 2025-2035
  • Figure 67: Middle East & Africa Market Attractiveness Analysis by Application
  • Figure 68: Global Market - Tier Structure Analysis
  • Figure 69: Global Market - Company Share Analysis
Dashboard
Dashboard
Dashboard
Dashboard
Dashboard
Dashboard

Full Research Suite comprises of:

Market outlook & trends analysis

Market outlook & trends analysis

Interviews & case studies

Interviews & case studies

Strategic recommendations

Strategic recommendations

Vendor profiles & capabilities analysis

Vendor profiles & capabilities analysis

5-year forecasts

5-year forecasts

8 regions and 60+ country-level data splits

8 regions and 60+ country-level data splits

Market segment data splits

Market segment data splits

12 months of continuous data updates

12 months of continuous data updates

DELIVERED AS:

PDF EXCEL ONLINE

Full Research Suite


$5000

$7500

$10000

Buy Report Now
Future Market Insights

Long-acting PEG-rhG-CSF Market

Chat With MaRIA

Chat With

MaRIA

Hi There, I am MaRIA, Your Market Research Intelligence Assistant. How may I help you?