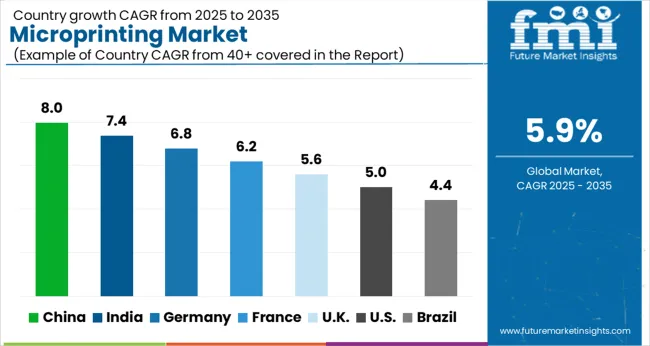
The microprinting market is estimated to be valued at USD 872.9 million in 2025 and is projected to reach USD 1548.5 million by 2035, registering a compound annual growth rate (CAGR) of 5.9% over the forecast period.
Security printing operations require specialized lithographic equipment, precision registration systems, and quality control mechanisms that ensure consistent microtext reproduction at resolutions below 200 micrometers. Production coordination involves managing substrate specifications, ink formulations, and printing plate preparation while maintaining environmental controls that prevent contamination during high-security document manufacturing. Equipment procurement decisions balance initial capital investment against security effectiveness metrics including detection difficulty, reproduction resistance, and integration compatibility with existing document authentication systems.
Manufacturing processes encompass intaglio printing techniques, laser engraving systems, and digital security integration that create multi-layered authentication features combining microprinting with holographic elements, security threads, and chemical-reactive inks. Quality assurance protocols address microscopic inspection procedures, optical verification testing, and authentication system validation that ensure security feature effectiveness while maintaining production efficiency requirements. Cross-functional coordination involves security specialists, printing technicians, and quality control officers collaborating to optimize microprinting placement, text content, and readability characteristics that balance security objectives with document functionality requirements.
Technology advancement focuses on laser-based microprinting systems, digital integration capabilities, and automated inspection technologies that improve production precision while reducing manufacturing costs. Equipment manufacturers develop hybrid systems combining conventional security printing with digital microprinting that accommodate variable data requirements including serial numbers, batch codes, and personalized authentication elements. Control systems incorporate vision inspection, measurement verification, and statistical process monitoring that detect production variations while maintaining consistent security feature quality across extended production runs.
Application diversification encompasses currency production, passport manufacturing, certificate authentication, and brand protection programs that utilize microprinting as primary or secondary security features. Pharmaceutical companies implement microprinting on packaging materials, labels, and blister packs to combat counterfeit medications while maintaining regulatory compliance and patient safety objectives. Luxury goods manufacturers integrate microprinting with traditional authentication methods including holograms, RFID tags, and blockchain verification systems that provide comprehensive anti-counterfeiting protection throughout distribution channels.
Service provider relationships involve coordination between security printing companies, equipment manufacturers, and authentication technology developers to establish integrated solutions that address customer-specific security requirements. Contract negotiations address confidentiality provisions, security clearance requirements, and intellectual property protection while ensuring production capacity and delivery scheduling that support customer authentication program implementation. Partnership development includes collaboration with substrate suppliers, specialty ink manufacturers, and verification equipment providers to deliver comprehensive microprinting solutions that maintain security effectiveness while optimizing production costs.
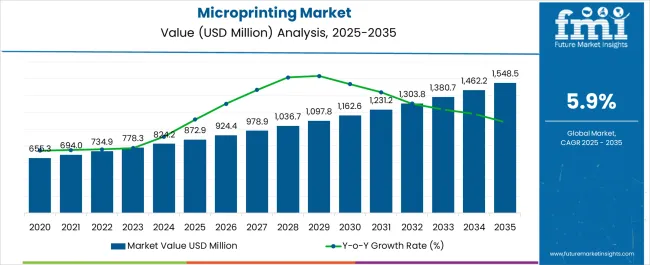
| Metric | Value |
|---|---|
| Microprinting Market Estimated Value in (2025 E) | USD 872.9 million |
| Microprinting Market Forecast Value in (2035 F) | USD 1548.5 million |
| Forecast CAGR (2025 to 2035) | 5.9% |
The microprinting market is gaining traction due to the rising need for advanced security features in financial documents, identity cards, and branded packaging. Growing incidents of counterfeiting and forgery across sectors such as banking, government, and consumer goods have accelerated the adoption of microprinting technologies.
Innovations in specialized inks, precision printing equipment, and embossing techniques are further supporting expansion. Regulatory frameworks aimed at enhancing document security and protecting intellectual property are also reinforcing market adoption.
The outlook remains positive as industries increasingly prioritize authenticity verification, anti-counterfeiting safeguards, and brand protection measures, making microprinting an indispensable part of modern security and authentication systems.
The market is segmented by Type, Ink Type, Print Type, and Application and region. By Type, the market is divided into Monochrome and Color. In terms of Ink Type, the market is classified into Micro-Embossing, Special Inks, Magnetic Inks, UV Invisible Inks, and Infrared Ink Markings. Based on Print Type, the market is segmented into Single-sided and Double-sided. By Application, the market is divided into Currency, Stamps, Bank Checks, Labels, ID and Payment Cards, Documents, and Others. Regionally, the market is classified into North America, Latin America, Western Europe, Eastern Europe, Balkan & Baltic Countries, Russia & Belarus, Central Asia, East Asia, South Asia & Pacific, and the Middle East & Africa.
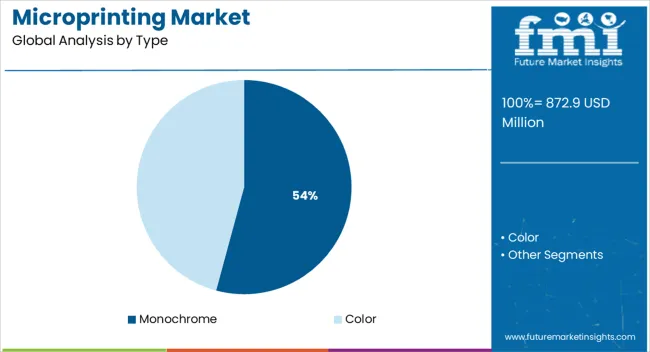
The monochrome ink type segment is expected to contribute 54.20% of total market revenue by 2025, positioning it as the leading ink category. Its dominance is attributed to cost effectiveness, ease of integration, and suitability for high precision security applications.
Monochrome printing allows clear contrast and high readability of microtext, enhancing authentication accuracy. The technology’s compatibility with a wide range of substrates and its ability to support long production runs without compromising detail make it a preferred choice.
The balance of affordability and functionality has reinforced its widespread adoption, establishing it as the leading ink type in the microprinting market.
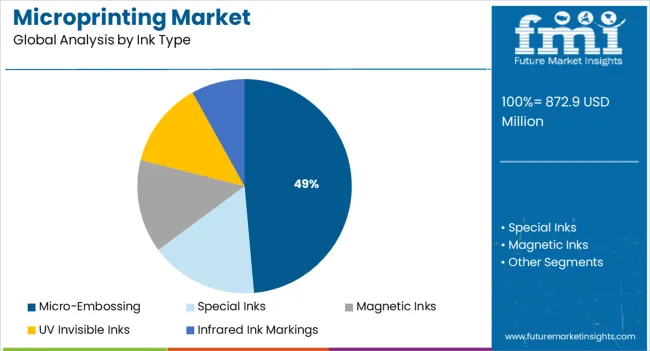
The micro-embossing print type segment is projected to hold 48.60% of total revenue by 2025 within the print type category, making it the dominant segment. This position is driven by its ability to deliver intricate, durable, and tamper resistant patterns that are difficult to replicate.
Micro-embossing provides an added layer of security for high value documents and branded packaging, making counterfeiting significantly harder. Additionally, the method enhances tactile and visual authenticity, enabling quick verification without advanced tools.
Its integration into secure printing processes has strengthened its adoption, positioning micro-embossing as a core solution in document and product security.
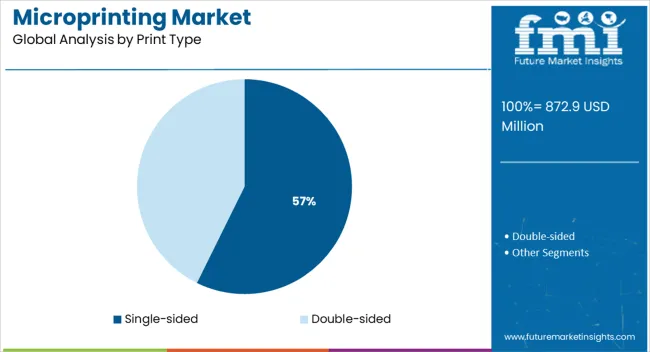
The single-sided print segment is forecasted to account for 57.30% of total market revenue by 2025 under the print segment, establishing it as the most prominent format. This growth is attributed to cost efficiency, faster production cycles, and reduced material consumption, which make it highly attractive for large scale security printing applications.
Single-sided microprinting is extensively applied in financial instruments, ID cards, and government documents, where concise yet secure features are required. The method’s simplicity, combined with its effectiveness in deterring fraud, has reinforced its strong market position.
As organizations continue to balance security needs with budget efficiency, single-sided printing remains the preferred option across diverse end use applications.
The microprinted text and photographs appear as small dots or solid lines on simple scanners when trying to photocopy the microprinted papers, money, ID cards, etc., prohibiting the possibility of fraudulent actions.
Even though it is difficult to copy using common digital techniques, microprinting technology is often employed as an anti-counterfeiting approach. This is resulting in escalated microprinting market adoption trends.
Demand for microprinting is anticipated to increase at 5.9% CAGR between 2025 and 2035, compared to a 2.8% CAGR seen during the historical period (2020 to 2025).
The microprinting procedure has gained widespread acceptance across several industries, particularly for enhancing the security of employee ID cards and driver's licenses, which is driving market expansion for microprinting. Both currency and stamps are expanding the market.
The microprinting sector is expanding as a result of numerous government initiatives and organizations that aim to increase the security of money and certificates. Additionally, improvements in inventive microprinting together with low-cost methods have improved their progress in several industries. These elements are poised to probably accelerate microprinting market expansion.
The majority of government organizations are increasing security features on identification cards, documents, and other security equipment with the aid of microprinting, which is projected to support the growth of the microprinting market as a whole.
The total market is growing as a result of the escalating check and currency fraud in various countries. To combat fraud and license and identity card misuse, governments and corporate bodies have embraced the microprinting procedure. As a result, the market for microprinting has experienced substantial growth.
The market is growing as a result of technological developments like the invention of magnetic ink and other specialized inks.
Market growth has been severely impacted by the digitalization of documents to reduce the use of paper. Environmental protection is a responsibility that a lot of corporate businesses are taking on. These businesses have heavily used digital wallets and are digitizing their records. The market's expansion is being constrained by several issues.
The use of magnetic ink to print texts or images and issues with MICR readers are predicted to impede the microprinting industry's overall growth. A potential obstacle to the market's expansion is being projected by the flaw in their mechanism.
The limitations of microprinting needles and the high cost of printer production provide difficulties for the overall microprinting market expansion.
| Attribute | Details |
|---|---|
| Monochrome Segment Share | 60% |
Between 2025 and 2035, the monochrome category is expected to control over 60% of the microprinting market share. Monochrome printing is frequently used in the government, retail, education, commercial, and publishing industries due to its many benefits, including its lower cost per printed page, quick printing speed, and increased text quality.
Increased monochrome printing for labeling and packing of online orders is anticipated to drive growth in the e-commerce sector. Monochrome printing is widely used by leading e-commerce giants, such as Amazon Inc., Walmart, Alibaba Group, and eBay. Since it makes it simpler for them to trace parcels throughout the delivery process, these businesses are doing a lot of work in tagging products with digital technology.
Throughout the forecast period, it is anticipated that the color category would expand at a sizable CAGR. The microprinting market is growing as a result of an increase in demand for color microprinted documents from several end-use sectors, including banking and finance, government, corporate, packaging, healthcare, and education.
The popularity of color microprinting is also rising as a result of people's growing awareness of document security issues. For instance, numerous banks throughout the world now distribute colored microprinted statements to distinguish between distinct components of the information.
| Attribute | Details |
|---|---|
| Magnetic Inks Segment Share | 33% |
By obtaining the lion's share of more than 33% between 2025 and 2035, the magnetic inks category is expected to lead the microprinting market. Given the security services needed as a result of technical and digital advancements to decrease fraud in banking operations, transaction processes, etc., the magnetic ink segment is predicted to rise at a considerable CAGR over the projected period.
In order for the information to be read when the cards were placed into cash dispensers, the bank, for example, printed debit cards, bonds, and credit cards using magnetic ink. The expanding use of Magnetic Ink Character Recognition (MICR), which assists in document authenticity analysis, also contributes to the growth of the magnetic ink sector.
During the projection period, it is expected that the UV invisible inks market would expand at a strong CAGR. Since they are necessary for microprinting money and stamps, a commonly used method to thwart counterfeiting, UV invisible inks have seen tremendous growth in recent years. The consistent growth of printing on bank papers, stamps, and coins has aided in the explosive growth of UV and infrared ink microprinting.
| Attribute | Details |
|---|---|
| Labels Segment Share | 24% |
The forecast period is expected to have a robust CAGR growth in the currency segment. Legal tender issuers across the globe have been compelled to improve the security features of their money due to growing worries about counterfeit currency. The increase is linked to the government's use of microprinting to produce more notes.
Currency notes that have microprinting are challenging to forge since photocopiers alone are unable to precisely recreate the print. Governments all across the world are using the microprinting process to prevent the creation of counterfeit money, which is helping the industry to flourish.
With an estimated 24% revenue share throughout the projection period, the labels category is projected to dominate the microprinting market as a whole. Security labeling not only helps buyers verify the authenticity of items, but it also protects the company's reputation, minimizes the likelihood of lost sales, and decreases liability issues. Security labels can be used to monitor the movement of products across the supply chain.
The key drivers of market expansion are the expansion of the consumer electronics, fashion, and e-commerce sectors because labels include vital information regarding a product's warranty and manufacturing date.
| Attribute | Details |
|---|---|
| United States Market Share | 12.5% |
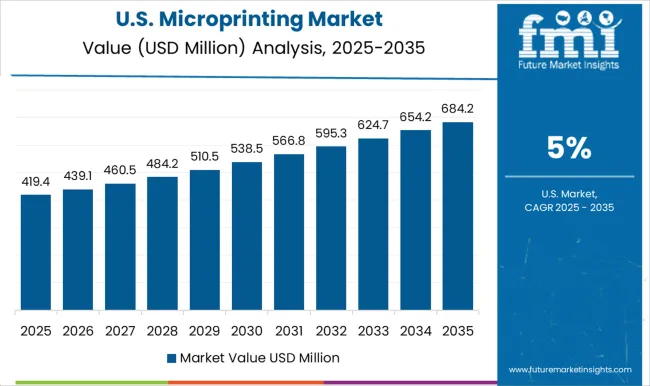
Throughout the projected period, it is expected that the United States is poised to continue to be the most alluring microprinting market. The study predicts that the United States microprinting market is poised to hold close to a 12.5% market share in the entire North American region.
Due to the abundance of banks, government financial institutions, and corporate organizations in the United States, the use of printers based on microprinting technology has grown. The microprinting market is anticipated to grow rapidly in the United States due to increased development activities and strong economic expansion.
The expansion of the e-commerce industry, the development of microprinting technology in the BFSI sector, and standards and regulations in the banking sector are the main drivers of the United States market.
| Attribute | Details |
|---|---|
| China Market Share | 17.8% |
The microprinting market in China had the leading share of 17.8% during the forecast period. This is because China has a vast population and a growing e-commerce industry, both of which emphasize the risk of fraud and the entrance of counterfeit money. These elements are causing the microprinting business in China to flourish.
Microprinting technologies for labeling goods and their packaging are predicted to become popular as a result of rising consumer electronics sales in China and exports to other nations. These systems are also widely used by China's established banking industry to check book design and currency printing.
| Attribute | Details |
|---|---|
| India Market Share | 10.4% |
During the forecast period, the microprinting market in India is anticipated to develop at a robust CAGR of 10.4%. Due to the rising demand for microprinting on official documents from the government, including ID cards, licenses, and passports.
The demand for microprinting to stop fraud and the introduction of counterfeit cash in banks, financial institutions, governmental organizations, and enterprises are expanding, which is driving up demand in India.
The need for microprinting equipment has increased due to an increase in financial fraud activities involving counterfeit money, which is anticipated to create attractive growth prospects for the Indian microprinting industry.

The microprinting market is experiencing growth due to its critical role in enhancing security, anti-counterfeiting measures, and improving brand protection across industries such as packaging, pharmaceuticals, and government documents. Leading companies in the market include Xerox Corporation, Brady Worldwide Inc., HP Development Company L.P., Zebra Technologies Corp., Videojet Technologies Inc., Canon Inc., Ricoh Company Ltd., Huber Group, Matica Technologies Group S.A., and Domino Printing Sciences PLC, each offering advanced microprinting technologies for a variety of applications.
Xerox Corporation and HP Development Company are leaders in digital printing solutions, providing microprinting capabilities for secure document and label printing, especially in industries requiring high-level security. Brady Worldwide Inc. focuses on microprinted labels for industrial and safety applications, ensuring durability and compliance with regulatory standards.
Zebra Technologies and Videojet Technologies specialize in printing solutions for inventory management and tracking, with microprinting enhancing barcode and serial number security. Canon Inc. and Ricoh Company Ltd. provide cutting-edge microprinting technologies for office and production environments, contributing to enhanced security features for documents and packaging. Matica Technologies Group and Domino Printing Sciences offer microprinting solutions for identification and traceability, serving sectors such as banking, retail, and pharmaceuticals. Huber Group provides printing inks for high-precision microprinting applications, ensuring high-quality, durable marks.
The global microprinting market is estimated to be valued at USD 872.9 million in 2025.
The market size for the microprinting market is projected to reach USD 1,548.5 million by 2035.
The microprinting market is expected to grow at a 5.9% CAGR between 2025 and 2035.
The key product types in microprinting market are monochrome and color.
In terms of ink type, micro-embossing segment to command 48.6% share in the microprinting market in 2025.


Full Research Suite comprises of:
Market outlook & trends analysis
Interviews & case studies
Strategic recommendations
Vendor profiles & capabilities analysis
5-year forecasts
8 regions and 60+ country-level data splits
Market segment data splits
12 months of continuous data updates
DELIVERED AS:
PDF EXCEL ONLINE

Thank you!
You will receive an email from our Business Development Manager. Please be sure to check your SPAM/JUNK folder too.
Chat With
MaRIA