
- Market Size (2026)
- USD 1076.2 Mn
- Forecast (2036)
- USD 5632.6 Mn
- CAGR (2026 to 2036)
- 18.0%
How big is the MRAM Market in 2026?
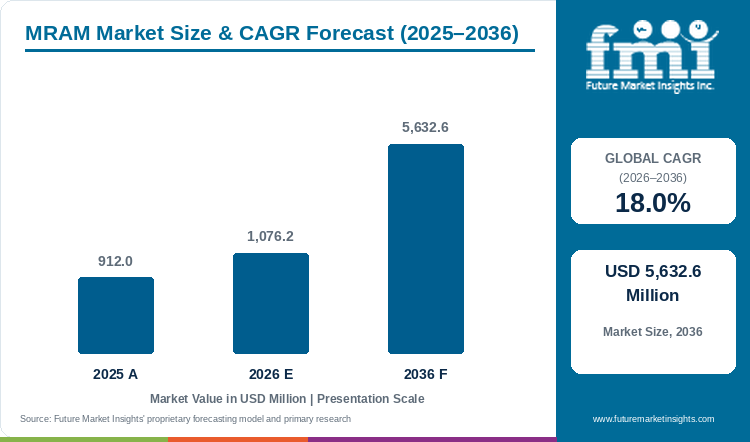
The global magnetoresistive random-access memory market is estimated at USD 1,076.2 million in 2026, compared with USD 912.0 million in 2025, and is forecast to reach USD 5,632.6 million by 2036, expanding at a CAGR of 18.0% from 2026 to 2036. FMI's 2026 assessment puts STT-MRAM at 52.0% by technology, medium-density MRAM at 45.0% by storage density and integrated MRAM in a system on chip at 58.0% by integration.
Demand for magnetoresistive random-access memory (MRAM) is supported by automotive and industrial manufacturers seeking qualified memory devices for applications requiring long-term reliability. Production qualification remains an important purchasing requirement because approval of one memory density does not automatically extend to other products. In March 2026, Everspin Technologies announced that its 64Mb xSPI STT-MRAM had completed AEC-Q100 Grade 1 production qualification and was available for high-volume orders through authorised distributors. The company also introduced a 256Mb variant, with qualification scheduled for July 2026, while its 128Mb product was targeting completion in May 2026. These separate qualification schedules influence when equipment manufacturers can approve individual components for commercial production. Customers developing long-life systems must therefore consider product readiness alongside memory capacity and performance.
Manufacturers are also expanding domestic production capabilities to support long-term supply commitments. In April 2026, Everspin signed an initial 10-year manufacturing agreement with Microchip Technology to establish additional MRAM production capacity at its Gresham facility in Oregon. The agreement covers 8-inch wafer manufacturing and involves approximately USD 14.0 million in anticipated setup-related expenditure. Everspin expects manufacturing capacity for STT-MRAM processes to become available approximately 30 months after the agreement date. The investment strengthens its ability to support customer programmes requiring dependable semiconductor supply over extended production periods.
Embedding memory in a wider chip opens another route into vehicle electronics. GlobalFoundries made its AutoPro150 eMRAM process available for prototyping in March 2026, with Dresden volume production scheduled for the second half of the year. TSMC's annual report separately records automotive-grade qualification of its second-generation 16nm MRAM in 2025. FMI expects these processes to broaden the design opportunities, while product orders remain tied to the customer's chip-development and production timetable.
Key Market Trends & Insights
- Everspin's 1Gb DDR4 product lists a 667MHz speed option and a 0°C to 85°C operating range. The buffer's performance must fit the system interface, while that particular temperature range sets a boundary on where the part can be used.
- Everspin's second-quarter 2026 release separates USD 15.3 million of MRAM product sales from total revenue of USD 18.7 million. Contract development can support a supplier's capability before it becomes repeat memory shipments, so buyers should examine the revenue mix.
- GlobalFoundries reports endurance up to 500,000 cycles and read speed below 10 nanoseconds for AutoPro150 eMRAM. These specifications give designers concrete operating targets to test within the wider chip, rather than a general promise of faster memory.
Regional Highlights
- North America combines a commercial discrete-memory supplier with funded process development. Everspin's August 2026 release identifies initial revenue from a USD 40 million development and validation contract for the US defence industrial base. This supports local capability but remains distinct from product shipments.
- East Asia offers foundry integration and a widening supplier base. TSMC records automotive qualification of 16nm embedded MRAM, while Shanghai Siproin publishes STT-MRAM products for industrial and related applications. Regional buyers can compare embedded design access with the purchase of a packaged memory device.
Table 1: MRAM Market Size and Forecast (USD million and CAGR percentage), 2025 to 2036
| Market size and forecast | Value |
|---|---|
| Market size in 2025 | USD 912.0 million |
| Estimated market size in 2026 | USD 1,076.2 million |
| Projected market size by 2036 | USD 5,632.6 million |
| CAGR from 2026 to 2036 | 18.0% |
| Added revenue from 2026 to 2036 | USD 4,556.4 million |
Source: Future Market Insights, MRAM Market Report, 2026 to 2036.
Analyst Perspective
“MRAM wins a design when the required data must survive power loss and the device passes that product's speed, endurance and temperature tests. A qualified foundry process and a qualified packaged chip should be reported separately.”
- Sudip Saha, Principal Consultant, FMI
How is the MRAM Market segmented?
- By Technology: STT-MRAM, toggle MRAM and other magnetoresistive memory.
- By Storage Density: Medium-density MRAM, low-density MRAM and high-density MRAM.
- By Integration: Integrated MRAM in a system on chip and standalone MRAM.
- By Application: Industrial controllers, automotive electronics, aerospace and defence, storage systems and other electronics.
- By Region: North America, Latin America, Western Europe, Eastern Europe, East Asia, South Asia and Pacific, and Middle East and Africa.
Why does STT-MRAM lead by technology?
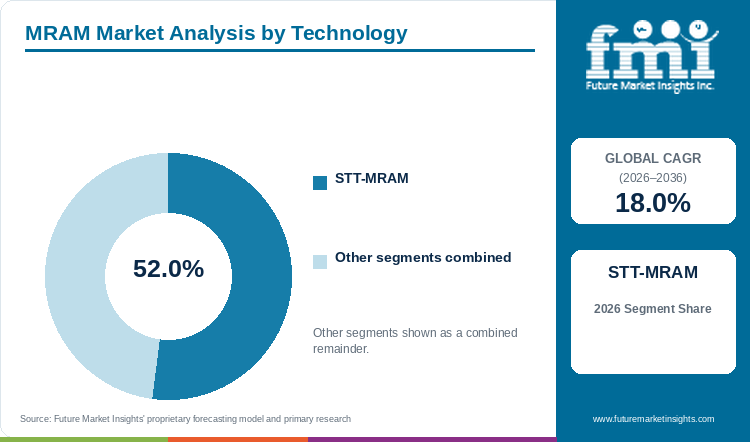
STT-MRAM holds 52.0% of the MRAM Market by technology in FMI's 2026 assessment.
The technology serves several design requirements, so its lead is broader than one device family. Everspin offers a 1Gb DDR4 product for persistent buffering, while its high-reliability xSPI family follows a separate qualification route for demanding applications. FMI finds that this gives suppliers more than one path into a customer's system: a high-density buffer and a memory used in a controller solve different engineering problems.
The shared technology does not make the products interchangeable. The DDR4 part's published operating range and interface are specific to that offer, and the automotive qualification announcement identifies the completed density explicitly. Customers must still check the part number, temperature grade, retention and interface needed in their design. Suppliers hold the commercial advantage when they can support that exact configuration through validation and repeat production orders.
Table 2: MRAM Market Technology Share Comparison, 2026
| Leading Share | 2026 market share |
|---|---|
| STT-MRAM | 52.0% |
| All Other Segments Combined Share | 48.0% |
Source: Future Market Insights, MRAM Market Report, 2026 to 2036.
Why is medium-density MRAM the largest storage-density category?
Medium-density MRAM holds 45.0% of the MRAM Market by storage density in FMI's 2026 assessment.
FMI finds that customers buy capacity to fit a defined data task. A controller that stores operating state does not necessarily need the capacity of an enterprise buffer. Extra capacity can add cost or change the device and qualification work without improving the customer's application. The medium-density category therefore has a broad commercial role between smaller configuration memories and high-capacity buffering products.
Everspin's March 2026 disclosure follows 64Mb, 128Mb and 256Mb qualification as separate milestones. The announcement supports the mechanism: a customer cannot assume that the next density is equally ready merely because the interface family is familiar. The report's density categories describe the market breakdown rather than a universal industry threshold. Product comparisons still need the actual bit capacity and specification. FMI expects suppliers to win orders by offering the required capacity with a completed qualification and a credible production schedule, while higher-density development opens additional designs over time.
Table 3: MRAM Market Storage Density Share Comparison, 2026
| Leading Share | 2026 market share |
|---|---|
| Medium-density MRAM | 45.0% |
| All Other Segments Combined Share | 55.0% |
Source: Future Market Insights, MRAM Market Report, 2026 to 2036.
What supports integrated MRAM as the leading integration approach?
Integrated MRAM in a system on chip holds 58.0% of the MRAM Market by integration in FMI's 2026 assessment.
Embedding persistent memory in the customer's chip allows a designer to plan the memory and logic together. The commercial commitment then takes place through a semiconductor design and foundry process, rather than simply ordering a separate memory package. GlobalFoundries supplies a process design kit for AutoPro150 eMRAM and announced prototyping access in March 2026. FMI finds that the design kit is an important entry point because the customer needs to build and verify the memory within the wider circuit.
Qualification remains specific to the process. TSMC records automotive-grade qualification of its 16nm MRAM in 2025, while GlobalFoundries' March release set a later production schedule for Dresden. These are different supplier programmes, not one interchangeable automotive approval. Standalone MRAM retains a separate role when a designer needs a packaged device on an existing board. The integrated lead therefore coexists with discrete-memory demand and does not establish a share for any individual foundry.
Table 4: MRAM Market Integration Share Comparison, 2026
| Leading Share | 2026 market share |
|---|---|
| Integrated MRAM in a system on chip | 58.0% |
| All Other Segments Combined Share | 42.0% |
Source: Future Market Insights, MRAM Market Report, 2026 to 2036.
What are the key drivers restraints and opportunities?
MRAM sales depend on the design work that turns data-persistence requirements into qualified devices. Product availability, operating limits and foundry access affect that process in different ways.
Driver
Customers need operating data to survive power interruptions without disrupting the next system start. Everspin's 2026 results identify strength in industrial automation, energy management, aerospace and defence. FMI finds that these applications support demand where the cost of losing the required state justifies a persistent-memory design.
Restraint
Qualification at one density or temperature grade does not clear the whole portfolio. Everspin's March 2026 roadmap puts the larger xSPI densities on separate schedules. Customers may therefore retain an existing memory design until the required replacement is validated, delaying sales despite progress elsewhere in the family.
Opportunity
Embedded memory can enter new automotive chips when a foundry provides a usable process and design support. GlobalFoundries' AutoPro150 prototyping announcement supports that opening, with volume production scheduled separately. FMI sees the opportunity in helping customers complete the wider chip design and its tests, rather than treating process availability as proof of vehicle shipments.
How do quality rules affect MRAM purchasing?
Automotive qualification narrows the list of devices a customer can consider, but the approval has a precise scope. Everspin identifies AEC-Q100 Grade 1 for its qualified 64Mb xSPI product. GlobalFoundries separately describes an automotive-ready embedded process for operation up to 150°C. FMI finds that purchasers need to match the device or process qualification to the intended duty, then complete their system-level approval. One supplier's announcement does not certify a different part or the customer's finished vehicle electronics.
What limits reliable MRAM operation and delivery?
The design must keep speed, retention and endurance within its operating conditions. CEA's SOT-MRAM research examines the effect of excessive write current, illustrating why an improved switching result needs a usable reliability window. Packaged products also impose practical interface and temperature limits: Everspin's 1Gb DDR4 offer publishes its own operating specification. FMI expects suppliers to provide evidence for the exact duty rather than transfer a laboratory result or a family-level claim across the product range.
Where can MRAM suppliers win additional business?
Suppliers can make it easier to adopt persistent memory in an existing controller or a new chip design. A standalone memory needs a compatible interface and long-term product support; an embedded customer needs design access and process documentation. GlobalFoundries' available design kit and Everspin's distributor-supported qualified 64Mb device show these distinct routes. FMI sees additional business where the supplier reduces the customer's integration work and supports a credible production date.
MRAM Market by Country (2026 to 2036)
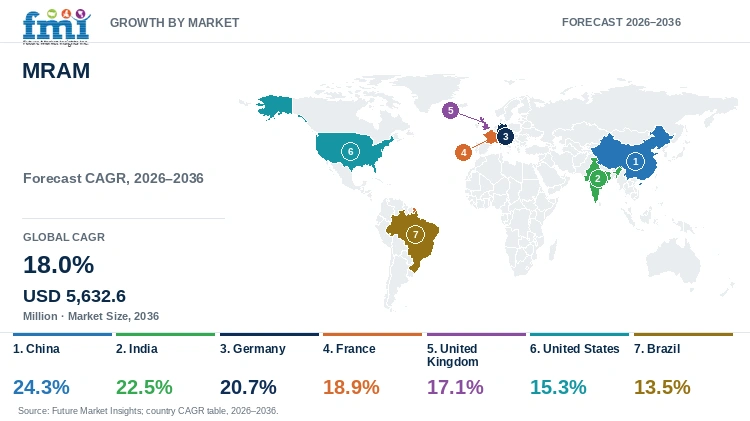
Table 5: MRAM Market Country CAGR Comparison, 2026 to 2036
| Country | CAGR |
|---|---|
| China | 24.3% |
| India | 22.5% |
| Germany | 20.7% |
| France | 18.9% |
| United Kingdom | 17.1% |
| United States | 15.3% |
| Brazil | 13.5% |
Source: Future Market Insights, MRAM Market Report, 2026 to 2036.
China
Shanghai Siproin's serial-interface STT-MRAM range gives Chinese equipment designers another part to evaluate for industrial control, communications, connected equipment and aerospace applications. The opening is practical: a designer who needs operating data to survive a power interruption can test a locally offered device against that requirement. Expanding these domestic product choices underpins FMI's forecast of a 24.3% CAGR for China from 2026 to 2036, the highest rate among the seven countries profiled.
Compatibility determines whether an evaluation becomes a purchase. An existing serial-memory board needs the right electrical behaviour, capacity and software handling; a familiar interface alone does not settle the choice. A local supplier can improve its position by answering design questions and supporting those checks. Availability can shorten the route to evaluation, but the customer still needs to validate retention, endurance and performance in its own environment before increasing orders. A published product range does not measure memory use across an entire industry.
The forecast therefore concerns expanding MRAM sales, with repeat production orders following successful product evaluations. It does not measure the utilisation of a new factory. Chinese suppliers can compete through technical support and a delivery route familiar to local electronics makers, while customers should require the same part-level evidence from domestic and overseas offers. Research into a future memory architecture remains a separate activity from supplying the STT-MRAM products already offered. The commercial task is to keep a validated part available as the customer's equipment moves into production.
India
An Indian equipment designer can buy a packaged MRAM device for an existing board or seek an overseas foundry process for a new chip. Those choices create different requirements. A board redesign needs an available part, clear documentation and suitable operating limits; a chip design needs a supported memory process and additional verification. Suppliers serving India can help at either stage through evaluation support and dependable distribution, but they need to establish which design the customer is actually taking into production.
The wider semiconductor programme can enlarge that customer pool. The government's Semicon 2.0 announcement records twelve approved manufacturing units with investment above INR 1.64 lakh crore and identifies companies that have begun commercial production. These projects span semiconductor activities. They do not establish a dedicated MRAM fabrication line or guarantee that each project uses this memory. Their relevance lies in a widening electronics and semiconductor ecosystem in which designers can adopt qualified memory for controllers and other products.
India's forecast CAGR of 22.5% from 2026 to 2036 rests on converting that broader opportunity into specific memory designs and repeat orders. Reserving supply against a general investment announcement before the memory requirement is defined would bring a different commercial risk. A supplier has a firmer basis for planning once the customer has selected a product or process, completed validation and established its production route. National manufacturing support provides context for this demand; the actual product award still depends on the customer's technical acceptance and equipment programme.
Germany
GlobalFoundries' AutoPro150 offer gives German automotive and industrial chip designers access to embedded memory before a separately scheduled manufacturing milestone. Its March 2026 announcement made prototyping and a process design kit available, while identifying Dresden for volume production scheduled in the second half of 2026. Customers can begin design work through that route, but the stated schedule remains distinct from confirmation of delivered volumes. The local opening is therefore the work needed to take a wider chip from process evaluation to production.
Selecting an embedded process commits that circuit to a manufacturing route and a set of memory characteristics. A German vehicle-electronics customer must verify the design and operating range, then align chip production with the equipment programme. The prospect of more designs completing these stages supports the country's 20.7% forecast CAGR from 2026 to 2036. A local foundry relationship may help technical coordination, but proximity cannot replace qualification, and the process announcement does not establish adoption by every automotive customer.
Suppliers benefit when they help a customer produce a qualified chip and maintain consistent manufacture afterwards. That route does not cover every German memory purchase. A company keeping its existing board architecture can instead evaluate a standalone device for the required duty. Demand can consequently develop through new integrated circuits and selected packaged-memory applications at the same time. The useful comparison is between the operating requirements, design work and production timing of those offers. A general claim that all vehicle electronics need the same memory would obscure the separate purchasing decisions behind the forecast.
France
Excessive write current is one of the obstacles between a fast magnetic-memory switching result and a device that a customer can use repeatedly. CEA's March 2026 account describes SPINTEC and Antaios examining that problem in SOT-MRAM structures. The work gives France a documented role in understanding operating limits. It remains device research, without establishing a qualified French volume production line or customer programme. Commercial progress requires the result to work within a system's conditions and to be reproduced through manufacturing.
French research and design teams can contribute process knowledge and test capability during that development, before large product volumes appear. Alongside demand from specialist electronics, this capability forms the context for FMI's 18.9% CAGR outlook for France from 2026 to 2036. The forecast covers the French MRAM market over the decade; it does not assign the country's sales to the cited project. Nor does it assume that SOT-MRAM will replace current technologies on a fixed timetable.
Customers can continue to use qualified standalone or embedded offers while evaluating a future architecture. In the nearer term, suppliers serving industrial and specialist designs need evidence for retention, interface behaviour and operation in the intended duty. Research activity and sales of packaged MRAM from established suppliers should remain distinct in that assessment. Longer-term business depends on which results become manufacturable products, reproduce their performance and pass customer qualification. A useful supplier offer therefore connects the relevant operating evidence to the customer's design, rather than treating the existence of a research programme as a production order.
United Kingdom
British design work can create demand for an MRAM component or embedded process even when the resulting chip is manufactured abroad. The National Semiconductor Strategy identifies intellectual property, design, compound semiconductors and research among the United Kingdom's strengths. For this market, that makes the engineering programme a more useful starting point than the presence of a local memory factory. A research capability or design business contributes to memory sales when a customer chooses a product or process and takes its equipment into production.
The choice depends on which data must survive a power loss and how quickly the system must recover it. A designer adapting industrial or specialist equipment may prefer a packaged memory that limits changes to the existing board. A company developing a new chip can examine embedded MRAM through a foundry design kit. GlobalFoundries' prototyping offer illustrates that access route, while leaving the customer responsible for completing the wider design and verification. Technical support can influence which option progresses to a production order.
Sales serving these British designs and equipment underpin the United Kingdom's forecast CAGR of 17.1% from 2026 to 2036. Broad semiconductor policy does not itself fund a specific MRAM purchase. Suppliers can strengthen their offer by helping the customer choose a compatible interface, establish the operating duty and plan long product support. The commercial opening is the defined engineering programme that needs that help. Its timing depends on customer validation and production decisions, with design access and continued support relevant across both packaged and embedded routes.
United States
Everspin's US business illustrates why current memory demand and funded process development should be assessed separately. Its second-quarter 2026 release reports growth in industrial automation, energy management, aerospace and defence, alongside initial non-product revenue from a development and validation contract for the US defence industrial base. Product revenue can reflect devices supplied for customer equipment. Contract work supports manufacturing capability that must still be demonstrated before it can sustain comparable recurring shipments. A strong total-revenue quarter does not establish that every dollar comes from memory delivered for current production.
An equipment customer can qualify an available MRAM part for a defined design and then place production orders. Everspin's qualified 64Mb xSPI product offers one route into demanding applications, while its DDR4 product addresses a different buffering requirement. Buyers assessing continuity need the evidence for the selected device and the capability their programme requires. Density, interface, operating limits and the delivery period remain important even where the supplier already has an established commercial position.
Retaining those product customers while converting development capability into additional qualified offers supports the United States' forecast 15.3% CAGR from 2026 to 2036. The market already has a domestic supplier, so progress includes repeat business as well as future products. Suppliers must show that the exact offer fits the customer's duty and can be supported through production. A broad reliability claim for a whole family would not resolve the separate acceptance and supply questions behind those purchases.
Brazil
For a Brazilian equipment maker, an initial MRAM purchase can be a qualified imported device used in a locally designed or assembled product. The decision turns on whether the memory and its integration cost are justified against another way of retaining operating data. Industrial equipment and specialist electronics can require different interfaces, lifetimes and environmental limits. A favourable evaluation in one design therefore does not establish the case for MRAM throughout local electronics production. Suppliers need to address the duty of the equipment being developed.
The Ministry of Development, Industry, Trade and Services describes Brasil Semicon as support for innovation, investment and industrial capability. This wider effort to develop the semiconductor industry provides context for specialised-memory adoption. It does not establish a local MRAM factory, domestic production capacity or a guaranteed order for this technology. Accessible documentation, evaluation hardware and a reliable route to replacement parts can be more immediately useful to a customer choosing an imported component for a specific programme.
Converting that design interest into equipment that passes customer tests and enters repeat manufacture underlies Brazil's 13.5% forecast CAGR from 2026 to 2036. It is the lowest rate in the report's country comparison, while still representing substantial expansion over the decade. The timing of identifiable equipment programmes matters to that growth: an evaluated part generates recurring demand only when the customer moves ahead with production. National incentives can help the broader ecosystem, but the commercial case for an MRAM supplier remains the customer's application, validation result and continuing product requirement.
Who are the notable companies in the MRAM Market?
Everspin Technologies, GlobalFoundries, TSMC and Avalanche Technology occupy different commercial positions in the MRAM supply chain. Everspin sells packaged memory products, including a DDR4 STT-MRAM device for persistent buffering and a separately qualified high-reliability xSPI offer. Customers can select a part and integrate it into a board, subject to their own validation. Product density and interface remain important boundaries within that portfolio.
GlobalFoundries and TSMC provide embedded process routes for customers designing wider integrated circuits. GlobalFoundries' March 2026 announcement offers prototyping access and a design kit, with Dresden volume production on a separate schedule. TSMC records automotive-grade qualification of its second-generation 16nm MRAM. Their commercial role includes the process and design environment that allows a customer's chip to use the memory.
Avalanche Technology publishes space-grade discrete MRAM offerings, where the operating evidence and product support must fit a specialist application. FMI finds that these suppliers should be compared through the product or process the customer can actually use. A space-grade component, an automotive-qualified packaged part and an embedded memory process cannot be ranked on capacity alone. Supply continuity, application support and the exact qualification scope shape the customer decision, while process development creates potential future offers rather than immediate product share.
Key Developments in the MRAM Market
- On 5 March 2026, Everspin announced completed AEC-Q100 Grade 1 production qualification for its 64Mb xSPI STT-MRAM, while its 128Mb and 256Mb products remained on separate qualification schedules in that disclosure.
- On 9 March 2026, GlobalFoundries announced AutoPro150 eMRAM prototyping availability on its enhanced FDX platform, with volume production scheduled for the second half of 2026 at Dresden.
Key Players in the MRAM Market
- Everspin Technologies
- GlobalFoundries
- TSMC
- Avalanche Technology
- Shanghai Siproin Microelectronics
- Antaios
MRAM Market Report Scope
Table 6: MRAM Market Report Scope, 2026 to 2036
| Coverage field | Report scope |
|---|---|
| Market definition | Magnetoresistive random-access memory supplied as standalone devices or integrated within a wider chip. |
| Market boundaries | MRAM is distinguished from complete storage systems, controllers and other semiconductor memories using different storage mechanisms. |
| Quantitative units | USD million for market revenue; percentages for shares and forecast CAGR. |
| Period | 2025 reference value; 2026 assessment; forecast to 2036. |
| Technology | STT-MRAM; toggle MRAM; other magnetoresistive memory. |
| Storage density | Medium-density MRAM; low-density MRAM; high-density MRAM. |
| Integration | Integrated MRAM in a system on chip; standalone MRAM. |
| Application | Industrial controllers; automotive electronics; aerospace and defence; storage systems; other electronics. |
| Geographic coverage | Seven global regions with the nested country and subregion coverage below; detailed profiles of China, India, Germany, France, United Kingdom, United States and Brazil. |
| Commercial coverage | Qualification, interface and density requirements, embedded process access and documented supplier activity. |
Source: Future Market Insights, MRAM Market Report, 2026 to 2036.
MRAM Market Research Methodology
The outlook uses FMI's revenue and country forecast framework, with separate technology, density and integration assessments. Secondary research checks supplier product documentation, annual reports, qualification announcements, research publications and national semiconductor policy documents. Device availability, process qualification, prototyping and planned volume production are recorded as different stages. Commercial analysis compares the exact memory offer with the customer design it supports; general semiconductor investment is used as context rather than as a measurement of MRAM sales.
MRAM Market by Segments
MRAM Market segmented by Technology:
- STT-MRAM
- Toggle MRAM
- Other magnetoresistive memory
MRAM Market segmented by Storage Density:
- Medium-density MRAM
- Low-density MRAM
- High-density MRAM
MRAM Market segmented by Integration:
- Integrated MRAM in a system on chip
- Standalone MRAM
MRAM Market segmented by Application:
- Industrial controllers
- Automotive electronics
- Aerospace and defence
- Storage systems
- Other electronics
MRAM Market by Region
- North America
- United States
- Canada
- Latin America
- Brazil
- Mexico
- Argentina
- Chile
- Western Europe
- Germany
- France
- United Kingdom
- Italy
- Spain
- Benelux
- Nordics
- Eastern Europe
- Poland
- Czech Republic
- Romania
- Hungary
- East Asia
- China
- Japan
- South Korea
- Taiwan
- South Asia and Pacific
- India
- Singapore
- Other ASEAN countries
- Australia and New Zealand
- Middle East and Africa
- GCC Countries
- South Africa
- Türkiye
- Israel
Research Sources and Bibliography
- [1] Everspin Technologies. Everspin Advances High-Reliability xSPI MRAM Portfolio With 256Mb Density and Production Qualification Milestones. 5 March 2026.
- [2] GlobalFoundries. GlobalFoundries Announces Availability of AutoPro150 eMRAM Technology on Enhanced FDX Platform for Advanced Automotive Applications. 9 March 2026.
- [3] TSMC. 2025 Annual Report, Business Activities: 16MRAM automotive-grade qualification. 2026 publication; accessed 31 October 2026.
- [4] Everspin Technologies. EMD4E001G: 1Gb Spin-transfer Torque MRAM product information. Accessed 31 October 2026.
- [5] Everspin Technologies. Unaudited Second Quarter 2026 Financial Results, Exhibit 99.1 filed with the US Securities and Exchange Commission. 5 August 2026.
- [6] CEA. Bits en fuite: quand un excès de courant affecte la mémoire. 26 March 2026.
- [7] Shanghai Siproin Microelectronics. Your Peers Are Quietly Switching to This New Memory Chip; STT-MRAM product range. Accessed 31 October 2026.
- [8] Government of India, Prime Minister's Office. Cabinet approves Semicon 2.0: Government delivers on its commitment for long-term policy support to semiconductors in India. 2026; accessed 31 October 2026.
- [9] UK Government. National Semiconductor Strategy. 2023; accessed 31 October 2026.
- [10] Brazil Ministry of Development, Industry, Trade and Services. Programa Brasil Semicondutores (Brasil Semicon). Updated 10 March 2026.
- [11] Avalanche Technology. Space Product Brochure. 2023; accessed 31 October 2026.
Table of Content
- Key Takeaways
- Market Size and CAGR
- Top Growth Driver
- Fastest Growing Segment
- Leading Region
- Key Companies
- Emerging Opportunities
- Executive Summary
- Global Market Outlook
- Demand-side Trends
- Supply-side Trends
- Technology Roadmap Analysis
- Analysis and Recommendations
- Analyst Perspective (What is happening? Why now? What should investors know?)
- Key Questions Answered
- How large is the market?
- What is the CAGR?
- What are key trends?
- Which region dominates?
- Who are the leaders?
Read More...
- Market Overview
- Market Coverage / Taxonomy
- Market Definition / Scope / Limitations
- Research Methodology
- Chapter Orientation
- Analytical Lens and Working Hypotheses
- Market Structure, Signals, and Trend Drivers
- Benchmarking and Cross-market Comparability
- Market Sizing, Forecasting, and Opportunity Mapping
- Research Design and Evidence Framework
- Desk Research Programme (Secondary Evidence)
- Expert Input and Fieldwork (Primary Evidence)
- Tooling, Models, and Reference Databases
- Data Engineering and Model Build
- Quality Assurance and Audit Trail
- Market Background
- Market Dynamics (Drivers, Restraints, Opportunity, Trends)
- Scenario Forecast (Optimistic, Likely, Conservative)
- Impact Analysis
- AI Impact
- Sustainability Impact
- Regulatory Impact
- Technology Impact
- Consumer / Buyer Analysis
- Purchase Drivers
- Adoption Barriers
- Buyer Journey
- Opportunity Map Analysis
- Product Life Cycle Analysis
- Supply Chain Analysis
- Investment Feasibility Matrix
- Value Chain Analysis
- PESTLE and Porter's Analysis
- Regulatory Landscape
- Regional Parent Market Outlook
- Production and Consumption Statistics
- Import and Export Statistics
- Global Market Analysis and Forecast, 2021 to 2036
- Historical Market Size Value (USD Million) Analysis, 2021 to 2025
- Current and Future Market Size Value (USD Million) Projections, 2026 to 2036
- Y-o-Y Growth Trend Analysis
- Absolute $ Opportunity Analysis
- Global Market Pricing Analysis, 2021 to 2036
- Global Market Analysis and Forecast, By Technology, 2021 to 2036
- Introduction / Key Findings
- Historical Market Size Value (USD Million) Analysis By Technology, 2021 to 2025
- Current and Future Market Size Value (USD Million) Analysis and Forecast By Technology, 2026 to 2036
- STT-MRAM
- Toggle MRAM
- Other magnetoresistive memory
- Y-o-Y Growth Trend Analysis By Technology, 2021 to 2025
- Absolute $ Opportunity Analysis By Technology, 2026 to 2036
- Global Market Analysis and Forecast, By Storage Density, 2021 to 2036
- Introduction / Key Findings
- Historical Market Size Value (USD Million) Analysis By Storage Density, 2021 to 2025
- Current and Future Market Size Value (USD Million) Analysis and Forecast By Storage Density, 2026 to 2036
- Medium-density MRAM
- Low-density MRAM
- High-density MRAM
- Y-o-Y Growth Trend Analysis By Storage Density, 2021 to 2025
- Absolute $ Opportunity Analysis By Storage Density, 2026 to 2036
- Global Market Analysis and Forecast, By Integration, 2021 to 2036
- Introduction / Key Findings
- Historical Market Size Value (USD Million) Analysis By Integration, 2021 to 2025
- Current and Future Market Size Value (USD Million) Analysis and Forecast By Integration, 2026 to 2036
- Integrated MRAM in a system on chip
- Standalone MRAM
- Y-o-Y Growth Trend Analysis By Integration, 2021 to 2025
- Absolute $ Opportunity Analysis By Integration, 2026 to 2036
- Global Market Analysis and Forecast, By Application, 2021 to 2036
- Introduction / Key Findings
- Historical Market Size Value (USD Million) Analysis By Application, 2021 to 2025
- Current and Future Market Size Value (USD Million) Analysis and Forecast By Application, 2026 to 2036
- Industrial controllers
- Automotive electronics
- Aerospace and defence
- Storage systems
- Other electronics
- Y-o-Y Growth Trend Analysis By Application, 2021 to 2025
- Absolute $ Opportunity Analysis By Application, 2026 to 2036
- Global Market Analysis and Forecast, By Region, 2021 to 2036
- Introduction
- Historical Market Size Value (USD Million) Analysis By Region, 2021 to 2025
- Current Market Size Value (USD Million) Analysis and Forecast By Region, 2026 to 2036
- North America
- Latin America
- Western Europe
- Eastern Europe
- East Asia
- South Asia and Pacific
- Middle East and Africa
- Market Attractiveness Analysis By Region
- North America Market Analysis and Forecast, By Country, 2021 to 2036
- Historical Market Size Value (USD Million) Trend Analysis By Market Taxonomy, 2021 to 2025
- Market Size Value (USD Million) Forecast By Market Taxonomy, 2026 to 2036
- By Country
- United States
- Canada
- By Technology
- By Storage Density
- By Integration
- By Application
- By Country
- Market Attractiveness Analysis
- By Country
- By Technology
- By Storage Density
- By Integration
- By Application
- Key Takeaways
- Latin America Market Analysis and Forecast, By Country
- Historical Market Size Value (USD Million) Trend Analysis By Market Taxonomy, 2021 to 2025
- Market Size Value (USD Million) Forecast By Market Taxonomy, 2026 to 2036
- By Country
- Brazil
- Mexico
- Argentina
- Chile
- By Technology
- By Storage Density
- By Integration
- By Application
- By Country
- Market Attractiveness Analysis
- By Country
- By Technology
- By Storage Density
- By Integration
- By Application
- Key Takeaways
- Western Europe Market Analysis and Forecast, By Country
- Historical Market Size Value (USD Million) Trend Analysis By Market Taxonomy, 2021 to 2025
- Market Size Value (USD Million) Forecast By Market Taxonomy, 2026 to 2036
- By Country
- Germany
- France
- United Kingdom
- Italy
- Spain
- Benelux
- Nordics
- By Technology
- By Storage Density
- By Integration
- By Application
- By Country
- Market Attractiveness Analysis
- By Country
- By Technology
- By Storage Density
- By Integration
- By Application
- Key Takeaways
- Eastern Europe Market Analysis and Forecast, By Country
- Historical Market Size Value (USD Million) Trend Analysis By Market Taxonomy, 2021 to 2025
- Market Size Value (USD Million) Forecast By Market Taxonomy, 2026 to 2036
- By Country
- Poland
- Czech Republic
- Romania
- Hungary
- By Technology
- By Storage Density
- By Integration
- By Application
- By Country
- Market Attractiveness Analysis
- By Country
- By Technology
- By Storage Density
- By Integration
- By Application
- Key Takeaways
- East Asia Market Analysis and Forecast, By Country
- Historical Market Size Value (USD Million) Trend Analysis By Market Taxonomy, 2021 to 2025
- Market Size Value (USD Million) Forecast By Market Taxonomy, 2026 to 2036
- By Country
- China
- Japan
- South Korea
- Taiwan
- By Technology
- By Storage Density
- By Integration
- By Application
- By Country
- Market Attractiveness Analysis
- By Country
- By Technology
- By Storage Density
- By Integration
- By Application
- Key Takeaways
- South Asia and Pacific Market Analysis and Forecast, By Country
- Historical Market Size Value (USD Million) Trend Analysis By Market Taxonomy, 2021 to 2025
- Market Size Value (USD Million) Forecast By Market Taxonomy, 2026 to 2036
- By Country
- India
- Singapore
- Other ASEAN countries
- Australia and New Zealand
- By Technology
- By Storage Density
- By Integration
- By Application
- By Country
- Market Attractiveness Analysis
- By Country
- By Technology
- By Storage Density
- By Integration
- By Application
- Key Takeaways
- Middle East and Africa Market Analysis and Forecast, By Country
- Historical Market Size Value (USD Million) Trend Analysis By Market Taxonomy, 2021 to 2025
- Market Size Value (USD Million) Forecast By Market Taxonomy, 2026 to 2036
- By Country
- GCC Countries
- South Africa
- Türkiye
- Israel
- By Technology
- By Storage Density
- By Integration
- By Application
- By Country
- Market Attractiveness Analysis
- By Country
- By Technology
- By Storage Density
- By Integration
- By Application
- Key Takeaways
- Key Countries Market Analysis
- United States
- Pricing Analysis
- Market Share Analysis, 2025
- By Technology
- By Storage Density
- By Integration
- By Application
- Canada
- Pricing Analysis
- Market Share Analysis, 2025
- By Technology
- By Storage Density
- By Integration
- By Application
- Mexico
- Pricing Analysis
- Market Share Analysis, 2025
- By Technology
- By Storage Density
- By Integration
- By Application
- Brazil
- Pricing Analysis
- Market Share Analysis, 2025
- By Technology
- By Storage Density
- By Integration
- By Application
- Chile
- Pricing Analysis
- Market Share Analysis, 2025
- By Technology
- By Storage Density
- By Integration
- By Application
- Germany
- Pricing Analysis
- Market Share Analysis, 2025
- By Technology
- By Storage Density
- By Integration
- By Application
- United Kingdom
- Pricing Analysis
- Market Share Analysis, 2025
- By Technology
- By Storage Density
- By Integration
- By Application
- Italy
- Pricing Analysis
- Market Share Analysis, 2025
- By Technology
- By Storage Density
- By Integration
- By Application
- Spain
- Pricing Analysis
- Market Share Analysis, 2025
- By Technology
- By Storage Density
- By Integration
- By Application
- France
- Pricing Analysis
- Market Share Analysis, 2025
- By Technology
- By Storage Density
- By Integration
- By Application
- India
- Pricing Analysis
- Market Share Analysis, 2025
- By Technology
- By Storage Density
- By Integration
- By Application
- Australia and New Zealand
- Pricing Analysis
- Market Share Analysis, 2025
- By Technology
- By Storage Density
- By Integration
- By Application
- China
- Pricing Analysis
- Market Share Analysis, 2025
- By Technology
- By Storage Density
- By Integration
- By Application
- Japan
- Pricing Analysis
- Market Share Analysis, 2025
- By Technology
- By Storage Density
- By Integration
- By Application
- South Korea
- Pricing Analysis
- Market Share Analysis, 2025
- By Technology
- By Storage Density
- By Integration
- By Application
- Poland
- Pricing Analysis
- Market Share Analysis, 2025
- By Technology
- By Storage Density
- By Integration
- By Application
- Hungary
- Pricing Analysis
- Market Share Analysis, 2025
- By Technology
- By Storage Density
- By Integration
- By Application
- Türkiye
- Pricing Analysis
- Market Share Analysis, 2025
- By Technology
- By Storage Density
- By Integration
- By Application
- South Africa
- Pricing Analysis
- Market Share Analysis, 2025
- By Technology
- By Storage Density
- By Integration
- By Application
- United States
- Market Structure Analysis
- Competition Dashboard
- Competition Benchmarking
- Market Share Analysis of Top Players
- By Regional
- By Technology
- By Storage Density
- By Integration
- By Application
- Emerging Startups
- Innovation Benchmarking
- Competition Analysis
- Competition Deep Dive
- Everspin Technologies
- Overview
- Product Portfolio
- Profitability by Market Segments
- Sales Footprint
- Strategy Overview
- Marketing Strategy
- Product Strategy
- Channel Strategy
- GlobalFoundries
- TSMC
- Avalanche Technology
- Shanghai Siproin Microelectronics
- Antaios
- Everspin Technologies
- Case Studies
- Success Stories
- Recent Developments
- Competition Deep Dive
- Assumptions & Acronyms Used
List of Tables
- Table 1: Global Market Value (USD Million) Forecast by Region, 2021 to 2036
- Table 2: Global Market Value (USD Million) Forecast by Technology, 2021 to 2036
- Table 3: Global Market Value (USD Million) Forecast by Storage Density, 2021 to 2036
- Table 4: Global Market Value (USD Million) Forecast by Integration, 2021 to 2036
- Table 5: Global Market Value (USD Million) Forecast by Application, 2021 to 2036
- Table 6: North America Market Value (USD Million) Forecast by Country, 2021 to 2036
- Table 7: North America Market Value (USD Million) Forecast by Technology, 2021 to 2036
- Table 8: North America Market Value (USD Million) Forecast by Storage Density, 2021 to 2036
- Table 9: North America Market Value (USD Million) Forecast by Integration, 2021 to 2036
- Table 10: North America Market Value (USD Million) Forecast by Application, 2021 to 2036
- Table 11: Latin America Market Value (USD Million) Forecast by Country, 2021 to 2036
- Table 12: Latin America Market Value (USD Million) Forecast by Technology, 2021 to 2036
- Table 13: Latin America Market Value (USD Million) Forecast by Storage Density, 2021 to 2036
- Table 14: Latin America Market Value (USD Million) Forecast by Integration, 2021 to 2036
- Table 15: Latin America Market Value (USD Million) Forecast by Application, 2021 to 2036
- Table 16: Western Europe Market Value (USD Million) Forecast by Country, 2021 to 2036
- Table 17: Western Europe Market Value (USD Million) Forecast by Technology, 2021 to 2036
- Table 18: Western Europe Market Value (USD Million) Forecast by Storage Density, 2021 to 2036
- Table 19: Western Europe Market Value (USD Million) Forecast by Integration, 2021 to 2036
- Table 20: Western Europe Market Value (USD Million) Forecast by Application, 2021 to 2036
- Table 21: Eastern Europe Market Value (USD Million) Forecast by Country, 2021 to 2036
- Table 22: Eastern Europe Market Value (USD Million) Forecast by Technology, 2021 to 2036
- Table 23: Eastern Europe Market Value (USD Million) Forecast by Storage Density, 2021 to 2036
- Table 24: Eastern Europe Market Value (USD Million) Forecast by Integration, 2021 to 2036
- Table 25: Eastern Europe Market Value (USD Million) Forecast by Application, 2021 to 2036
- Table 26: East Asia Market Value (USD Million) Forecast by Country, 2021 to 2036
- Table 27: East Asia Market Value (USD Million) Forecast by Technology, 2021 to 2036
- Table 28: East Asia Market Value (USD Million) Forecast by Storage Density, 2021 to 2036
- Table 29: East Asia Market Value (USD Million) Forecast by Integration, 2021 to 2036
- Table 30: East Asia Market Value (USD Million) Forecast by Application, 2021 to 2036
- Table 31: South Asia and Pacific Market Value (USD Million) Forecast by Country, 2021 to 2036
- Table 32: South Asia and Pacific Market Value (USD Million) Forecast by Technology, 2021 to 2036
- Table 33: South Asia and Pacific Market Value (USD Million) Forecast by Storage Density, 2021 to 2036
- Table 34: South Asia and Pacific Market Value (USD Million) Forecast by Integration, 2021 to 2036
- Table 35: South Asia and Pacific Market Value (USD Million) Forecast by Application, 2021 to 2036
- Table 36: Middle East and Africa Market Value (USD Million) Forecast by Country, 2021 to 2036
- Table 37: Middle East and Africa Market Value (USD Million) Forecast by Technology, 2021 to 2036
- Table 38: Middle East and Africa Market Value (USD Million) Forecast by Storage Density, 2021 to 2036
- Table 39: Middle East and Africa Market Value (USD Million) Forecast by Integration, 2021 to 2036
- Table 40: Middle East and Africa Market Value (USD Million) Forecast by Application, 2021 to 2036
List of Figures
- Figure 1: Global Market Pricing Analysis
- Figure 2: Global Market Value (USD Million) Forecast 2021-2036
- Figure 3: Global Market Value Share and BPS Analysis by Technology, 2026 and 2036
- Figure 4: Global Market Y-o-Y Growth Comparison by Technology, 2026-2036
- Figure 5: Global Market Attractiveness Analysis by Technology
- Figure 6: Global Market Value Share and BPS Analysis by Storage Density, 2026 and 2036
- Figure 7: Global Market Y-o-Y Growth Comparison by Storage Density, 2026-2036
- Figure 8: Global Market Attractiveness Analysis by Storage Density
- Figure 9: Global Market Value Share and BPS Analysis by Integration, 2026 and 2036
- Figure 10: Global Market Y-o-Y Growth Comparison by Integration, 2026-2036
- Figure 11: Global Market Attractiveness Analysis by Integration
- Figure 12: Global Market Value Share and BPS Analysis by Application, 2026 and 2036
- Figure 13: Global Market Y-o-Y Growth Comparison by Application, 2026-2036
- Figure 14: Global Market Attractiveness Analysis by Application
- Figure 15: Global Market Value (USD Million) Share and BPS Analysis by Region, 2026 and 2036
- Figure 16: Global Market Y-o-Y Growth Comparison by Region, 2026-2036
- Figure 17: Global Market Attractiveness Analysis by Region
- Figure 18: North America Market Incremental Dollar Opportunity, 2026-2036
- Figure 19: Latin America Market Incremental Dollar Opportunity, 2026-2036
- Figure 20: Western Europe Market Incremental Dollar Opportunity, 2026-2036
- Figure 21: Eastern Europe Market Incremental Dollar Opportunity, 2026-2036
- Figure 22: East Asia Market Incremental Dollar Opportunity, 2026-2036
- Figure 23: South Asia and Pacific Market Incremental Dollar Opportunity, 2026-2036
- Figure 24: Middle East and Africa Market Incremental Dollar Opportunity, 2026-2036
- Figure 25: North America Market Value Share and BPS Analysis by Country, 2026 and 2036
- Figure 26: North America Market Value Share and BPS Analysis by Technology, 2026 and 2036
- Figure 27: North America Market Y-o-Y Growth Comparison by Technology, 2026-2036
- Figure 28: North America Market Attractiveness Analysis by Technology
- Figure 29: North America Market Value Share and BPS Analysis by Storage Density, 2026 and 2036
- Figure 30: North America Market Y-o-Y Growth Comparison by Storage Density, 2026-2036
- Figure 31: North America Market Attractiveness Analysis by Storage Density
- Figure 32: North America Market Value Share and BPS Analysis by Integration, 2026 and 2036
- Figure 33: North America Market Y-o-Y Growth Comparison by Integration, 2026-2036
- Figure 34: North America Market Attractiveness Analysis by Integration
- Figure 35: North America Market Value Share and BPS Analysis by Application, 2026 and 2036
- Figure 36: North America Market Y-o-Y Growth Comparison by Application, 2026-2036
- Figure 37: North America Market Attractiveness Analysis by Application
- Figure 38: Latin America Market Value Share and BPS Analysis by Country, 2026 and 2036
- Figure 39: Latin America Market Value Share and BPS Analysis by Technology, 2026 and 2036
- Figure 40: Latin America Market Y-o-Y Growth Comparison by Technology, 2026-2036
- Figure 41: Latin America Market Attractiveness Analysis by Technology
- Figure 42: Latin America Market Value Share and BPS Analysis by Storage Density, 2026 and 2036
- Figure 43: Latin America Market Y-o-Y Growth Comparison by Storage Density, 2026-2036
- Figure 44: Latin America Market Attractiveness Analysis by Storage Density
- Figure 45: Latin America Market Value Share and BPS Analysis by Integration, 2026 and 2036
- Figure 46: Latin America Market Y-o-Y Growth Comparison by Integration, 2026-2036
- Figure 47: Latin America Market Attractiveness Analysis by Integration
- Figure 48: Latin America Market Value Share and BPS Analysis by Application, 2026 and 2036
- Figure 49: Latin America Market Y-o-Y Growth Comparison by Application, 2026-2036
- Figure 50: Latin America Market Attractiveness Analysis by Application
- Figure 51: Western Europe Market Value Share and BPS Analysis by Country, 2026 and 2036
- Figure 52: Western Europe Market Value Share and BPS Analysis by Technology, 2026 and 2036
- Figure 53: Western Europe Market Y-o-Y Growth Comparison by Technology, 2026-2036
- Figure 54: Western Europe Market Attractiveness Analysis by Technology
- Figure 55: Western Europe Market Value Share and BPS Analysis by Storage Density, 2026 and 2036
- Figure 56: Western Europe Market Y-o-Y Growth Comparison by Storage Density, 2026-2036
- Figure 57: Western Europe Market Attractiveness Analysis by Storage Density
- Figure 58: Western Europe Market Value Share and BPS Analysis by Integration, 2026 and 2036
- Figure 59: Western Europe Market Y-o-Y Growth Comparison by Integration, 2026-2036
- Figure 60: Western Europe Market Attractiveness Analysis by Integration
- Figure 61: Western Europe Market Value Share and BPS Analysis by Application, 2026 and 2036
- Figure 62: Western Europe Market Y-o-Y Growth Comparison by Application, 2026-2036
- Figure 63: Western Europe Market Attractiveness Analysis by Application
- Figure 64: Eastern Europe Market Value Share and BPS Analysis by Country, 2026 and 2036
- Figure 65: Eastern Europe Market Value Share and BPS Analysis by Technology, 2026 and 2036
- Figure 66: Eastern Europe Market Y-o-Y Growth Comparison by Technology, 2026-2036
- Figure 67: Eastern Europe Market Attractiveness Analysis by Technology
- Figure 68: Eastern Europe Market Value Share and BPS Analysis by Storage Density, 2026 and 2036
- Figure 69: Eastern Europe Market Y-o-Y Growth Comparison by Storage Density, 2026-2036
- Figure 70: Eastern Europe Market Attractiveness Analysis by Storage Density
- Figure 71: Eastern Europe Market Value Share and BPS Analysis by Integration, 2026 and 2036
- Figure 72: Eastern Europe Market Y-o-Y Growth Comparison by Integration, 2026-2036
- Figure 73: Eastern Europe Market Attractiveness Analysis by Integration
- Figure 74: Eastern Europe Market Value Share and BPS Analysis by Application, 2026 and 2036
- Figure 75: Eastern Europe Market Y-o-Y Growth Comparison by Application, 2026-2036
- Figure 76: Eastern Europe Market Attractiveness Analysis by Application
- Figure 77: East Asia Market Value Share and BPS Analysis by Country, 2026 and 2036
- Figure 78: East Asia Market Value Share and BPS Analysis by Technology, 2026 and 2036
- Figure 79: East Asia Market Y-o-Y Growth Comparison by Technology, 2026-2036
- Figure 80: East Asia Market Attractiveness Analysis by Technology
- Figure 81: East Asia Market Value Share and BPS Analysis by Storage Density, 2026 and 2036
- Figure 82: East Asia Market Y-o-Y Growth Comparison by Storage Density, 2026-2036
- Figure 83: East Asia Market Attractiveness Analysis by Storage Density
- Figure 84: East Asia Market Value Share and BPS Analysis by Integration, 2026 and 2036
- Figure 85: East Asia Market Y-o-Y Growth Comparison by Integration, 2026-2036
- Figure 86: East Asia Market Attractiveness Analysis by Integration
- Figure 87: East Asia Market Value Share and BPS Analysis by Application, 2026 and 2036
- Figure 88: East Asia Market Y-o-Y Growth Comparison by Application, 2026-2036
- Figure 89: East Asia Market Attractiveness Analysis by Application
- Figure 90: South Asia and Pacific Market Value Share and BPS Analysis by Country, 2026 and 2036
- Figure 91: South Asia and Pacific Market Value Share and BPS Analysis by Technology, 2026 and 2036
- Figure 92: South Asia and Pacific Market Y-o-Y Growth Comparison by Technology, 2026-2036
- Figure 93: South Asia and Pacific Market Attractiveness Analysis by Technology
- Figure 94: South Asia and Pacific Market Value Share and BPS Analysis by Storage Density, 2026 and 2036
- Figure 95: South Asia and Pacific Market Y-o-Y Growth Comparison by Storage Density, 2026-2036
- Figure 96: South Asia and Pacific Market Attractiveness Analysis by Storage Density
- Figure 97: South Asia and Pacific Market Value Share and BPS Analysis by Integration, 2026 and 2036
- Figure 98: South Asia and Pacific Market Y-o-Y Growth Comparison by Integration, 2026-2036
- Figure 99: South Asia and Pacific Market Attractiveness Analysis by Integration
- Figure 100: South Asia and Pacific Market Value Share and BPS Analysis by Application, 2026 and 2036
- Figure 101: South Asia and Pacific Market Y-o-Y Growth Comparison by Application, 2026-2036
- Figure 102: South Asia and Pacific Market Attractiveness Analysis by Application
- Figure 103: Middle East and Africa Market Value Share and BPS Analysis by Country, 2026 and 2036
- Figure 104: Middle East and Africa Market Value Share and BPS Analysis by Technology, 2026 and 2036
- Figure 105: Middle East and Africa Market Y-o-Y Growth Comparison by Technology, 2026-2036
- Figure 106: Middle East and Africa Market Attractiveness Analysis by Technology
- Figure 107: Middle East and Africa Market Value Share and BPS Analysis by Storage Density, 2026 and 2036
- Figure 108: Middle East and Africa Market Y-o-Y Growth Comparison by Storage Density, 2026-2036
- Figure 109: Middle East and Africa Market Attractiveness Analysis by Storage Density
- Figure 110: Middle East and Africa Market Value Share and BPS Analysis by Integration, 2026 and 2036
- Figure 111: Middle East and Africa Market Y-o-Y Growth Comparison by Integration, 2026-2036
- Figure 112: Middle East and Africa Market Attractiveness Analysis by Integration
- Figure 113: Middle East and Africa Market Value Share and BPS Analysis by Application, 2026 and 2036
- Figure 114: Middle East and Africa Market Y-o-Y Growth Comparison by Application, 2026-2036
- Figure 115: Middle East and Africa Market Attractiveness Analysis by Application
- Figure 116: Global Market - Tier Structure Analysis
- Figure 117: Global Market - Company Share Analysis
Frequently Asked Questions
What is the forecast for the MRAM Market?
FMI forecasts USD 5,632.6 million by 2036, compared with USD 1,076.2 million in 2026 and USD 912.0 million in 2025, at an 18.0% CAGR from 2026 to 2036. The 2035 outlook is USD 4,773.4 million.
Which technology leads the MRAM Market?
STT-MRAM holds 52.0% by technology in FMI's 2026 assessment.
Which storage-density and integration categories lead?
Medium-density MRAM holds 45.0% by storage density and integrated MRAM in a system on chip holds 58.0% by integration in FMI's 2026 assessment.
Which profiled country has the highest growth?
China has the highest forecast CAGR at 24.3% from 2026 to 2036, followed by India at 22.5% and Germany at 20.7%.
Does an automotive-qualified process prove a vehicle shipment?
No. TSMC reports process qualification, [3] while GlobalFoundries distinguishes prototyping access from scheduled volume production. [2] A customer must complete its own design and production programme.
Preview the report firsthand - request a free sample
Get SampleGet the brochure for pricing and purchase details.
Get PDF
