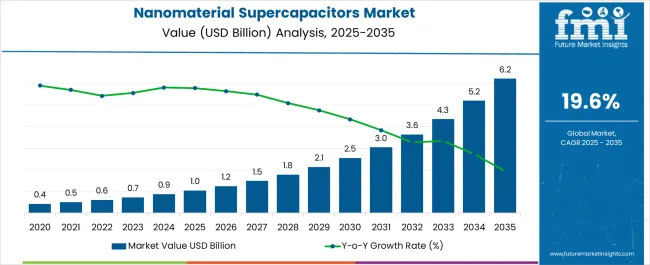
The Nanomaterial Super Capacitor Market is estimated to be valued at USD 1.0 billion in 2025 and is projected to reach USD 6.2 billion by 2035, registering a compound annual growth rate (CAGR) of 19.6% over the forecast period.
| Metric | Value |
|---|---|
| Nanomaterial Super Capacitor Market Estimated Value in (2025 E) | USD 1.0 billion |
| Nanomaterial Super Capacitor Market Forecast Value in (2035 F) | USD 6.2 billion |
| Forecast CAGR (2025 to 2035) | 19.6% |
The nanomaterial supercapacitors market is witnessing steady growth as industries demand high-performance energy storage systems that balance power density, charge speed, and environmental sustainability. Nanomaterials are enabling enhanced electrochemical properties, such as higher surface area and improved conductivity, which are essential for developing next-generation energy storage systems.
Industry players are focusing on graphene, carbon nanotubes, and metal oxides to increase energy density while retaining fast charge-discharge characteristics. The growing shift toward electrification in transport and manufacturing, alongside regulatory support for clean energy transitions, is driving the adoption of supercapacitors in hybrid and fully electric systems.
Continued research and pilot commercialization of flexible and wearable electronics are opening new use cases for thin-film nanomaterial-based energy components. Long-term market expansion is expected to be supported by battery-supercapacitor integration, demand for energy resilience in grids, and investment in low-carbon technologies across key industrial sectors.
The market is segmented by Product Type, Application, and End-use Industry and region. By Product Type, the market is divided into Industrial, Consumer, and Transport. In terms of Application, the market is classified into Electric & hybrid vehicles, Sensors, Instrumentation, Wind turbines, and Photovoltaic modules. Based on End-use Industry, the market is segmented into Energy, Healthcare, Electronics, Transportation, and Others. Regionally, the market is classified into North America, Latin America, Western Europe, Eastern Europe, Balkan & Baltic Countries, Russia & Belarus, Central Asia, East Asia, South Asia & Pacific, and the Middle East & Africa.
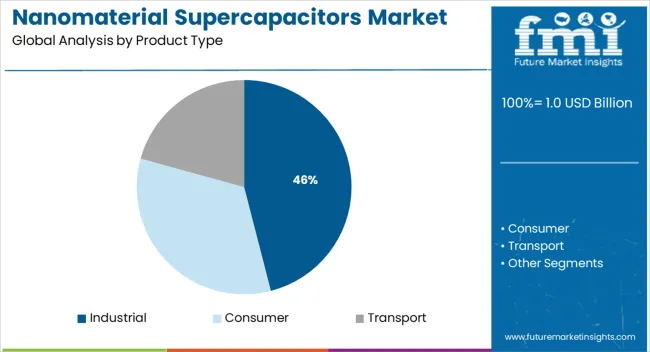
The industrial segment is expected to account for 46.0% of the total revenue share in 2025, making it the dominant product type in the nanomaterial supercapacitors market. This leadership is being driven by the demand for scalable, robust, and long-life energy storage solutions required across heavy-duty machinery, automation systems, and industrial UPS applications.
The ability of nanomaterial-enhanced supercapacitors to operate reliably under high temperatures and fluctuating loads has supported their use in harsh industrial environments. Manufacturers are increasingly incorporating graphene-based electrodes to improve power output and cycle life, enabling cost efficiencies over time.
The segment’s growth is also reinforced by the need for sustainable energy storage in decarbonization initiatives, where supercapacitors serve as complementary systems to batteries and renewables in industrial settings.
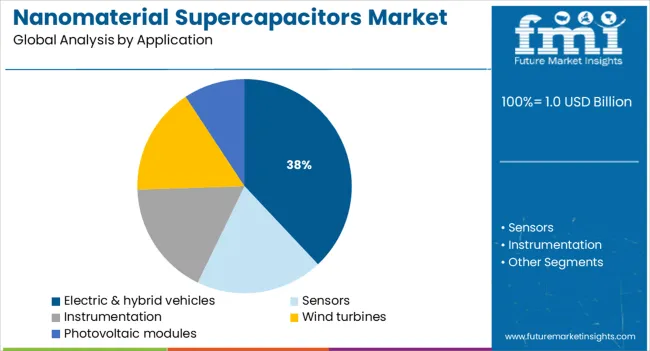
Electric and hybrid vehicles are projected to hold 38.0% of the total market share by 2025, emerging as the leading application for nanomaterial supercapacitors. This dominance is being attributed to the need for efficient energy buffering, rapid power bursts, and regenerative braking systems.
Nanomaterials such as carbon nanotubes and activated carbon are being utilized to deliver high capacitance and conductivity, improving vehicle acceleration, battery longevity, and energy recovery performance. As global automakers shift toward electrification, supercapacitors are increasingly being integrated alongside lithium-ion batteries to optimize load balancing and thermal management.
Government mandates on emission reduction and incentives for electric vehicle adoption are expected to continue accelerating segment growth. The segment is also benefitting from advancements in lightweight materials and compact module design, enabling better fitment in vehicle architectures.
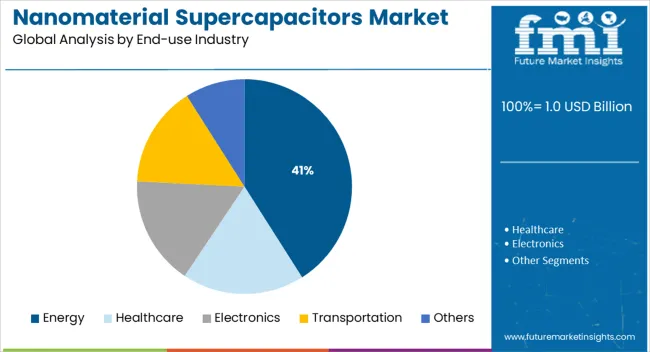
The energy sector is forecast to capture 41.0% of the market revenue share in 2025, making it the top end-use industry for nanomaterial supercapacitors. This growth is being driven by the rising demand for grid stabilization, renewable integration, and backup power storage systems.
Nanomaterials have enhanced the performance of supercapacitors in terms of energy retention, charging speed, and life cycle efficiency, which are critical in energy infrastructure. Applications such as microgrids, solar power smoothing, and frequency regulation are increasingly relying on nanomaterial-enhanced systems for their operational agility and responsiveness.
The energy sector’s shift toward decentralization and the proliferation of smart grid technologies are further expanding the addressable market. As utilities focus on building more resilient, low-emission energy systems, supercapacitors are playing an instrumental role in bridging the performance gap between batteries and real-time power delivery systems.
With the advent of smartphones and tablet computers, demand for nanomaterial supercapacitors is expected to grow in the coming years. Without energy storage technologies to power, these portable devices, this new era of communication, information, and portability would not have been feasible.
Modern multipurpose portable devices, which demand increased performance in terms of power density, are challenging the capabilities of lithium batteries. While current research and development efforts aim to create a new generation of high-energy density technologies, lithium batteries are facing competition from other energy storage technologies.
The market for batteries that store energy for smart and portable electronics is now the largest and expanding the fastest. One of the markets with the greatest rate of change is the consumer electronics sector, which fuels the demand for nanomaterial supercapacitors. Since portable electronics are growing more and more multipurpose, batteries currently need to perform better.
This is the case with nanomaterial supercapacitors, a newly developed energy storage technology, whose properties make them excellent candidates for fulfilling those particular jobs for which lithium batteries fall short. This gives substantial rise to nanomaterial supercapacitors' market share.
New advancements in the realm of energy storage are being made possible by advances in electronics and material science. When combined with energy harvesting and radio frequency technologies, these solutions open up a wide range of potential applications for nanomaterial supercapacitors.
This includes traceability in the supply chains of consumer goods and internet remote localization without the use of large devices, to name a few. This needs for more efficient, sustainable energy storage has sparked a resurgence in scientific and commercial interest in advanced capacitor designs, where the collection of experimental methods and theories that make up nanotechnology is crucially important.
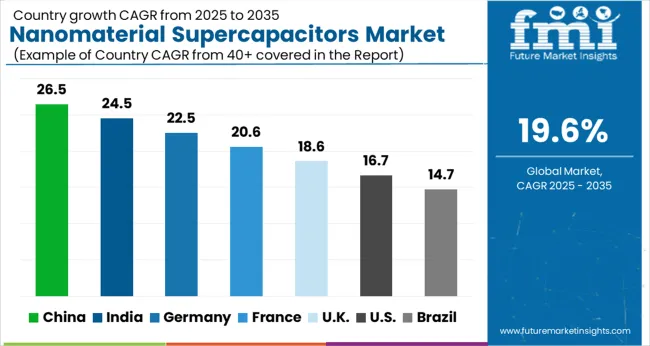
Due to its developing information technology, Latin America is experiencing a modest CAGR in terms of value in the worldwide nanomaterial supercapacitors market.
Although the Middle East and Africa (MEA) region is still in its infancy in the global market for nanomaterial supercapacitors, it is anticipated to grow at a high CAGR during the anticipated period.
North America dominates the nanomaterial supercapacitors market globally, with an expected share of 33.7% in 2025. The high demand for nanomaterial supercapacitors is on account of its flourishing medical and healthcare industry. Furthermore, increasing spending on nanotechnology by several firms is growing the market share overall. Government spending on Research and Development is also having a significant impact on the market.
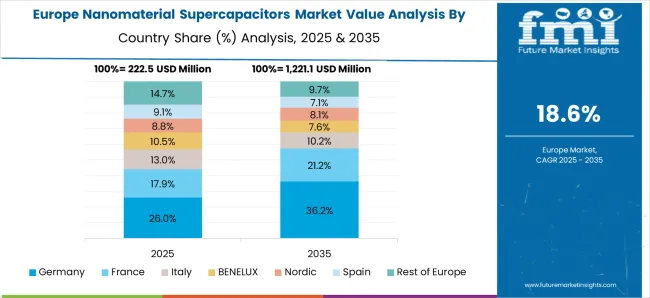
Europe is expected to have a significant nanomaterial supercapacitor market share of 24.2% in 2025. The market is driven by continuous technological advancements in research initiatives.
Moreover, these initiatives in the nanomaterial supercapacitors market are rising the commercialization of nanomaterial supercapacitors.
Manufacturers anticipate the development of adaptable devices to create user-friendly and individualized future interactions between wearable and bio-integrated electronics through the development of new materials and the design of new structures combined with supercomputer simulation and artificial intelligence.
Key businesses are concentrating on a broad range of products as a result of supercapacitors technology improvements that make supercapacitors an effective battery substitute for uses like transportation, smartphones, and more.
For instance:
| Report Attribute | Details |
|---|---|
| Growth Rate | CAGR of 19.6% from 2025 to 2035 |
| Base Year for Estimation | 2025 |
| Historical Data | 2020 to 2024 |
| Forecast Period | 2025 to 2035 |
| Quantitative Units | Revenue in USD Million and CAGR from 2025 to 2035 |
| Report Coverage | Revenue Forecast, Volume Forecast, Company Ranking, Competitive Landscape, Growth Factors, Trends, and Pricing Analysis |
| Segments Covered | Product Type, Application, End-use Industry, Region |
| Regions Covered | North America; Latin America; Western Europe; Eastern Europe; The Asia Pacific excluding Japan; Japan; The Middle East and Africa |
| Key Countries Profiled | USA, Canada, Brazil, Argentina, Germany, United Kingdom, France, Spain, Italy, Nordics, BENELUX, Australia & New Zealand, China, India, GCC Countries, South Africa |
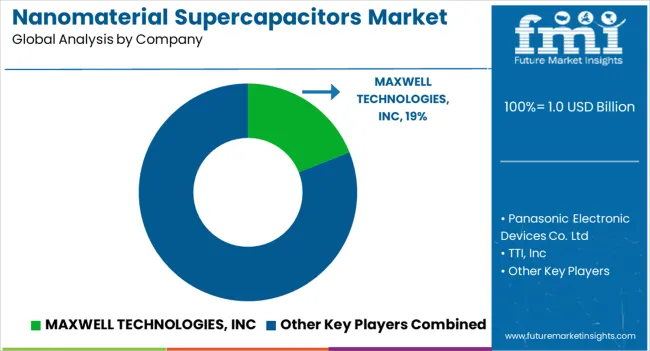
| Key Companies Profiled | Nippon Electrical Co.; Panasonic Electronic Devices Co. Ltd; TTI, Inc; MAXWELL TECHNOLOGIES, INC; Nesscap Co., Ltd; Axion Power International, Inc.; Cap-XX; SPEL; Murata Manufacturing Co., Ltd; About Nanomaterial Supercapacitors |
| Customization | Available Upon Request |
The global nanomaterial supercapacitors market is estimated to be valued at USD 1.0 billion in 2025.
The market size for the nanomaterial supercapacitors market is projected to reach USD 6.2 billion by 2035.
The nanomaterial supercapacitors market is expected to grow at a 19.6% CAGR between 2025 and 2035.
The key product types in nanomaterial supercapacitors market are industrial, consumer and transport.
In terms of application, electric & hybrid vehicles segment to command 38.0% share in the nanomaterial supercapacitors market in 2025.


Our Research Products

The "Full Research Suite" delivers actionable market intel, deep dives on markets or technologies, so clients act faster, cut risk, and unlock growth.

The Leaderboard benchmarks and ranks top vendors, classifying them as Established Leaders, Leading Challengers, or Disruptors & Challengers.

Locates where complements amplify value and substitutes erode it, forecasting net impact by horizon

We deliver granular, decision-grade intel: market sizing, 5-year forecasts, pricing, adoption, usage, revenue, and operational KPIs—plus competitor tracking, regulation, and value chains—across 60 countries broadly.

Spot the shifts before they hit your P&L. We track inflection points, adoption curves, pricing moves, and ecosystem plays to show where demand is heading, why it is changing, and what to do next across high-growth markets and disruptive tech

Real-time reads of user behavior. We track shifting priorities, perceptions of today’s and next-gen services, and provider experience, then pace how fast tech moves from trial to adoption, blending buyer, consumer, and channel inputs with social signals (#WhySwitch, #UX).

Partner with our analyst team to build a custom report designed around your business priorities. From analysing market trends to assessing competitors or crafting bespoke datasets, we tailor insights to your needs.
Supplier Intelligence
Discovery & Profiling
Capacity & Footprint
Performance & Risk
Compliance & Governance
Commercial Readiness
Who Supplies Whom
Scorecards & Shortlists
Playbooks & Docs
Category Intelligence
Definition & Scope
Demand & Use Cases
Cost Drivers
Market Structure
Supply Chain Map
Trade & Policy
Operating Norms
Deliverables
Buyer Intelligence
Account Basics
Spend & Scope
Procurement Model
Vendor Requirements
Terms & Policies
Entry Strategy
Pain Points & Triggers
Outputs
Pricing Analysis
Benchmarks
Trends
Should-Cost
Indexation
Landed Cost
Commercial Terms
Deliverables
Brand Analysis
Positioning & Value Prop
Share & Presence
Customer Evidence
Go-to-Market
Digital & Reputation
Compliance & Trust
KPIs & Gaps
Outputs
Full Research Suite comprises of:
Market outlook & trends analysis
Interviews & case studies
Strategic recommendations
Vendor profiles & capabilities analysis
5-year forecasts
8 regions and 60+ country-level data splits
Market segment data splits
12 months of continuous data updates
DELIVERED AS:
PDF EXCEL ONLINE
Nanomaterials Market Insights - Size, Share & Industry Growth 2025 to 2035
Supercapacitors Market Report - Trends & Industry Outlook through 2034
Peptide Based Nanomaterials Market Size and Share Forecast Outlook 2025 to 2035

Thank you!
You will receive an email from our Business Development Manager. Please be sure to check your SPAM/JUNK folder too.
Chat With
MaRIA