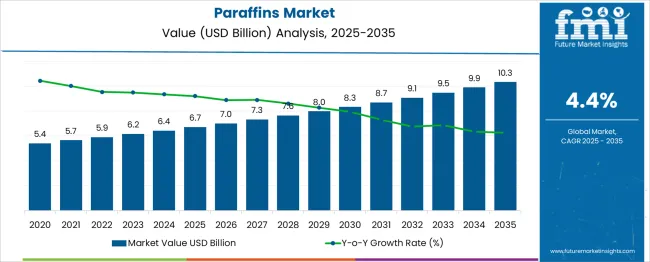
Paraffins Market Snapshot (2022 to 2032)

From 2021 to 2022, the Y-o-Y growth of the global paraffins market is estimated at 3.4%. While the value projection for the year 2022 is USD 6.1 Billion, the market garnered revenue worth USD 5.9 Billion in 2021. With a notable expansion of the key industrial sectors, the global market for paraffins is projected to hold various expansion opportunities and secure USD 9.4 Billion by 2032. The estimated CAGR, from 2022 to 2032, is 4.4%.

The rapid growth of the personal and beauty care sector, owing to the increasing disposable income and swift development of the paper board and packaging industry is expected to play a significant role in driving the global market for paraffins in the forecast period.

Attribute Details
Anticipated Base Year Value (2021) USD 5.9 Billion
Expected Market Value (2022) USD 6.1 Billion
Projected Forecast Value (2032) USD 9.4 Billion
Global Growth Rate (2022 to 2032) 4.4%

Developing regions such as the Asia Pacific are expected to play an important role in driving the global paraffins market growth during the forecast period. Growing demand from the candles and the packaging sector is projected to be the driving cause in the region. Also, the expansion of the personal care industry, owing to the increasing disposable income, is likely to augment the regional and global market size in the forecast period.

Moreover, players are taking various initiatives to expand the industry. In May 2022, the Good Glamm Group announced that it was in advanced talks to acquire Raymond Group’s consumer care business. Such acquisitions are likely to impact the market positively in the coming time. Furthermore, ongoing development in online beauty platforms and increasing expenditure for procuring beauty products are other important factors augmenting the industry expansion in the assessment period.

What are the Major Factors Driving the Global Paraffins Market

The increasing popularity of candles in home décor is expected to play an important role in driving the market for paraffins market during the forecast period. Also, the growing need for scented candles is likely to spur the demand for paraffins, thus, supporting the market expansion during the assessment period.

There has been a significant demand for scented candles among hotels, restaurants, spas, and beauty parlors to devise a therapeutic environment. This is projected to be another potential component, developing the market expansion in the forecast period.

In addition, beneficial initiatives taken by players in the market are projected to play an important role in enlarging the market size in the forthcoming period. In April 2019, Yankee Candle Company rolled out a Sunday Brunch Candle collection. The candle was launched in seven various fragrances such as; vanilla, honey lavender, and others. Such initiatives are expected to increase the demand for Paraffins and propel the industry growth in the forecast period.

Moreover, rapid technological innovations have resulted in the advent of Electric, LED, and battery-powered candles. Such innovations are expected to increase demand for paraffins, thus, augmenting the market size in the coming time. In addition, other varieties, like fancy candles, remote control candles, and others, are predicted to support the market expansion in the forecast period.

Which are the Key Opportunities in the Global Paraffins Market?

Increasing demand for personal care products, especially in emerging economies such as; India, South Korea, and others, is expected to play a crucial role in developing the paraffins market in the forecast period. Increasing disposable income and ease of availability through various distribution channels are expected to enhance demand for cosmetics, thereby, casting a positive impact on the market growth in the forecast period. Also, rapid urbanization and the increasing number of working women are other important factors contributing to the surged demand for paraffins in the forecast period.

Ongoing technical development in the beauty sector is expected to offer various opportunities for expansion in the forthcoming period. Players such as BASF SE and Dow are some of the most active players developing the industry during the forecast period.

Europe has been identified as the most lucrative region for beauty care products, which will augment the market size in the coming time. The domination of Europe can be attributed to the growing demand for personal care products such as; haircare, skincare, and other makeup products. Also, the presence of France, which is a globally renowned hub for fashion, is predicted to be another salient cause in increasing the demand for cosmetics, thereby, propelling the paraffins market size in the assessment period.

In addition, renowned players in the industry are taking various initiatives to expand their reach, which will benefit the market in the assessment period. For instance, in April 2021, Ashland Chemicals announced the acquisition of Schulke & Mayr GmbH, a personal care player. Such initiatives are expected to impact the paraffins demand, and eventually, benefit the industry in the forecast period.

What are the Factors Hindering the Global Paraffins Market?

Concerns about the environment are expected to hamper the market growth during the forecast period. Toxic gases and fumes produced by paraffins wax have a negative impact on human health and on the environment, which is anticipated to hinder the market growth in the forecast period. In order to tackle such issues, eco-friendly products, free of paraffins are launched. This can limit the market growth in the forecast period.

Moreover, fluctuating costs of crude oil and the availability of eco-friendly products are other causes that can hinder market growth in the coming time. However, with various end-user sectors, generating significant demand for paraffins can counter the hampering factors, and assist in the market growth in the forthcoming period.
Region-wise Analysis

North America to Provide Significant Expansion Opportunities in the Long-Run

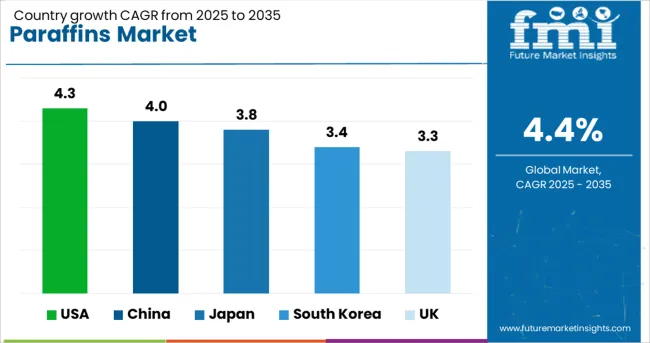
According to Future Market Insights, North America is anticipated to lead the global market. Among all, the USA is projected to lead the market in the assessment period. The region is expected to garner USD 3.2 Billion while recording a CAGR of 4.3% in the assessment period.

Presence of established players in the region such as; Avon, Maybelline, Johnson & Johnson, and Procter & Gamble, among others. Players in the region are making significant investments in R&D, which is expected to benefit the market in the forecast period. For instance, in May 2022, Bobbi Brown and Jones Road launched What the Foundation. Such initiatives are expected to augment the market size in the forecast period.

Also, increasing demand from various end-use industries like candles, rubber, packaging, and board sizing, among others are expected to grow demand for paraffins, thus, driving the market in the forecast period in the region. There has been a significant rise in demand for packaging in food processing, e-commerce, consumer goods, and pharmaceuticals, among others. After the USA, Canada is expected to be the most remunerative industry in the forecast period.

How do Growth Prospects appear for Paraffins in the Asia Pacific?

As per the analysis, Asia Pacific is projected to be the most lucrative market during the forecast period. In the region, China is expected to lead the regional market. China is estimated at USD 700 Million while exhibiting a CAGR of 4% from 2022 to 2032. Other lucrative regions identified are Japan and South Korea. Japan is anticipated at USD 600 Million while South Korea is estimated at USD 300 Million in the forecast period.

The growth of the region can be attributed to the growing demand for products such as candles, packaging, and cosmetics. Also, the presence of South Korea is expected to propel the regional market significantly. South Korea is a globally renowned market for beauty trends and aesthetically appealing packaging. For instance, Face Shop, the South Korean brand, garnered global attention owing to its fine products. The launch of such brands is likely to benefit both global and regional markets.

The packaging industry of India is projected to play a significant role in developing the regional market. The Indian market has made a mark with exceptional exports and imports, which is likely to have made a significant contribution to the regional market. As per the Packaging Industry Association of India, the industry is expanding at a rapid rate of 22-25% annually. Such a swift growth in the packaging industry is likely to enhance demand for paraffins, thereby, expanding the regional market in the forecast period.

Countries Estimated CAGR
USA 4.3%
UK 3.3%
China 4%
Japan 3.8%
South Korea 3.4%

Category-wise Analysis

Based on Type, which Paraffins Segment will dominate?

As per the analysis at FMI, the global paraffins wax segment is expected to lead the market while expanding at a CAGR of 4.1% during the forecast period from 2022 to 2032.

Expansion of the market can be attributed to the increasing demand for paraffins wax in packaging to give the gloss, moisture, grease barriers, and freshness seals. Furthermore, other benefits offered such as; water and water vapor resistance, and gas and odor barrier, among others, are likely to be other factors driving the segmental growth in the forecast period.

Based on the Application, which Paraffins Segment will emerge as the Go-Getter?

As per the analysis, the paper board and packaging segment is expected to record a CAGR of 4% during the forecast period from 2022 to 2032. The development of the segment can be attributed to the rapid growth of the packaging industry.

The demand for paper packaging based on paraffins has increased significantly in e-commerce uses, which is predicted to be another salient factor driving the segmental growth in the assessment period.

Competitive Analysis

Key players in the global paraffins market include Exxon Mobil Corporation, Sasol, LANXESS, China Petroleum & Chemical Corporation, and ENEOS Corporation.

Recent Developments in the Market are as follows:

  • In August 2021, LANXESS acquired Emerald Kalama Chemical for USD 1.04 Billion. The specialty chemicals enterprise, LANXESS accomplished the second-largest history with the takeover of Emerald Kalama Chemical.
  • In March 2022, Sasol, the South African Energy, and Chemical Company sold its German subsidiary Sasol Wax to AWAX S.p.A. The firm is an international group specializing in providing wax products. The enterprise, with two manufacturing units in the UK and Austria, began functioning under the name Hywax GmbH with effect from March 1, 2022.

Key Segments Profiled in the Global Paraffins Market

By Type:

  • Paraffin Wax
  • Liquid
  • Kerosene
  • Petroleum Jelly

By Application:

  • Cosmetics and Personal Care
  • Paperboard and Packaging
  • Fuel
  • Rubber
  • Lubricants
  • Other Applications

By Region:

  • North America
  • Europe
  • Asia Pacific
  • Middle East and Africa
  • Latin America

Table of Content

  • 1. Executive Summary | Paraffins Market
  • 2. Market Overview
  • 3. Market Risks and Trends Assessment
  • 4. Market Background and Foundation Data Points
  • 5. Key Success Factors
  • 6. Global Market Demand Analysis 2015 to 2021 and Forecast, 2022 to 2032
  • 7. Global Market Value Analysis 2015 to 2021 and Forecast, 2022 to 2032
  • 8. Global Market Analysis 2015 to 2021 and Forecast 2022 to 2032, By Type
    • 8.1. Paraffin Wax
    • 8.2. Liquid Paraffin
    • 8.3. Kerosene
    • 8.4. Petroleum Jelly
  • 9. Global Market Analysis 2015 to 2021 and Forecast 2022 to 2032, By Application
    • 9.1. Cosmetics and Personal Care
    • 9.2. Paperboard and Packaging
    • 9.3. Fuel
    • 9.4. Rubber
    • 9.5. Lubricants
    • 9.6. Other Applications
  • 10. Global Market Analysis 2015 to 2021 and Forecast 2022 to 2032, By Region
    • 10.1. North America
    • 10.2. Latin America
    • 10.3. Europe
    • 10.4. Asia Pacific
    • 10.5. Middle East and Africa (MEA)
  • 11. North America Market Analysis 2015 to 2021 and Forecast 2022 to 2032
  • 12. Latin America Market Analysis 2015 to 2021 and Forecast 2022 to 2032
  • 13. Europe Market Analysis 2015 to 2021 and Forecast 2022 to 2032
  • 14. Asia Pacific Market Analysis 2015 to 2021 and Forecast 2022 to 2032
  • 15. Middle East and Africa Market Analysis 2015 to 2021 and Forecast 2022 to 2032
  • 16. Key Countries Market Analysis 2015 to 2021 and Forecast 2022 to 2032
  • 17. Market Structure Analysis
  • 18. Competition Analysis
    • 18.1. Aromachimie Ltd
    • 18.2. Calumet Specialty Products Partners LP
    • 18.3. Cepsa
    • 18.4. China National Petroleum Corporation
    • 18.5. China Petroleum & Chemical Corporation
    • 18.6. ENEOS Corporation
    • 18.7. Exxon Mobil Corporation
    • 18.8. H&R GROUP
    • 18.9. HollyFrontier Refining & Marketing LLC
    • 18.10. Indian Oil Corporation Ltd
    • 18.11. Kemipex
    • 18.12. LANXESS
    • 18.13. NIPPON SEIRO CO. LTD
    • 18.14. PersiaParaffin
    • 18.15. Petrobras
    • 18.16. Repsol
    • 18.17. Sasol
    • 18.18. The International Group Inc.
  • 19. Research Methodology

List of Tables

Table 1: Global Market Value (US$ Million), By Type, 2015 to 2021

Table 2: Global Market Value (US$ Million), By Type, 2022 to 2032

Table 3: Global Market Value (US$ Million), By Application, 2015 to 2021

Table 4: Global Market Value (US$ Million), By Application, 2022 to 2032

Table 5: Global Market, By Region, 2015 to 2021

Table 6: Global Market, By Region, 2022 to 2032

Table 7: North America Market Value (US$ Million), By Type, 2015 to 2021

Table 8: North America Market Value (US$ Million), By Type, 2022 to 2032

Table 9: North America Market Value (US$ Million), By Application, 2015 to 2021

Table 10: North America Market Value (US$ Million), By Application, 2022 to 2032

Table 11: North America Market, By Country, 2015 to 2021

Table 12: North America Market, By Country, 2022 to 2032

Table 13: Latin America Market Value (US$ Million), By Type, 2015 to 2021

Table 14: Latin America Market Value (US$ Million), By Type, 2022 to 2032

Table 15: Latin America Market Value (US$ Million), By Application, 2015 to 2021

Table 16: Latin America Market Value (US$ Million), By Application, 2022 to 2032

Table 17: Latin America Market, By Country, 2015 to 2021

Table 18: Latin America Market, By Country, 2022 to 2032

Table 19: Europe Market Value (US$ Million), By Type, 2015 to 2021

Table 20: Europe Market Value (US$ Million), By Type, 2022 to 2032

Table 21: Europe Market Value (US$ Million), By Application, 2015 to 2021

Table 22: Europe Market Value (US$ Million), By Application, 2022 to 2032

Table 23: Europe Market, By Country, 2015 to 2021

Table 24: Europe Market, By Country, 2022 to 2032

Table 25: Asia Pacific Market Value (US$ Million), By Type, 2015 to 2021

Table 26: Asia Pacific Market Value (US$ Million), By Type, 2022 to 2032

Table 27: Asia Pacific Market Value (US$ Million), By Application, 2015 to 2021

Table 28: Asia Pacific Market Value (US$ Million), By Application, 2022 to 2032

Table 29: Asia Pacific Market, By Country, 2015 to 2021

Table 30: Asia Pacific Market, By Country, 2022 to 2032

Table 31: MEA Market Value (US$ Million), By Type, 2015 to 2021

Table 32: MEA Market Value (US$ Million), By Type, 2022 to 2032

Table 33: MEA Market Value (US$ Million), By Application, 2015 to 2021

Table 34: MEA Market Value (US$ Million), By Application, 2022 to 2032

Table 35: MEA Market, By Country, 2015 to 2021

Table 36: MEA Market, By Country, 2022 to 2032

Table 37: Global Market Incremental $ Opportunity, By Type, 2015 to 2021

Table 38: Global Market Incremental $ Opportunity, By Application, 2022 to 2032

Table 39: Global Market Incremental $ Opportunity, By Region, 2022 to 2032

Table 40: North America Market Incremental $ Opportunity, By Type, 2015 to 2021

Table 41: North America Market Incremental $ Opportunity, By Application, 2022 to 2032

Table 42: North America Market Incremental $ Opportunity, By Country, 2022 to 2032

Table 43: Latin America Market Incremental $ Opportunity, By Type, 2015 to 2021

Table 44: Latin America Market Incremental $ Opportunity, By Application, 2022 to 2032

Table 45: Latin America Market Incremental $ Opportunity, By Country, 2022 to 2032

Table 46: Europe Market Incremental $ Opportunity, By Type, 2015 to 2021

Table 47: Europe Market Incremental $ Opportunity, By Application, 2022 to 2032

Table 48: Europe Market Incremental $ Opportunity, By Country, 2022 to 2032

Table 49: Asia Pacific Market Incremental $ Opportunity, By Type, 2015 to 2021

Table 50: Asia Pacific Market Incremental $ Opportunity, By Application, 2022 to 2032

Table 51: Asia Pacific Market Incremental $ Opportunity, By Country, 2022 to 2032

Table 52: MEA Market Incremental $ Opportunity, By Type, 2015 to 2021

Table 53: MEA Market Incremental $ Opportunity, By Application, 2022 to 2032

Table 54: MEA Market Incremental $ Opportunity, By Country, 2022 to 2032

List of Figures

Figure 1: Global Market Value (US$ Million) and Year-on-Year Growth, 2015 to 2032

Figure 2: Global Market Absolute $ Historical Gain (2015 to 2021) and Opportunity (2022 to 2032), US$ Million

Figure 3: Global Market Share, By Type, 2022 & 2032

Figure 4: Global Market Y-o-Y Growth Projections, By Type - 2022 to 2032

Figure 5: Global Market Attractiveness Index, By Type - 2022 to 2032

Figure 6: Global Market Share, By Application, 2022 & 2032

Figure 7: Global Market Y-o-Y Growth Projections, By Application - 2022 to 2032

Figure 8: Global Market Attractiveness Index, By Application - 2022 to 2032

Figure 9: Global Market Share, By Region, 2022 & 2032

Figure 10: Global Market Y-o-Y Growth Projections, By Region - 2022 to 2032

Figure 11: Global Market Attractiveness Index, By Region - 2022 to 2032

Figure 12: North America Market Value (US$ Million) and Year-on-Year Growth, 2015 to 2032

Figure 13: North America Market Absolute $ Opportunity Historical (2015 to 2021) and Forecast Period (2022 to 2032), US$ Million

Figure 14: North America Market Share, By Type, 2022 & 2032

Figure 15: North America Market Y-o-Y Growth Projections, By Type - 2022 to 2032

Figure 16: North America Market Attractiveness Index, By Type - 2022 to 2032

Figure 17: North America Market Share, By Application, 2022 & 2032

Figure 18: North America Market Y-o-Y Growth Projections, By Application - 2022 to 2032

Figure 19: North America Market Attractiveness Index, By Application - 2022 to 2032

Figure 20: North America Market Share, By Country, 2022 & 2032

Figure 21: North America Market Y-o-Y Growth Projections, By Country - 2022 to 2032

Figure 22: North America Market Attractiveness Index, By Country - 2022 to 2032

Figure 23: Latin America Market Value (US$ Million) and Year-on-Year Growth, 2015 to 2032

Figure 24: Latin America Market Absolute $ Opportunity Historical (2015 to 2021) and Forecast Period (2022 to 2032), US$ Million

Figure 25: Latin America Market Share, By Type, 2022 & 2032

Figure 26: Latin America Market Y-o-Y Growth Projections, By Type - 2022 to 2032

Figure 27: Latin America Market Attractiveness Index, By Type - 2022 to 2032

Figure 28: Latin America Market Share, By Application, 2022 & 2032

Figure 29: Latin America Market Y-o-Y Growth Projections, By Application - 2022 to 2032

Figure 30: Latin America Market Attractiveness Index, By Application - 2022 to 2032

Figure 31: Latin America Market Share, By Country, 2022 & 2032

Figure 32: Latin America Market Y-o-Y Growth Projections, By Country - 2022 to 2032

Figure 33: Latin America Market Attractiveness Index, By Country - 2022 to 2032

Figure 34: Europe Market Value (US$ Million) and Year-on-Year Growth, 2015 to 2032

Figure 35: Europe Market Absolute $ Opportunity Historical (2015 to 2021) and Forecast Period (2022 to 2032), US$ Million

Figure 36: Europe Market Share, By Type, 2022 & 2032

Figure 37: Europe Market Y-o-Y Growth Projections, By Type - 2022 to 2032

Figure 38: Europe Market Attractiveness Index, By Type - 2022 to 2032

Figure 39: Europe Market Share, By Application, 2022 & 2032

Figure 40: Europe Market Y-o-Y Growth Projections, By Application - 2022 to 2032

Figure 41: Europe Market Attractiveness Index, By Application - 2022 to 2032

Figure 42: Europe Market Share, By Country, 2022 & 2032

Figure 43: Europe Market Y-o-Y Growth Projections, By Country - 2022 to 2032

Figure 44: Europe Market Attractiveness Index, By Country - 2022 to 2032

Figure 45: MEA Market Value (US$ Million) and Year-on-Year Growth, 2015 to 2032

Figure 46: MEA Market Absolute $ Opportunity Historical (2015 to 2021) and Forecast Period (2022 to 2032), US$ Million

Figure 47: MEA Market Share, By Type, 2022 & 2032

Figure 48: MEA Market Y-o-Y Growth Projections, By Type - 2022 to 2032

Figure 49: MEA Market Attractiveness Index, By Type - 2022 to 2032

Figure 50: MEA Market Share, By Application, 2022 & 2032

Figure 51: MEA Market Y-o-Y Growth Projections, By Application - 2022 to 2032

Figure 52: MEA Market Attractiveness Index, By Application - 2022 to 2032

Figure 53: MEA Market Share, By Country, 2022 & 2032

Figure 54: MEA Market Y-o-Y Growth Projections, By Country - 2022 to 2032

Figure 55: MEA Market Attractiveness Index, By Country - 2022 to 2032

Figure 56: Asia Pacific Market Value (US$ Million) and Year-on-Year Growth, 2015 to 2032

Figure 57: Asia Pacific Market Absolute $ Opportunity Historical (2015 to 2021) and Forecast Period (2022 to 2032), US$ Million

Figure 58: Asia Pacific Market Share, By Type, 2022 & 2032

Figure 59: Asia Pacific Market Y-o-Y Growth Projections, By Type - 2022 to 2032

Figure 60: Asia Pacific Market Attractiveness Index, By Type - 2022 to 2032

Figure 61: Asia Pacific Market Share, By Application, 2022 & 2032

Figure 62: Asia Pacific Market Y-o-Y Growth Projections, By Application - 2022 to 2032

Figure 63: Asia Pacific Market Attractiveness Index, By Application - 2022 to 2032

Figure 64: Asia Pacific Market Share, By Country, 2022 & 2032

Figure 65: Asia Pacific Market Y-o-Y Growth Projections, By Country - 2022 to 2032

Figure 66: Asia Pacific Market Attractiveness Index, By Country - 2022 to 2032

Figure 67: USA Market Value (US$ Million) and Forecast, 2022 to 2032

Figure 68: USA Market Share, By Type, 2021

Figure 69: USA Market Share, By Application, 2021

Figure 70: Canada Market Value (US$ Million) and Forecast, 2022 to 2032

Figure 71: Canada Market Share, By Type, 2021

Figure 72: Canada Market Share, By Application, 2021

Figure 73: Brazil Market Value (US$ Million) and Forecast, 2022 to 2032

Figure 74: Brazil Market Share, By Type, 2021

Figure 75: Brazil Market Share, By Application, 2021

Figure 76: Mexico Market Value (US$ Million) and Forecast, 2022 to 2032

Figure 77: Mexico Market Share, By Type, 2021

Figure 78: Mexico Market Share, By Application, 2021

Figure 79: Germany Market Value (US$ Million) and Forecast, 2022 to 2032

Figure 80: Germany Market Share, By Type, 2021

Figure 81: Germany Market Share, By Application, 2021

Figure 82: UK Market Value (US$ Million) and Forecast, 2022 to 2032

Figure 83: UK Market Share, By Type, 2021

Figure 84: UK Market Share, By Application, 2021

Figure 85: France Market Value (US$ Million) and Forecast, 2022 to 2032

Figure 86: France Market Share, By Type, 2021

Figure 87: France Market Share, By Application, 2021

Figure 88: Italy Market Value (US$ Million) and Forecast, 2022 to 2032

Figure 89: Italy Market Share, By Type, 2021

Figure 90: Italy Market Share, By Application, 2021

Figure 91: BENELUX Market Value (US$ Million) and Forecast, 2022 to 2032

Figure 92: BENELUX Market Share, By Type, 2021

Figure 93: BENELUX Market Share, By Application, 2021

Figure 94: Nordic Countries Market Value (US$ Million) and Forecast, 2022 to 2032

Figure 95: Nordic Countries Market Share, By Type, 2021

Figure 96: Nordic Countries Market Share, By Application, 2021

Figure 97: China Market Value (US$ Million) and Forecast, 2022 to 2032

Figure 98: China Market Share, By Type, 2021

Figure 99: China Market Share, By Application, 2021

Figure 100: Japan Market Value (US$ Million) and Forecast, 2022 to 2032

Figure 101: Japan Market Share, By Type, 2021

Figure 102: Japan Market Share, By Application, 2021

Figure 103: South Korea Market Value (US$ Million) and Forecast, 2022 to 2032

Figure 104: South Korea Market Share, By Type, 2021

Figure 105: South Korea Market Share, By Application, 2021

Figure 106: GCC Countries Market Value (US$ Million) and Forecast, 2022 to 2032

Figure 107: GCC Countries Market Share, By Type, 2021

Figure 108: GCC Countries Market Share, By Application, 2021

Figure 109: South Africa Market Value (US$ Million) and Forecast, 2022 to 2032

Figure 110: South Africa Market Share, By Type, 2021

Figure 111: South Africa Market Share, By Application, 2021

Figure 112: Turkey Market Value (US$ Million) and Forecast, 2022 to 2032

Figure 113: Turkey Market Share, By Type, 2021

Figure 114: Turkey Market Share, By Application, 2021

Frequently Asked Questions

What is the anticipated market value of the global paraffins market during the forecast period?

The global paraffins market is estimated to garner USD 9.4 Billion by 2032

What is the expected CAGR of the global paraffins market during the forecast period?

The global paraffins market is estimated at 4.4% during the forecast period

What is the projected market size of the USA?

The USA is anticipated to be valued at USD 3.2 Billion by 2032, with regard to paraffins sales

What is the projected market value of the global paraffins market in 2022?

The global paraffins market is likely to hold a value of USD 6.1 Billion as of 2022

What is the estimated CAGR of China?

China is predicted to record a CAGR of 4% in the assessment period

What is the expected market size of China by 2032?

China is projected to procure a market value of USD 700 Million by 2032

What is the role of the paper board and packaging in boosting the Global Paraffins Market?

The segment is projected to record a CAGR of 4% in the forecast period

Based on type, which segment is expected to play an important role?

The paraffins wax segment is anticipated to witness a CAGR of 4.1% in the forecast period.

Future Market Insights

Paraffins Market