The paraffin wax market is advancing steadily, supported by consistent demand across both industrial and consumer-facing applications. Developments in packaging, cosmetics, and surface coatings have driven sustained consumption, while product innovations in fragrance-infused and decorative candles have reinforced paraffin wax’s commercial relevance.
Energy sector updates and petrochemical industry reports have pointed to stable paraffin wax supply, particularly in regions with established crude oil refining operations. Moreover, industry players have focused on refining efficiency, enabling the production of high-purity wax grades tailored for food-safe and pharmaceutical applications.
In developing economies, growth in construction and packaging sectors has supported the usage of paraffin wax in insulation boards, waterproofing materials, and corrugated containers. Looking forward, the market is expected to be shaped by product diversification, heightened demand for clean-burning waxes, and expanding downstream applications. Segmental performance is expected to be driven by fully refined waxes due to their high purity and versatility, and by the candles segment, which continues to account for a large share of paraffin wax consumption due to cultural, decorative, and utility-based usage.
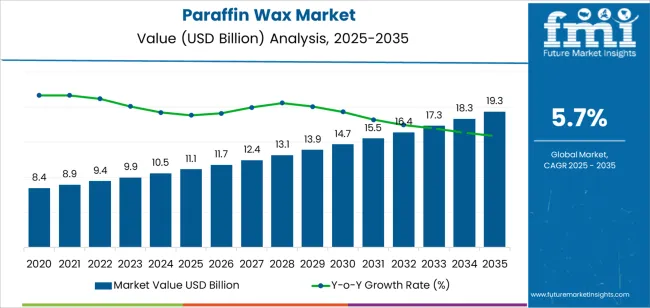
| Metric | Value |
|---|---|
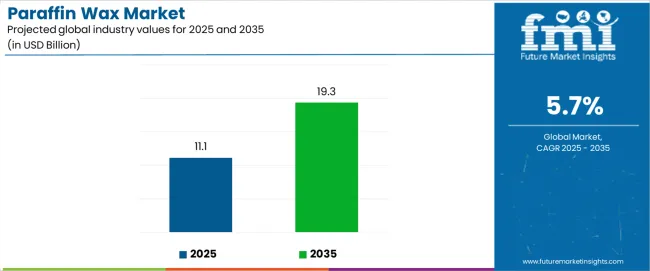
| Paraffin Wax Market Estimated Value in (2025 E) | USD 11.1 billion |
| Paraffin Wax Market Forecast Value in (2035 F) | USD 19.3 billion |
| Forecast CAGR (2025 to 2035) | 5.7% |
The market is segmented by Product Type and Application and region. By Product Type, the market is divided into Fully Refined, Semi Refined, and Others. In terms of Application, the market is classified into Candles, Packaging, Cosmetics, Hot Melt, Board Sizing, and Rubber. Regionally, the market is classified into North America, Latin America, Western Europe, Eastern Europe, Balkan & Baltic Countries, Russia & Belarus, Central Asia, East Asia, South Asia & Pacific, and the Middle East & Africa.
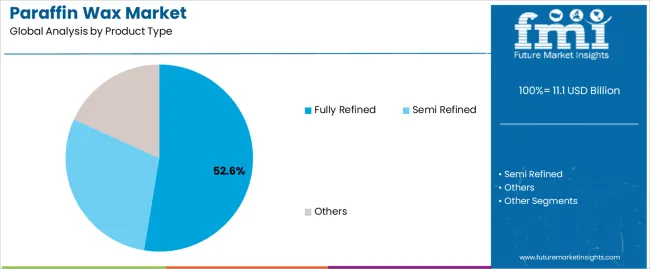
The Fully Refined segment is projected to hold 52.6% of the paraffin wax market revenue in 2025, establishing itself as the leading product type. This dominance has been driven by its superior purity, characterized by extremely low oil content and odorless, colorless properties, which make it ideal for sensitive applications.
Industries such as cosmetics, pharmaceuticals, and food packaging have favored fully refined wax due to its compliance with stringent regulatory standards. The ability of fully refined paraffin wax to deliver consistent performance in formulations, coatings, and molded products has reinforced its widespread adoption.
Additionally, the segment has benefited from the growing demand for aesthetically appealing and smokeless candles, which require high-grade wax to ensure clean combustion. Manufacturers have also scaled up production of fully refined waxes to meet the quality expectations of international markets, further strengthening the segment’s position. As end-user industries increasingly prioritize quality and purity, the Fully Refined segment is expected to retain its lead in the market.
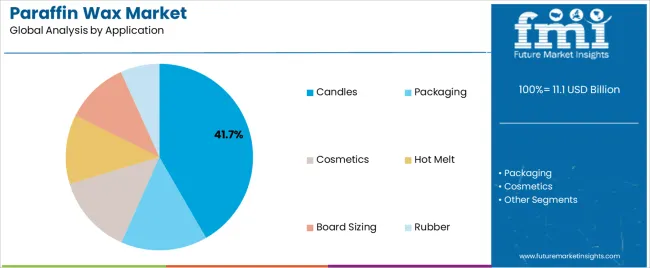
The Candles segment is expected to contribute 41.7% of the paraffin wax market revenue in 2025, maintaining its status as the dominant application area. This growth has been fueled by continued consumer interest in decorative, aromatic, and religious candles across developed and emerging markets.
Paraffin wax remains the material of choice for candle production due to its consistent burn quality, moldability, and scent-holding capacity. Lifestyle shifts toward home décor, aromatherapy, and wellness have spurred the popularity of premium and artisanal candles, further amplifying demand. Retail expansion and seasonal gifting trends have also played a key role in driving candle sales.
Additionally, innovations in wick design and fragrance delivery systems have supported the use of paraffin wax in high-end candle lines. Despite the emergence of alternative waxes, paraffin continues to dominate due to its availability, cost-effectiveness, and performance consistency. The segment is projected to grow steadily, supported by evolving consumer preferences and expanding product offerings in the global home fragrance and ambiance segment.
The table below presents the expected CAGR for the sector over several semi-annual periods spanning from 2025 to 2035. In the first half (H1) of the decade from 2025 to 2035, the business is predicted to surge at a CAGR of 5.9%, followed by a slightly lower growth rate of 5.6% in the second half (H2) of the same decade.
| Particular | Value CAGR |
|---|---|
| H1(2025 to 2035) | 5.9% |
| H2(2025 to 2035) | 5.6% |
| H1(2025 to 2035) | 6.3% |
| H2(2025 to 2035) | 5.7% |
Moving into the subsequent period, from H1 2025 to H2 2035, the CAGR is projected to surge slightly to 6.3% in the first half and remain relatively considerable at 5.7% in the second half.
Impact of Sustainability Trends on the Paraffin Wax Market
The global environmental movement is progressively shifting towards renewable and sustainable alternatives to paraffin wax, including soy wax and beeswax. Consumers are increasingly seeking eco-friendly products, prompting manufacturers to discover and invest in alternative wax formulations.
Increasing Demand for Paraffin in the Packaging Sector Worldwide
Manufacturers are prioritizing product differentiation and marketing strategies in a competitive landscape, including branding, packaging innovations, and value-added products. Emerging economies are experiencing increased industrialization and urbanization, leading to a surge in demand for paraffin wax in the packaging, cosmetics, and candles industries.
Technological Advancements in Wax Production and Refinement
Advancements in refining technologies have enabled manufacturers to produce high-quality wax with improved purity and consistency, intensifying its application in pharmaceuticals and food packaging. Demand for customized specialty wax products is rising, leading manufacturers to invest in research and development to innovate new formulations and grades.
Market Opportunities for Eco-friendly and Biodegradable Paraffin Wax Alternatives
Paraffin wax has the potential to grow applications in both traditional and emerging industries, particularly in agriculture and renewable energy. Moisture resistance and insulation properties of paraffin wax are used to coat seeds for moisture protection and phase change materials for thermal energy storage. Manufacturers are set to capitalize on this by investing in research and development to develop new formulations and grades with enhanced properties, such as higher melting points and improved stability.
Fluctuations in Crude Oil Prices to Impede Growth
Paraffin wax faces competition from eco-friendly alternatives like soy, beeswax, and palm wax, which are perceived as sustainable. The availability of substitutes and changing consumer preferences for natural products pose challenges to growth. Paraffin wax's production costs are susceptible to fluctuations in crude oil prices, affecting manufacturers' cost structures and restraining growth.
The paraffin wax sector grew at a CAGR of 3.3% from 2020 and 2025. The market reached USD 11.1 million in 2025. The sector has experienced steady growth between 2020 and 2025, driven by the growing industrial usage of wax in sectors such as packaging, cosmetics, and pharmaceuticals.
The industry’s growth trajectory has been influenced by factors such as population growth, urbanization, and industrialization, particularly in emerging economies. By 2025, paraffin wax emerged as a popular choice for candle-making due to its low cost, ease of use, and ability to hold fragrance. However, the sector experienced fluctuations in demand due to changing consumer preferences and the emergence of alternative candle materials.
The packaging industry also played a significant role in fueling demand for paraffin wax, as it was used for coating paper or cardboard to provide moisture resistance and enhance packaging aesthetics. The cosmetics and pharmaceutical industries emerged as key consumers of paraffin, utilizing its properties in various products such as creams, ointments, and lip balms. However, the wax business faced challenges related to environmental concerns, regulatory scrutiny, and fluctuating demand in end-use industries.
The volatility of crude oil prices has impacted production costs and pricing strategies, affecting dynamics and profitability for industry players. Addressing these challenges and adapting to changing dynamics remain essential for the future sustainability and growth of the paraffin wax market. The sector is predicted to reach USD 19.3 million in 2035.
Tier 1 companies comprise industry leaders with a revenue of above USD 25 million, capturing a significant share of 32% globally. Prominent companies within Tier 1 include ExxonMobil, Sasol Limited, Sinopec, Royal Dutch Shell, Petrobras, Repsol, Numaligarh Refinery Limited (NRL), HollyFrontier Corporation, Indian Oil Corporation Limited (IOCL), and CEPSA.
Tier 1 companies are experiencing growth due to increased demand for cosmetics, packaging, and candles, innovative product development, and expansion into new regions. Their strong brand recognition, extensive distribution networks, and strategic partnerships further enhance position and growth prospects.
Tier 2 companies include mid-size players with revenue of USD 5 to 25 million, capturing 40% of the market share. Prominent companies in Tier 2 include Petrobras, Nippon Seiro Co., Ltd, Petro-Canada, Repsol, and H&R Group.
Tier 2 companies are focusing on research and development to introduce innovative paraffin wax formulations, enhancing performance, sustainability, and cost-effectiveness. They are also forming strategic partnerships with suppliers, distributors, and end-users to grow reach and access new regions.
Tier 2 companies prioritize customer service, offering personalized support, technical assistance, and flexible solutions to meet customer needs and build long-term relationships, setting them apart from larger competitors.
Tier 3 includes most of the small-scale companies operating locally and serving niche businesses with revenue of up to USD 5 million. These companies are capturing a significant share of 28%.
Tier 3 companies often have a strong local presence, leveraging relationships with local customers, distributors, and suppliers. This allows them to respond to industry changes or opportunities quickly.
They excel in providing customized solutions and flexible services, accommodating special requests, producing small batches, and providing personalized service. This ability to tailor offerings to meet individual customer needs can be a significant competitive advantage, making them a valuable asset in the sector.
The section below depicts the paraffin wax market share and size across various countries. The section evaluates the latest trends of the industry in leading countries.
India and China have emerged as the prominent countries in the sector and are estimated to experience considerable CAGRs of 8.5% and 6.4%, respectively, through 2035. The report provides a comprehensive regional analysis of the industry, detailing current trends, growth drivers, and challenges for companies to identify suitable investment locations.
| Countries | CAGR 2025 to 2035 |
|---|---|
| United States | 3.2% |
| Spain | 4.3% |
| China | 6.4% |
| France | 4% |
| India | 8.5% |
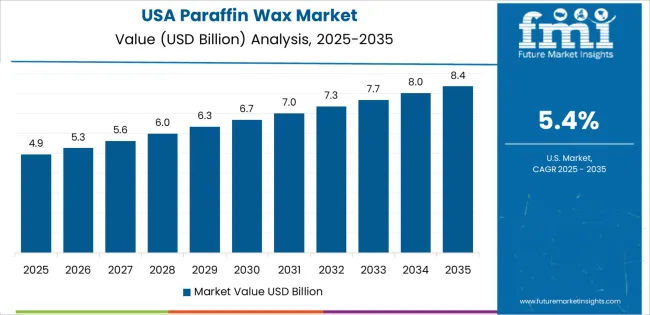
In North America, the United States is set to rise at 3.2% CAGR by 2035. The country is experiencing a rise in demand for sustainable alternatives, with consumers increasingly turning to natural waxes like soy wax and beeswax. Manufacturers in the United States are promoting sustainable wax products to meet this demand.
Technological advancements have enabled the development of specialized paraffin wax formulations in the United States. Regulatory compliance and safety standards are also vital trends in the paraffin wax landscape.
Manufacturers are expected to adhere to regulations set by agencies like the FDA and EPA to ensure product safety and environmental sustainability. This includes adhering to labeling requirements, ensuring product purity, and minimizing environmental impact during production and disposal.
Technological advancements in refining and production processes are fueling innovation, resulting in high-quality wax with enhanced characteristics like purity, consistency, and melting point. This allows manufacturers to meet evolving customer needs and grow share.
India is witnessing consolidation as key companies seek to strengthen competitive position through mergers, acquisitions, and strategic alliances. This combines resources and capabilities to achieve economies of scale, streamline operations, and enhance product offerings.
As competition in the market increases, manufacturers are investing in product differentiation and branding strategies to create brand awareness and attract discerning customers. By 2035, India is projected to rise at 8.5% CAGR.
Manufacturers are investing in alternative wax formulations like soy wax and palm wax to meet consumer demand for eco-friendly products. Government regulations and policies play a significant role in shaping the wax sector in China, focusing on environmental protection, product safety, and quality standards.
Rising applications in emerging industries like agriculture, pharmaceuticals, and energy storage are also gaining traction. Paraffin wax is utilized in seed coating, pharmaceuticals, and as a phase change material for thermal energy storage, enhancing germination rates, and moisture retention. International trade dynamics, including tariffs, import-export regulations, and geopolitical factors, influence China's significant role in the landscape.
The section provides information regarding the leading segments in the industry. The section has details regarding the anticipated growth rates that are set to help companies identify the dominating sectors and invest accordingly.
Based on product type, the fully refined segment is leading with a share of 62.9% in 2025. By application, the candle segment is dominating the business with a value share of 40.5% in 2025.
| Segment | Fully Refined (Product Type) |
|---|---|
| Value Share (2025) | 62.9% |
Demand for fully refined wax is on the rise in premium industries like cosmetics, pharmaceuticals, and food packaging due to consumers' increasing quality-consciousness. Customized formulations are also emerging, with manufacturers investing in research and development to innovate new grades with enhanced properties.
The fully refined wax is subject to stringent quality standards and regulatory compliance, especially in the pharmaceuticals sector. Manufacturers are investing in quality control measures and adherence to regulatory guidelines to ensure consistent purity and performance of paraffin wax.
Technological advancements in refining processes are fueling innovation, enabling manufacturers to achieve higher levels of purity and consistency in products. Advanced techniques like solvent extraction, hydrogenation, and molecular distillation are being employed to remove impurities and enhance the quality of fully refined wax.
| Segment | Candles (Application) |
|---|---|
| Value Share (2025) | 40.5% |
Candle manufacturers are focusing on innovation in candle designs, shapes, and formulations to cater to changing lifestyle trends. Paraffin wax is preferred for its ability to hold fragrance and achieve consistent burning characteristics in various candle formulations.
The rise of e-commerce and direct-to-consumer sales has transformed the candle demand, allowing smaller candle makers and independent artisans to reach a wider audience. E-commerce platforms provide opportunities for niche candle brands to differentiate themselves and target specific consumer segments with innovative candle offerings.
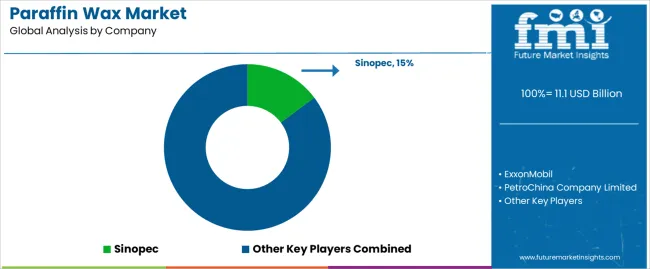
Sinopec, ExxonMobil, PetroChina Company Limited, Sasol, CEPSA, Honeywell, and Petrobras are the key players in the paraffin wax industry. Strategic initiatives, innovation, sustainability, and collaboration among leading players characterize the market. Key companies are investing in research to innovate new products and meet industry developments while also utilizing partnerships and acquisitions to grow presence.
Leading companies are also investing in sustainable practices to align with environmental concerns. The global competition for wax is heavily influenced by product quality, raw material availability, and geographic locations. Manufacturers in the business are continuously conducting research and development to develop and innovate quality product ranges.
The industry is fragmented and diversified, with numerous key participants. Mergers and acquisitions are essential in determining the strategic initiatives of leading manufacturers. The sector is evaluated based on product offerings, financial statements, key developments, strategic approach, industry position, geographical penetration, and other key features.
Industry Updates
The landscape is categorized into three leading product types: fully refined, semi-refined, and others.
A few key applications include candles, packaging, cosmetics, hot melt, board sizing, and rubber.
Information about key countries of North America, Latin America, Western Europe, Eastern Europe, East Asia, South Asia, and the Middle East and Africa is given.
The global paraffin wax market is estimated to be valued at USD 11.1 billion in 2025.
The market size for the paraffin wax market is projected to reach USD 19.3 billion by 2035.
The paraffin wax market is expected to grow at a 5.7% CAGR between 2025 and 2035.
The key product types in paraffin wax market are fully refined, semi refined and others.
In terms of application, candles segment to command 41.7% share in the paraffin wax market in 2025.


Our Research Products

The "Full Research Suite" delivers actionable market intel, deep dives on markets or technologies, so clients act faster, cut risk, and unlock growth.

The Leaderboard benchmarks and ranks top vendors, classifying them as Established Leaders, Leading Challengers, or Disruptors & Challengers.

Locates where complements amplify value and substitutes erode it, forecasting net impact by horizon

We deliver granular, decision-grade intel: market sizing, 5-year forecasts, pricing, adoption, usage, revenue, and operational KPIs—plus competitor tracking, regulation, and value chains—across 60 countries broadly.

Spot the shifts before they hit your P&L. We track inflection points, adoption curves, pricing moves, and ecosystem plays to show where demand is heading, why it is changing, and what to do next across high-growth markets and disruptive tech

Real-time reads of user behavior. We track shifting priorities, perceptions of today’s and next-gen services, and provider experience, then pace how fast tech moves from trial to adoption, blending buyer, consumer, and channel inputs with social signals (#WhySwitch, #UX).

Partner with our analyst team to build a custom report designed around your business priorities. From analysing market trends to assessing competitors or crafting bespoke datasets, we tailor insights to your needs.
Supplier Intelligence
Discovery & Profiling
Capacity & Footprint
Performance & Risk
Compliance & Governance
Commercial Readiness
Who Supplies Whom
Scorecards & Shortlists
Playbooks & Docs
Category Intelligence
Definition & Scope
Demand & Use Cases
Cost Drivers
Market Structure
Supply Chain Map
Trade & Policy
Operating Norms
Deliverables
Buyer Intelligence
Account Basics
Spend & Scope
Procurement Model
Vendor Requirements
Terms & Policies
Entry Strategy
Pain Points & Triggers
Outputs
Pricing Analysis
Benchmarks
Trends
Should-Cost
Indexation
Landed Cost
Commercial Terms
Deliverables
Brand Analysis
Positioning & Value Prop
Share & Presence
Customer Evidence
Go-to-Market
Digital & Reputation
Compliance & Trust
KPIs & Gaps
Outputs
Full Research Suite comprises of:
Market outlook & trends analysis
Interviews & case studies
Strategic recommendations
Vendor profiles & capabilities analysis
5-year forecasts
8 regions and 60+ country-level data splits
Market segment data splits
12 months of continuous data updates
DELIVERED AS:
PDF EXCEL ONLINE
Waxed Paper Market Size and Share Market Forecast and Outlook 2025 to 2035
Waxing Base Paper Market Size and Share Forecast Outlook 2025 to 2035
Wax Injector Market Size and Share Forecast Outlook 2025 to 2035
Paraffinic Transformer Oil Market Size and Share Forecast Outlook 2025 to 2035
Paraffin Physical Therapy Market Size and Share Forecast Outlook 2025 to 2035
Paraffins Market Size and Share Forecast Outlook 2025 to 2035
Wax Paper Medicine Pots Market Size and Share Forecast Outlook 2025 to 2035
Wax Boxes Market Insights - Growth & Demand Forecast 2025 to 2035
Wax-coated Paper Market
Waxed Paper Packaging Market
Paraffin Inhibitors Market
Earwax Removal Market Analysis by Product, Age Group, Distribution Channel, and Region Forecast Through 2035
Bio-wax Market Size and Share Forecast Outlook 2025 to 2035
Beeswax for Cosmetics Market Size and Share Forecast Outlook 2025 to 2035
Ear Wax Removal Products Market Size and Share Forecast Outlook 2025 to 2035
Car Wax Market Outlook – Demand, Size & Industry Trends 2025-2035
Beeswax Market
Cold Waxed Paper Cups Market Size and Share Forecast Outlook 2025 to 2035
Assessing Cold Waxed Paper Cups Market Share & Industry Trends
Global Bees Wax Wrap Market Growth – Trends & Forecast 2024-2034

Thank you!
You will receive an email from our Business Development Manager. Please be sure to check your SPAM/JUNK folder too.
Chat With
MaRIA