Plant-Based Methionine Market Size and Share Forecast Outlook 2025 to 2035

The Plant-Based Methionine Market is expected to record a valuation of USD 0.85 billion in 2025 and USD 1.53 billion in 2035, with an increase of USD 0.68 billion, which equals a growth of ~80.6% over the decade. The overall expansion represents a 6.1% CAGR and nearly a 2X increase in market size.
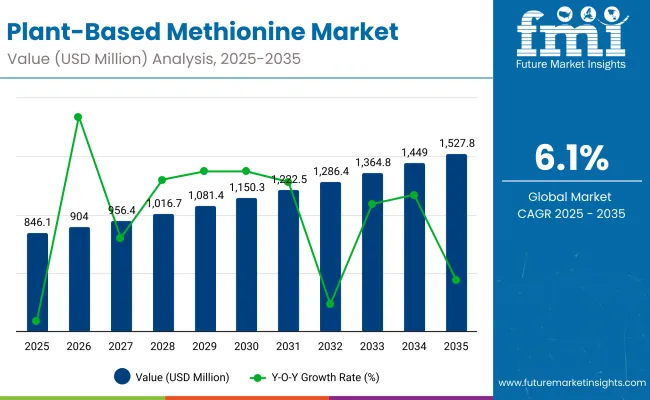
Quick Stats for Plant-Based Methionine Market

  • Market Value (2025): USD 0.85 billion
  • Market Forecast Value (2035): USD 1.53 billion
  • Forecast CAGR (2025 to 2035): 6.1%
  • Market Growth (2025 to 2035): USD 0.68 billion increase (~80.6% growth over the decade)
  • Leading Source Segment (2025): Soy-derived Methionine - 28.4% share
  • Fastest-Growing Source Segment (2025 to 2035): Algae-derived Methionine - 8.3% CAGR
  • Leading Form Segment (2025): L-Methionine - 43.2% share
  • Key Growth Regions: North America (30% share in 2025), Europe (28%), Asia-Pacific (fastest CAGR led by China at 6.7%)
  • Top Companies: CJ CheilJedang, Evonik Industries, Adisseo, Novus International, Ajinomoto Animal Nutrition

Plant Based Methionine Market

Plant-based methionine Market Key Takeaways

Metric Value
Market Estimated Value in (2025E) USD 0.85 billion
Market Forecast Value in (2035F) USD 1.53 billion
Forecast CAGR (2025 to 2035) 6.1%

During the first five-year period from 2025 to 2030, the market rises from USD 0.85 billion to USD 1.15 billion, adding USD 0.30 billion, which accounts for 45% of the total decade growth. This phase records steady adoption in poultry feed, ruminant feed, and aquaculture feed, driven by the need for enhanced animal productivity and sustainable protein supply. Soy-derived methionine dominates this period as it caters to over a quarter of global applications, supported by established fermentation processes and cost efficiencies.

The second half from 2030 to 2035 contributes USD 0.38 billion, equal to 55% of total growth, as the market jumps from USD 1.15 billion to USD 1.53 billion. This acceleration is powered by the widespread deployment of algae- and legume-derived methionine, supported by biotechnology breakthroughs and demand for non-GMO alternatives. Algae-derived methionine, with the fastest CAGR of 8.3%, becomes a critical innovation driver. Increased uptake in Europe and Asia-Pacific, alongside precision livestock management, further amplifies the expansion.

From 2020 to 2024, the Plant-Based Methionine Market expanded steadily, rising from a niche valuation below USD 0.70 billion to USD 0.85 billion in 2025, largely driven by fermentation-based production platforms. During this period, the competitive landscape was dominated by established feed additive manufacturers, who collectively controlled nearly 70-75% of global revenue. Leaders such as CJ CheilJedang, Evonik, Adisseo, and Novus International focused on scaling precision fermentation and enzymatic conversion technologies, particularly for poultry and ruminant feed applications. Competitive differentiation relied heavily on cost efficiency, consistent amino acid yield, and integration into compound feed formulations, while smaller innovators struggled to compete on economies of scale. Service-based offerings, such as nutritional formulation support and digital feed optimization tools, contributed less than 10% of the overall market value.

By 2025, demand for plant-based methionine is projected to reach USD 0.85 billion, and the revenue mix is shifting toward specialty applications and functional nutrition segments. Traditional leaders face mounting competition from biotech-driven entrants such as METEX NØØVISTAGO, GreenLab Mexico, and Prinova, who are leveraging synthetic biology, fermentation optimization, and algae-derived production to expand product portfolios. Major incumbents are pivoting to hybrid business models, integrating feed analytics, sustainability scoring, and traceability solutions to maintain relevance in a changing market. Emerging players specializing in non-GMO legume-based methionine, algae-sourced formulations, and digital integration platforms are gaining traction. Competitive advantage is moving away from volume-driven methionine supply alone to ecosystem strength, biotechnology leadership, and recurring partnerships with feed manufacturers.

Why the Plant-Based Methionine Market is Growing?

Advances in fermentation and enzymatic conversion technologies have enhanced the yield, purity, and cost-efficiency of plant-based methionine, making it a viable alternative to synthetic counterparts. Soy- and corn-derived methionine remain the backbone of production, while legume- and algae-derived methionine are gaining traction due to their sustainability profile and ability to integrate into non-GMO and specialty feed markets. As feed manufacturers demand precise amino acid balancing, plant-derived methionine offers a cleaner, eco-friendly pathway that aligns with both regulatory frameworks and consumer-driven sustainability preferences.

The expansion of poultry, aquaculture, and ruminant feed industries has further fueled market growth, as methionine is indispensable for protein synthesis, feather development, milk yield, and immunity support. Functional attributes such as antioxidant and reproductive health benefits are creating new application opportunities beyond basic growth promotion. Segment growth is expected to be led by L-Methionine formulations, poultry feed applications, and fermentation-derived production methods, owing to their scalability and adaptability to diverse feed systems.

Segmental Analysis

The Plant-Based Methionine Market is segmented by source, form, functionality, application, end-use feed type, production method, sales channel, and region. By source, it includes soy, corn, rice, wheat, potato, legume, and algae-derived methionine, offering varied nutritional and sustainability benefits. In form, the market is divided into L-Methionine, DL-Methionine (plant-origin), and HMTBA, with L-Methionine leading. Functionality spans protein synthesis, feather development, milk yield, reproductive health, immunity, and antioxidant roles, underscoring methionine’s broad impact on animal health. Applications cover poultry, swine, ruminant, aquaculture, and pet food. End-use feed types include compound feed, premixes, and supplements, while production methods range from fermentation and enzymatic conversion to protein hydrolysate extraction. Sales occur directly, through distributors, and via online B2B platforms. Regionally, adoption is strong in North America and Europe, with Asia-Pacific, led by China and India, showing the fastest growth.
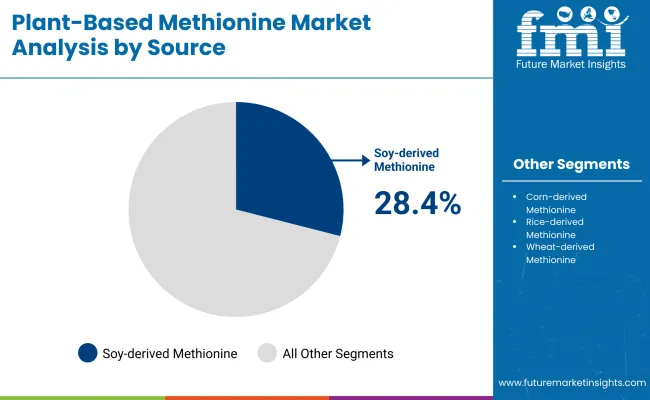
Insights into the Source Segment with Soy Leading in Market Share

Plant Based Methionine Market By Source

Source Segment Market Value Share, 2025
Soy-derived Methionine 28.40%
Corn-derived Methionine 18.70%
Rice-derived Methionine 11.20%
Wheat-derived Methionine 9.80%
Potato-derived Methionine 6.90%
Legume-derived Methionine 15.60%
Algae-derived Methionine 9.40%

Soy-derived methionine held 28.4% of the market share in 2025, making it the dominant source of plant-based methionine. Its leadership is driven by established fermentation platforms, cost-effectiveness, and widespread adoption in poultry and ruminant feed. Corn-derived methionine accounts for 18.7%, while rice-derived contributes 11.2%, both reflecting strong scalability in feed applications. Emerging categories such as legume-derived methionine (15.6%) and algae-derived methionine (9.4%) are gaining momentum, supported by sustainability initiatives and biotechnology-driven innovations. Algae-derived, in particular, is projected to grow at the fastest CAGR of 8.3%, making it a future growth driver. The source segment highlights a balance between traditional large-volume feed ingredients (soy, corn) and innovation-driven alternatives (algae, legumes).
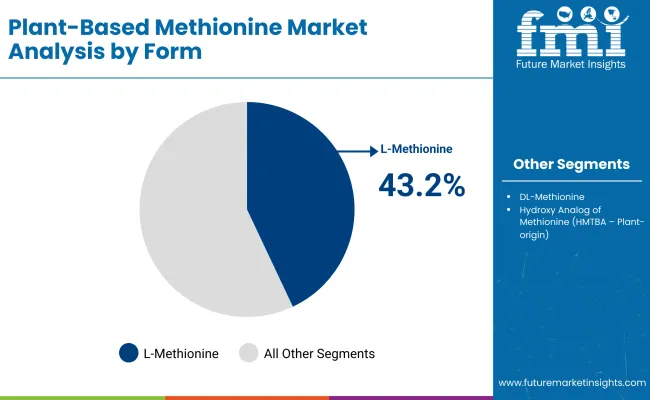
Insights into the Form Segment with L-Methionine Leading

Plant Based Methionine Market By Form

Form Segment Market Value Share, 2025
L-Methionine 43.20%
DL-Methionine (Plant-origin) 38.10%
Hydroxy Analog of Methionine (HMTBA - Plant-origin) 18.70%

L-Methionine dominates the form segment with 43.2% share in 2025, supported by its critical role in protein synthesis, improved digestibility, and extensive application in poultry and ruminant feed. DL-Methionine (38.1%) follows closely, offering a cost-efficient solution for diverse feed applications, while the Hydroxy Analog of Methionine (HMTBA) holds 18.7% and shows a higher growth potential with a CAGR of 6.9%. This segment reflects the growing preference for precision amino acid supplementation, with L-Methionine expected to retain leadership due to its superior bioavailability. The rising demand for HMTBA underscores the industry’s shift toward advanced, performance-enhancing methionine formulations that cater to specialized nutritional needs.
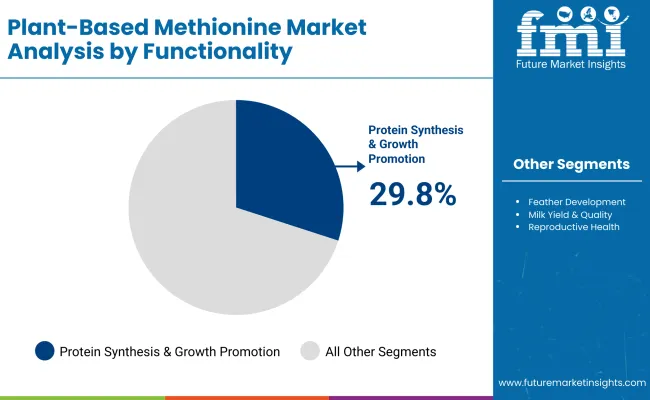
Insights into the Functionality Segment with Protein Synthesis & Growth Promotion Leading

Plant Based Methionine Market By Functionality

Functionality Segment Market Value Share, 2025
Protein Synthesis & Growth Promotion 29.80%
Feather Development (Poultry) 17.50%
Milk Yield & Quality (Ruminants) 16.40%
Reproductive Health 12.30%
Immunity Support 14.60%
Antioxidant Function 9.40%

Protein synthesis and growth promotion account for 29.8% of the market share in 2025, making it the leading functionality for plant-based methionine. Its dominance is attributed to the central role methionine plays in muscle development and productivity enhancement across livestock species. Feather development in poultry contributes 17.5%, while milk yield and quality improvement in ruminants holds 16.4%, reflecting critical roles in poultry and dairy industries. Other functions, including reproductive health (12.3%), immunity support (14.6%), and antioxidant function (9.4%), are expanding steadily, with antioxidant function recording the fastest growth at a CAGR of 7.0%. This highlights methionine’s evolution beyond core growth promotion into functional health and wellness applications, particularly in enhancing immunity and stress resilience in animals.

What are the Drivers, Restraints, and Key Trends of the Plant-Based Methionine Market?

Sustainability-Driven Industry Adoption and Feed Integration

The Plant-Based Methionine Market is gaining traction across livestock industries, particularly in poultry, aquaculture, and ruminant nutrition, where amino acid balance is critical for productivity and health. Producers are increasingly adopting soy- and corn-derived methionine due to scalability, while legume- and algae-derived alternatives are rising as sustainable solutions. Integration into compound feed, premixes, and supplements ensures broad market uptake. Plant-based methionine also aligns with global regulatory pushes to reduce synthetic additives, enabling cleaner labels and eco-friendly feed formulations. Functionally, its role in protein synthesis, feather growth, milk yield, immunity, and antioxidant defense underscores its indispensability in modern feed strategies. As pet food and specialty feed applications grow, demand for plant-based sources is expanding beyond traditional livestock.

Cost Constraints and Complexity in Production Utilization

While adoption is rising, plant-based methionine faces significant cost barriers. Fermentation and enzymatic conversion processes require advanced infrastructure, continuous R&D, and high-quality substrates, driving up production costs relative to synthetic methionine. Limited economies of scale further restrict smaller innovators from competing with large incumbents. Feed manufacturers in price-sensitive regions face challenges integrating higher-cost plant-based methionine, especially where conventional alternatives remain cheaper. Additionally, ensuring consistent amino acid yield, bioavailability, and stability across feed types adds technical complexity. The fragmented supply chain, reliance on specific feedstocks (soy, legumes, algae), and compliance with non-GMO and organic certifications raise both capital and operational burdens, slowing wider adoption among mid- and small-scale feed players.
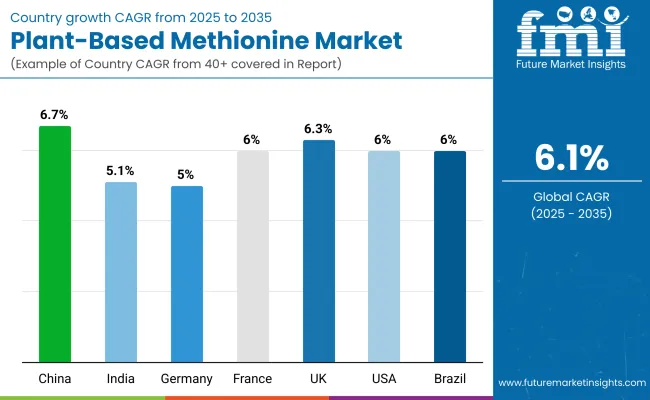
Analysis of Plant-Based Methionine Market by Key Countries

Plant Based Methionine Market By Country

Countries CAGR
China 6.72%
India 5.14%
Germany 5.04%
France 6.01%
UK 6.31%
USA 6.50%
Brazil 6.08%

The Plant-Based Methionine Market shows regional disparities shaped by livestock intensity, sustainability mandates, and feed modernization. Asia-Pacific is the fastest-growing region, led by China (6.7% CAGR) with strong poultry and aquaculture demand, and India (5.1% CAGR) supported by dairy and poultry expansion. Europe maintains a robust profile, driven by Germany (5.0%), France (6.0%), and the UK (6.3%), reflecting stringent animal welfare rules and non-GMO feed preferences. North America grows steadily at 6.5% CAGR in the USA, with emphasis on organic and sustainable feed. Latin America, led by Brazil (6.1%), benefits from poultry exports, while MEA (3% share) shows gradual adoption through government livestock programs. Collectively, Asia-Pacific and Europe emerge as key growth engines, while North America remains a stable, innovation-driven market.
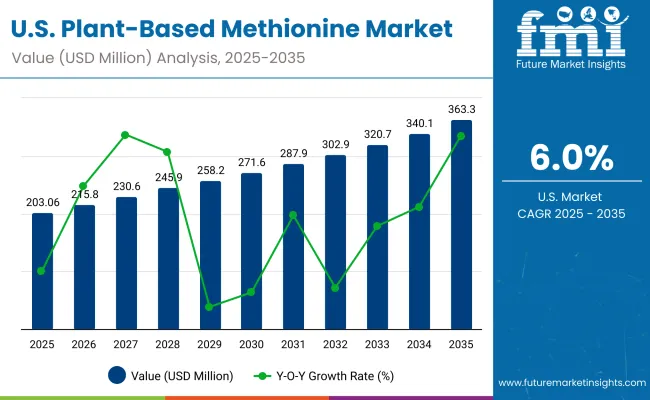
Sales Outlook for Plant-Based Methionine in the United States

Plant Based Methionine Market Usa

Year USA Plant-Based Methionine Market (USD Million)
2025 203.06
2026 215.8
2027 230.6
2028 245.9
2029 258.2
2030 271.6
2031 287.9
2032 302.9
2033 320.7
2034 340.1
2035 363.3

The Plant-Based Methionine Market in the United States is projected to grow at a CAGR of 6.5%, supported by strong demand from poultry, dairy, and pet food industries. Growth is led by large-scale poultry production and rising consumer preference for sustainable, plant-origin amino acids. The USA feed industry is increasingly integrating fermentation-derived L-Methionine into compound feed and premixes to enhance animal productivity while meeting regulatory and clean-label standards. Pet food manufacturers are also driving adoption, leveraging methionine’s roles in immunity support, reproductive health, and antioxidant benefits to differentiate premium formulations. Precision livestock management and sustainability certifications further support uptake across the USA market.

  • Poultry producers are adopting plant-based methionine for growth promotion and feather development.
  • Dairy feed is incorporating methionine to improve milk yield and quality.
  • Pet food brands are leveraging methionine’s health benefits for premium and functional formulations.

Growth and Expansion Outlook for Plant-Based Methionine Market in the United Kingdom

The Plant-Based Methionine Market in the United Kingdom is projected to grow at a CAGR of 6.3%, driven by rising adoption in poultry, dairy, and premium pet food segments. Poultry producers are accelerating the use of L-Methionine to improve feed efficiency and enhance feather development in line with welfare and performance standards. The dairy sector is increasingly integrating plant-origin methionine into ruminant feed to improve milk yield and reproductive health. At the same time, the UK’s growing pet food industry, which emphasizes natural and functional ingredients, is expanding opportunities for algae- and legume-derived methionine. Government sustainability mandates and public-private nutrition initiatives are further supporting broader adoption across feed applications.

  • Poultry producers are integrating L-Methionine to enhance feed conversion and growth.
  • Dairy farmers are using plant-based methionine to improve milk productivity and reproductive performance.
  • Pet food manufacturers are adopting algae- and legume-derived methionine to differentiate premium offerings.

Growth and Expansion Outlook for Plant-Based Methionine Market in India

The Plant-Based Methionine Market in India is forecast to expand at a CAGR of 5.1% through 2035, driven by the rapid growth of poultry and dairy sectors. Adoption is spreading from major production hubs to tier-2 and tier-3 cities, supported by cost reductions in fermentation-derived methionine and greater awareness among feed manufacturers. Poultry feed suppliers are integrating soy- and corn-based methionine to enhance growth efficiency, while the dairy sector is adopting methionine to improve milk yield and reproductive health in ruminants. Educational and vocational programs are also beginning to introduce sustainable feed formulation training, further raising awareness of plant-based amino acid applications.

  • Deployment in smaller cities is rising due to affordable methionine solutions.
  • Poultry suppliers are adopting plant-based methionine for growth and feather development.
  • Dairy farmers are using methionine to improve milk yield and herd fertility.

Sales Outlook for Plant-Based Methionine Market in China

The Plant-Based Methionine Market in China is projected to grow at a CAGR of 6.7%, the highest among leading economies, supported by the country’s dominant poultry, aquaculture, and swine industries. Growth is fueled by smart feed factory rollouts, government nutrition mandates, and innovation by local biotech firms. Demand for methionine is rising in automated feed production lines for both industrial poultry and aquaculture farms. Municipal programs are also encouraging sustainable feed formulations to align with national food security goals. Affordable production by domestic players, coupled with increasing adoption in pet food, specialty feed, and functional health formulations, is making plant-based methionine more widely accessible across China’s feed industry.

  • Large-scale poultry and aquaculture demand is accelerating adoption.
  • Local biotech firms are innovating in fermentation and algae-derived methionine.
  • Competitive domestic pricing is driving mass adoption in feed and pet nutrition.

In-depth Analysis of Plant-Based Methionine in Germany

Countries 2025
UK 18.10%
Germany 20.81%
Italy 10.34%
France 13.45%
Spain 10.48%
BNELUX 6.64%
Nordic 5.29%
Rest of Europe 15%
Countries 2035
UK 20.77%
Germany 20.61%
Italy 11.10%
France 12.97%
Spain 10.39%
BNELUX 5.31%
Nordic 5.46%
Rest of Europe 13%

The Plant-Based Methionine Market in Germany is projected to grow at a CAGR of 5.0%, underpinned by the country’s leadership in precision livestock farming and advanced feed technologies. German feed manufacturers are integrating fermentation-derived L-Methionine into poultry and ruminant feed to comply with strict EU sustainability and animal welfare standards. The dairy sector is increasingly adopting methionine to improve milk yield and reproductive health, while poultry producers are focusing on enhanced feather development and feed efficiency. Germany’s strong compliance culture and commitment to non-GMO formulations are accelerating demand for legume- and algae-derived methionine, particularly in premium feed and pet food applications.
  • Poultry and dairy feed producers are adopting plant-based methionine to meet EU sustainability requirements.
  • Fermentation-derived L-Methionine is increasingly integrated into compound feed and premixes.
  • Premium feed and pet food brands are using legume- and algae-based methionine for differentiation.

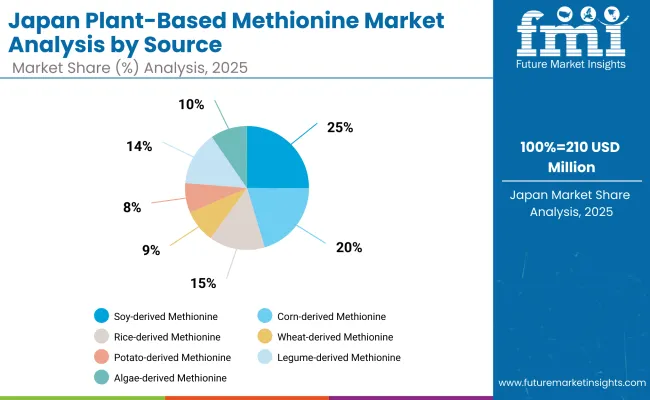
Growth Outlook for Plant-Based Methionine Market in Japan

Plant Based Methionine Market Japan

Source Segment Market Value Share, 2025
Soy-derived Methionine 25.10%
Corn-derived Methionine 20.30%
Rice-derived Methionine 14.60%
Wheat-derived Methionine 8.50%
Potato-derived Methionine 7.80%
Legume-derived Methionine 14.10%
Algae-derived Methionine 9.60%

The Plant-Based Methionine Market in Japan is projected at USD 0.21 billion in 2025, with soy-derived methionine holding 25.1% share, followed by corn-derived at 20.3% and legumes at 14.1%. The country shows a balanced adoption of multiple sources, with algae-derived methionine recording the fastest growth at 7.5% CAGR. This reflects Japan’s strong focus on biotechnology-driven nutrition and its commitment to functional, sustainable feed additives. Demand is being driven by the poultry and aquaculture industries, alongside a rising emphasis on pet nutrition formulations. The integration of plant-origin methionine into premium feed is supported by regulatory encouragement of non-GMO and sustainable protein sources, aligning with Japan’s broader food security and animal welfare policies.
  • The Japanese market accounts for ~5-6% of global value in 2025.
  • Algae-derived methionine grows fastest (7.5% CAGR), supported by biotech innovation.
  • Demand is led by poultry, aquaculture, and premium pet food sectors, with strong regulatory backing for sustainable feed adoption.

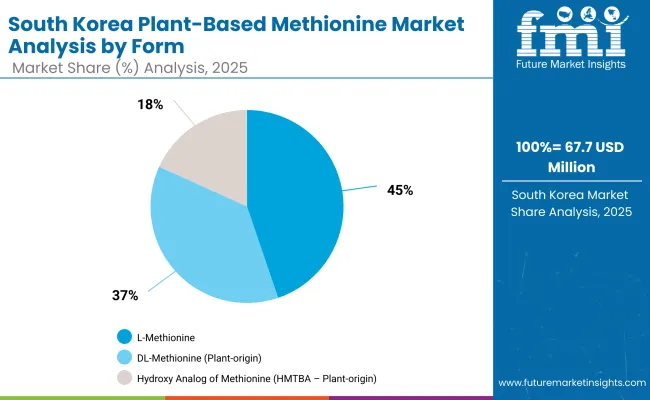
Opportunity Analysis of South Korea Plant-Based Methionine Market

Plant Based Methionine Market South Korea

Form Segment Market Value Share, 2025
L-Methionine 44.80%
DL-Methionine (Plant-origin) 37.00%
Hydroxy Analog of Methionine (HMTBA - Plant-origin) 18.20%

The Plant-Based Methionine Market in South Korea is valued at USD 67.7 million in 2025 and is projected to reach around USD 122.2 million by 2035. By form, L-Methionine holds 44.8% share in 2025 at a CAGR of 6.2%, DL-Methionine accounts for 37.0% at 6.0% CAGR, and Hydroxy Analog of Methionine (HMTBA) represents 18.2% at the fastest CAGR of 6.5%. This reflects South Korea’s advanced feed industry, where poultry and swine remain dominant users of amino acid supplementation. L-Methionine continues as the most widely adopted form due to digestibility benefits, while DL-Methionine remains a cost-effective option. HMTBA is the fastest-growing segment, favored for its enhanced bioavailability and alignment with precision nutrition practices. Rising demand in aquaculture and premium pet food further supports the expansion of plant-based methionine across the South Korean market.
  • L-Methionine (44.8%, 6.2% CAGR) dominates due to efficiency in poultry and ruminant feed.
  • DL-Methionine (37.0%, 6.0% CAGR) remains essential for cost-effective supplementation.
  • HMTBA (18.2%, 6.5% CAGR) grows fastest, driven by advanced nutrition strategies.

Competitive Landscape of Plant-Based Methionine Market

Plant Based Methionine Market By Company

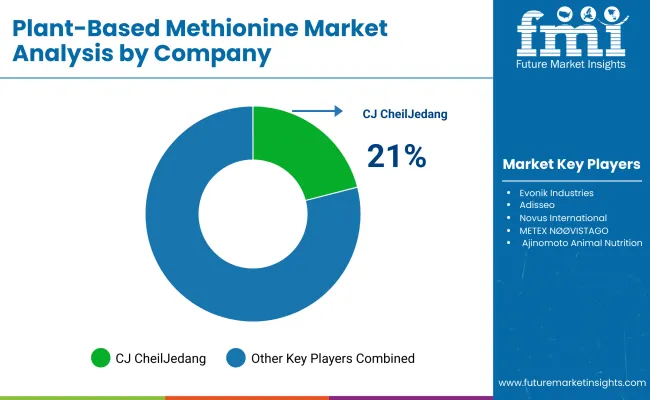
The Plant-Based Methionine Market is moderately fragmented, with global feed additive leaders, mid-sized innovators, and specialized biotech firms competing across animal nutrition applications. Global leaders such as CJ CheilJedang, Evonik, and Adisseo hold significant market share, driven by strong fermentation platforms, large-scale production capacity, and integration into poultry and ruminant feed supply chains. Their strategies increasingly emphasize sustainability-driven methionine production, fermentation optimization, and partnerships with global feed manufacturers to secure volume growth.

Established mid-sized players, including Novus International, METEX NØØVISTAGO, and Ajinomoto Animal Nutrition, cater to the demand for innovative solutions such as HMTBA formulations, enzymatic conversion, and legume-derived methionine. These companies are accelerating adoption by positioning plant-based methionine as a performance enhancer in poultry, dairy, and aquaculture feed, while expanding presence in emerging markets with lower-cost alternatives.

Specialized innovators, such as GreenLab Mexico, Prinova Group, and Meihua Holdings, are focused on algae-based methionine, non-GMO legume-derived solutions, and biotechnology-driven production. Their strength lies in customization, sustainability positioning, and regional adaptability, rather than global scale.

Competitive differentiation is shifting away from synthetic methionine and volume-driven models toward ecosystem strength, biotech innovation, and recurring partnerships with feed and pet food manufacturers. As regulatory and consumer pressures for sustainable and functional feed additives intensify, the ability to deliver high-purity, plant-origin methionine with functional health benefits will define long-term competitive advantage.

Key Developments in the Plant-Based Methionine Market

  • On February 10, 2025, CJ CheilJedang announced an expansion of its fermentation-based methionine production facilities in South Korea, aimed at meeting rising global demand for sustainable poultry and dairy feed additives. The company emphasized that the move supports its broader strategy of reducing reliance on synthetic amino acids.
  • On March 22, 2025, METEX NØØVISTAGO launched a new legume-derived methionine line in Europe, leveraging non-GMO feedstocks. This development strengthens METEX’s positioning in the European Union, where sustainable sourcing and clean-label feed requirements are becoming regulatory priorities.

Scope of the Report

Item Value
Quantitative Units USD 0.85 billion
Source Soy-derived, Corn-derived, Rice-derived, Wheat-derived, Potato-derived, Legume-derived (pea, lentil), and Algae-derived Methionine
Form L-Methionine, DL-Methionine (Plant-origin), Hydroxy Analog of Methionine (HMTBA - Plant-origin)
Functionality Protein synthesis & growth promotion, Feather development (poultry), Milk yield & quality (ruminants), Reproductive health, Immunity support, Antioxidant function
Application Poultry feed, Swine feed, Ruminant feed, Aquaculture feed, Pet food
End-use Feed Type Compound feed, Premixes, Supplements
Production Method Fermentation-derived (plant substrate), Enzymatic conversion, Extraction & purification from plant protein hydrolysates
Sales Channels Direct to feed manufacturers, Distributors & agents, Online B2B platforms
Regions Covered North America, Europe, Asia-Pacific, Latin America, Middle East & Africa
Countries Covered United States, Canada, Germany, France, United Kingdom, China, Japan, India, Brazil, South Africa
Key Companies Profiled CJ CheilJedang, Evonik Industries, Adisseo (BlueStar Adisseo), Novus International, METEX NØØVISTAGO, Ajinomoto Animal Nutrition, GreenLab Mexico, Prinova Group, Meihua Holdings Group
Additional Attributes Dollar sales by source, form, and application; adoption trends in poultry, dairy, aquaculture, and pet food; functional benefits in immunity and reproductive health; biotechnology-led algae & legume methionine growth; regulatory drivers in Europe; sustainability-linked premium feed demand; and innovations in fermentation & enzymatic production.

Key Segments

By Source:

  • Soy-derived Methionine
  • Corn-derived Methionine
  • Rice-derived Methionine
  • Wheat-derived Methionine
  • Potato-derived Methionine
  • Legume-derived Methionine (e.g., Pea, Lentil)
  • Algae-derived Methionine

By Form:

  • L-Methionine
  • DL-Methionine (Plant-origin)
  • Hydroxy Analog of Methionine (HMTBA - Plant-origin)

By Functionality:

  • Protein Synthesis & Growth Promotion
  • Feather Development (Poultry)
  • Milk Yield & Quality (Ruminants)
  • Reproductive Health
  • Immunity Support
  • Antioxidant Function

By Application:

  • Poultry Feed
  • Swine Feed
  • Ruminant Feed (Dairy, Beef)
  • Aquaculture Feed
  • Pet Food

By End-use Feed Type:

  • Compound Feed
  • Premixes
  • Supplements

By Production Method:

  • Fermentation-derived (Plant-based Substrate)
  • Enzymatic Conversion
  • Extraction & Purification from Plant Protein Hydrolysates

By Sales Channel:

  • Direct to Feed Manufacturers
  • Through Distributors / Agents
  • Online B2B Platforms

By Region:

  • North America
  • Latin America
  • Europe
  • East Asia
  • South Asia & Pacific
  • Middle East and Africa

Table of Content

  1. Executive Summary
    • Global Market Outlook
    • Demand-side Trends
    • Supply-side Trends
    • Technology Roadmap Analysis
    • Analysis and Recommendations
  2. Market Overview
    • Market Coverage / Taxonomy
    • Market Definition / Scope / Limitations
  3. Market Background
    • Market Dynamics
      • Drivers
      • Restraints
      • Opportunity
      • Trends
    • Scenario Forecast
      • Demand in Optimistic Scenario
      • Demand in Likely Scenario
      • Demand in Conservative Scenario
    • Opportunity Map Analysis
    • Product Life Cycle Analysis
    • Supply Chain Analysis
    • Investment Feasibility Matrix
    • Value Chain Analysis
    • PESTLE and Porter’s Analysis
    • Regulatory Landscape
    • Regional Parent Market Outlook
    • Production and Consumption Statistics
    • Import and Export Statistics
  4. Global Market Analysis 2020 to 2024 and Forecast, 2025 to 2035
    • Historical Market Size Value (USD Million) Analysis, 2020 to 2024
    • Current and Future Market Size Value (USD Million) Projections, 2025 to 2035
      • Y-o-Y Growth Trend Analysis
      • Absolute $ Opportunity Analysis
  5. Global Market Pricing Analysis 2020 to 2024 and Forecast 2025 to 2035
  6. Global Market Analysis 2020 to 2024 and Forecast 2025 to 2035, By Source
    • Introduction / Key Findings
    • Historical Market Size Value (USD Million) Analysis By Source, 2020 to 2024
    • Current and Future Market Size Value (USD Million) Analysis and Forecast By Source, 2025 to 2035
      • Soy-derived Methionine
      • Corn-derived Methionine
      • Rice-derived Methionine
      • Wheat-derived Methionine
      • Potato-derived Methionine
      • Legume-derived Methionine (e.g., Pea, Lentil)
      • Algae-derived Methionine
    • Y-o-Y Growth Trend Analysis By Source, 2020 to 2024
    • Absolute $ Opportunity Analysis By Source, 2025 to 2035
  7. Global Market Analysis 2020 to 2024 and Forecast 2025 to 2035, By Form
    • Introduction / Key Findings
    • Historical Market Size Value (USD Million) Analysis By Form, 2020 to 2024
    • Current and Future Market Size Value (USD Million) Analysis and Forecast By Form, 2025 to 2035
      • L-Methionine
      • DL-Methionine (Plant-origin)
      • Hydroxy Analog of Methionine (HMTBA - Plant-origin)
    • Y-o-Y Growth Trend Analysis By Form, 2020 to 2024
    • Absolute $ Opportunity Analysis By Form, 2025 to 2035
  8. Global Market Analysis 2020 to 2024 and Forecast 2025 to 2035, By Functionality
    • Introduction / Key Findings
    • Historical Market Size Value (USD Million) Analysis By Functionality, 2020 to 2024
    • Current and Future Market Size Value (USD Million) Analysis and Forecast By Functionality, 2025 to 2035
      • Protein Synthesis & Growth Promotion
      • Feather Development (Poultry)
      • Milk Yield & Quality (Ruminants)
      • Reproductive Health
      • Immunity Support
      • Antioxidant Function
    • Y-o-Y Growth Trend Analysis By Functionality, 2020 to 2024
    • Absolute $ Opportunity Analysis By Functionality, 2025 to 2035
  9. Global Market Analysis 2020 to 2024 and Forecast 2025 to 2035, By Application
    • Introduction / Key Findings
    • Historical Market Size Value (USD Million) Analysis By Application, 2020 to 2024
    • Current and Future Market Size Value (USD Million) Analysis and Forecast By Application, 2025 to 2035
      • Poultry Feed
      • Swine Feed
      • Ruminant Feed (Dairy, Beef)
      • Aquaculture Feed
      • Pet Food
    • Y-o-Y Growth Trend Analysis By Application, 2020 to 2024
    • Absolute $ Opportunity Analysis By Application, 2025 to 2035
  10. Global Market Analysis 2020 to 2024 and Forecast 2025 to 2035, By End-use Feed Type
    • Introduction / Key Findings
    • Historical Market Size Value (USD Million) Analysis By End-use Feed Type, 2020 to 2024
    • Current and Future Market Size Value (USD Million) Analysis and Forecast By End-use Feed Type, 2025 to 2035
      • Compound Feed
      • Premixes
      • Supplements
    • Y-o-Y Growth Trend Analysis By End-use Feed Type, 2020 to 2024
    • Absolute $ Opportunity Analysis By End-use Feed Type, 2025 to 2035
  11. Global Market Analysis 2020 to 2024 and Forecast 2025 to 2035, By Production Method
    • Introduction / Key Findings
    • Historical Market Size Value (USD Million) Analysis By Production Method, 2020 to 2024
    • Current and Future Market Size Value (USD Million) Analysis and Forecast By Production Method, 2025 to 2035
      • Fermentation-derived (Plant-based Substrate)
      • Enzymatic Conversion
      • Extraction & Purification from Plant Protein Hydrolysates
    • Y-o-Y Growth Trend Analysis By Production Method, 2020 to 2024
    • Absolute $ Opportunity Analysis By Production Method, 2025 to 2035
  12. Global Market Analysis 2020 to 2024 and Forecast 2025 to 2035, By Sales Channel
    • Introduction / Key Findings
    • Historical Market Size Value (USD Million) Analysis By Sales Channel, 2020 to 2024
    • Current and Future Market Size Value (USD Million) Analysis and Forecast By Sales Channel, 2025 to 2035
      • Direct to Feed Manufacturers
      • Through Distributors / Agents
      • Online B2B Platforms
    • Y-o-Y Growth Trend Analysis By Sales Channel, 2020 to 2024
    • Absolute $ Opportunity Analysis By Sales Channel, 2025 to 2035
  13. Global Market Analysis 2020 to 2024 and Forecast 2025 to 2035, By Region
    • Introduction
    • Historical Market Size Value (USD Million) Analysis By Region, 2020 to 2024
    • Current Market Size Value (USD Million) Analysis and Forecast By Region, 2025 to 2035
      • North America
      • Latin America
      • Europe
      • East Asia
      • South Asia & Pacific
      • Middle East and Africa
    • Market Attractiveness Analysis By Region
  14. North America Market Analysis 2020 to 2024 and Forecast 2025 to 2035, By Country
    • Historical Market Size Value (USD Million) Trend Analysis By Market Taxonomy, 2020 to 2024
    • Market Size Value (USD Million) Forecast By Market Taxonomy, 2025 to 2035
      • By Country
        • USA
        • Canada
      • By Source
      • By Form
      • By Functionality
      • By Application
      • By End-use Feed Type
      • By Production Method
      • By Sales Channel
    • Market Attractiveness Analysis
      • By Country
      • By Source
      • By Form
      • By Functionality
      • By Application
      • By End-use Feed Type
      • By Production Method
      • By Sales Channel
    • Key Takeaways
  15. Latin America Market Analysis 2020 to 2024 and Forecast 2025 to 2035, By Country
    • Historical Market Size Value (USD Million) Trend Analysis By Market Taxonomy, 2020 to 2024
    • Market Size Value (USD Million) Forecast By Market Taxonomy, 2025 to 2035
      • By Country
        • Brazil
        • Mexico
        • Colombia
        • Rest of Latin America
      • By Source
      • By Form
      • By Functionality
      • By Application
      • By End-use Feed Type
      • By Production Method
      • By Sales Channel
    • Market Attractiveness Analysis
      • By Country
      • By Source
      • By Form
      • By Functionality
      • By Application
      • By End-use Feed Type
      • By Production Method
      • By Sales Channel
    • Key Takeaways
  16. Europe Market Analysis 2020 to 2024 and Forecast 2025 to 2035, By Country
    • Historical Market Size Value (USD Million) Trend Analysis By Market Taxonomy, 2020 to 2024
    • Market Size Value (USD Million) Forecast By Market Taxonomy, 2025 to 2035
      • By Country
        • Germany
        • UK
        • France
        • Italy
        • Spain
        • Belgium
        • Netherlands
        • Nordic
        • Switzerland
        • Russia
        • Poland
        • Rest of Europe
      • By Source
      • By Form
      • By Functionality
      • By Application
      • By End-use Feed Type
      • By Production Method
      • By Sales Channel
    • Market Attractiveness Analysis
      • By Country
      • By Source
      • By Form
      • By Functionality
      • By Application
      • By End-use Feed Type
      • By Production Method
      • By Sales Channel
    • Key Takeaways
  17. East Asia Market Analysis 2020 to 2024 and Forecast 2025 to 2035, By Country
    • Historical Market Size Value (USD Million) Trend Analysis By Market Taxonomy, 2020 to 2024
    • Market Size Value (USD Million) Forecast By Market Taxonomy, 2025 to 2035
      • By Country
        • China
        • Japan
        • South Korea
      • By Source
      • By Form
      • By Functionality
      • By Application
      • By End-use Feed Type
      • By Production Method
      • By Sales Channel
    • Market Attractiveness Analysis
      • By Country
      • By Source
      • By Form
      • By Functionality
      • By Application
      • By End-use Feed Type
      • By Production Method
      • By Sales Channel
    • Key Takeaways
  18. South Asia & Pacific Market Analysis 2020 to 2024 and Forecast 2025 to 2035, By Country
    • Historical Market Size Value (USD Million) Trend Analysis By Market Taxonomy, 2020 to 2024
    • Market Size Value (USD Million) Forecast By Market Taxonomy, 2025 to 2035
      • By Country
        • India
        • Thailand
        • Malaysia
        • Indonesia
        • Singapore
        • Vietnam
        • Australia
        • New Zealand
        • Rest of South Asia
      • By Source
      • By Form
      • By Functionality
      • By Application
      • By End-use Feed Type
      • By Production Method
      • By Sales Channel
    • Market Attractiveness Analysis
      • By Country
      • By Source
      • By Form
      • By Functionality
      • By Application
      • By End-use Feed Type
      • By Production Method
      • By Sales Channel
    • Key Takeaways
  19. Middle East and Africa Market Analysis 2020 to 2024 and Forecast 2025 to 2035, By Country
    • Historical Market Size Value (USD Million) Trend Analysis By Market Taxonomy, 2020 to 2024
    • Market Size Value (USD Million) Forecast By Market Taxonomy, 2025 to 2035
      • By Country
        • Turkey
        • UAE
        • Saudi Arabia
        • Israel
        • Other GCC Countries
        • North Africa
        • South Africa
      • By Source
      • By Form
      • By Functionality
      • By Application
      • By End-use Feed Type
      • By Production Method
      • By Sales Channel
    • Market Attractiveness Analysis
      • By Country
      • By Source
      • By Form
      • By Functionality
      • By Application
      • By End-use Feed Type
      • By Production Method
      • By Sales Channel
    • Key Takeaways
  20. Key Countries Market Analysis
    • USA
      • Pricing Analysis
      • Market Share Analysis, 2024
        • By Source
        • By Form
        • By Functionality
        • By Application
        • By End-use Feed Type
        • By Production Method
        • By Sales Channel
    • Canada
      • Pricing Analysis
      • Market Share Analysis, 2024
        • By Source
        • By Form
        • By Functionality
        • By Application
        • By End-use Feed Type
        • By Production Method
        • By Sales Channel
    • Brazil
      • Pricing Analysis
      • Market Share Analysis, 2024
        • By Source
        • By Form
        • By Functionality
        • By Application
        • By End-use Feed Type
        • By Production Method
        • By Sales Channel
    • Mexico
      • Pricing Analysis
      • Market Share Analysis, 2024
        • By Source
        • By Form
        • By Functionality
        • By Application
        • By End-use Feed Type
        • By Production Method
        • By Sales Channel
    • Colombia
      • Pricing Analysis
      • Market Share Analysis, 2024
        • By Source
        • By Form
        • By Functionality
        • By Application
        • By End-use Feed Type
        • By Production Method
        • By Sales Channel
    • Rest of Latin America
      • Pricing Analysis
      • Market Share Analysis, 2024
        • By Source
        • By Form
        • By Functionality
        • By Application
        • By End-use Feed Type
        • By Production Method
        • By Sales Channel
    • Germany
      • Pricing Analysis
      • Market Share Analysis, 2024
        • By Source
        • By Form
        • By Functionality
        • By Application
        • By End-use Feed Type
        • By Production Method
        • By Sales Channel
    • UK
      • Pricing Analysis
      • Market Share Analysis, 2024
        • By Source
        • By Form
        • By Functionality
        • By Application
        • By End-use Feed Type
        • By Production Method
        • By Sales Channel
    • France
      • Pricing Analysis
      • Market Share Analysis, 2024
        • By Source
        • By Form
        • By Functionality
        • By Application
        • By End-use Feed Type
        • By Production Method
        • By Sales Channel
    • Italy
      • Pricing Analysis
      • Market Share Analysis, 2024
        • By Source
        • By Form
        • By Functionality
        • By Application
        • By End-use Feed Type
        • By Production Method
        • By Sales Channel
    • Spain
      • Pricing Analysis
      • Market Share Analysis, 2024
        • By Source
        • By Form
        • By Functionality
        • By Application
        • By End-use Feed Type
        • By Production Method
        • By Sales Channel
    • Belgium
      • Pricing Analysis
      • Market Share Analysis, 2024
        • By Source
        • By Form
        • By Functionality
        • By Application
        • By End-use Feed Type
        • By Production Method
        • By Sales Channel
    • Netherlands
      • Pricing Analysis
      • Market Share Analysis, 2024
        • By Source
        • By Form
        • By Functionality
        • By Application
        • By End-use Feed Type
        • By Production Method
        • By Sales Channel
    • Nordic
      • Pricing Analysis
      • Market Share Analysis, 2024
        • By Source
        • By Form
        • By Functionality
        • By Application
        • By End-use Feed Type
        • By Production Method
        • By Sales Channel
    • Switzerland
      • Pricing Analysis
      • Market Share Analysis, 2024
        • By Source
        • By Form
        • By Functionality
        • By Application
        • By End-use Feed Type
        • By Production Method
        • By Sales Channel
    • Russia
      • Pricing Analysis
      • Market Share Analysis, 2024
        • By Source
        • By Form
        • By Functionality
        • By Application
        • By End-use Feed Type
        • By Production Method
        • By Sales Channel
    • Poland
      • Pricing Analysis
      • Market Share Analysis, 2024
        • By Source
        • By Form
        • By Functionality
        • By Application
        • By End-use Feed Type
        • By Production Method
        • By Sales Channel
    • Rest of Europe
      • Pricing Analysis
      • Market Share Analysis, 2024
        • By Source
        • By Form
        • By Functionality
        • By Application
        • By End-use Feed Type
        • By Production Method
        • By Sales Channel
    • China
      • Pricing Analysis
      • Market Share Analysis, 2024
        • By Source
        • By Form
        • By Functionality
        • By Application
        • By End-use Feed Type
        • By Production Method
        • By Sales Channel
    • Japan
      • Pricing Analysis
      • Market Share Analysis, 2024
        • By Source
        • By Form
        • By Functionality
        • By Application
        • By End-use Feed Type
        • By Production Method
        • By Sales Channel
    • South Korea
      • Pricing Analysis
      • Market Share Analysis, 2024
        • By Source
        • By Form
        • By Functionality
        • By Application
        • By End-use Feed Type
        • By Production Method
        • By Sales Channel
    • India
      • Pricing Analysis
      • Market Share Analysis, 2024
        • By Source
        • By Form
        • By Functionality
        • By Application
        • By End-use Feed Type
        • By Production Method
        • By Sales Channel
    • Thailand
      • Pricing Analysis
      • Market Share Analysis, 2024
        • By Source
        • By Form
        • By Functionality
        • By Application
        • By End-use Feed Type
        • By Production Method
        • By Sales Channel
    • Malaysia
      • Pricing Analysis
      • Market Share Analysis, 2024
        • By Source
        • By Form
        • By Functionality
        • By Application
        • By End-use Feed Type
        • By Production Method
        • By Sales Channel
    • Indonesia
      • Pricing Analysis
      • Market Share Analysis, 2024
        • By Source
        • By Form
        • By Functionality
        • By Application
        • By End-use Feed Type
        • By Production Method
        • By Sales Channel
    • Singapore
      • Pricing Analysis
      • Market Share Analysis, 2024
        • By Source
        • By Form
        • By Functionality
        • By Application
        • By End-use Feed Type
        • By Production Method
        • By Sales Channel
    • Vietnam
      • Pricing Analysis
      • Market Share Analysis, 2024
        • By Source
        • By Form
        • By Functionality
        • By Application
        • By End-use Feed Type
        • By Production Method
        • By Sales Channel
    • Australia
      • Pricing Analysis
      • Market Share Analysis, 2024
        • By Source
        • By Form
        • By Functionality
        • By Application
        • By End-use Feed Type
        • By Production Method
        • By Sales Channel
    • New Zealand
      • Pricing Analysis
      • Market Share Analysis, 2024
        • By Source
        • By Form
        • By Functionality
        • By Application
        • By End-use Feed Type
        • By Production Method
        • By Sales Channel
    • Rest of South Asia
      • Pricing Analysis
      • Market Share Analysis, 2024
        • By Source
        • By Form
        • By Functionality
        • By Application
        • By End-use Feed Type
        • By Production Method
        • By Sales Channel
  21. Market Structure Analysis
    • Competition Dashboard
    • Competition Benchmarking
    • Market Share Analysis of Top Players
      • By Regional
      • By Source
      • By Form
      • By Functionality
      • By Application
      • By End-use Feed Type
      • By Production Method
      • By Sales Channel
  22. Competition Analysis
    • Competition Deep Dive
      • CJ CheilJedang
        • Overview
        • Product Portfolio
        • Profitability by Market Segments (Product/Age /Sales Channel/Region)
        • Sales Footprint
        • Strategy Overview
        • Evonik Industries (Plant-based R&D pipeline)
        • Adisseo (BlueStar Adisseo)
        • Novus International
        • GreenLab Mexico
        • METEX NØØVISTAGO
        • Prinova Group
        • Meihua Holdings Group
        • Kyowa Hakko Bio Co., Ltd.
        • Ajinomoto Animal Nutrition
        • Others
    • Assumptions & Acronyms Used
    • Research Methodology

List of Tables

  • Table 1: Global Market Value (USD Million) Forecast by Region, 2020-2035
  • Table 2: Global Market Value (USD Million) Forecast by Source, 2020-2035
  • Table 3: Global Market Value (USD Million) Forecast by Form, 2020-2035
  • Table 4: Global Market Value (USD Million) Forecast by Functionality, 2020-2035
  • Table 5: Global Market Value (USD Million) Forecast by Application, 2020-2035
  • Table 6: Global Market Value (USD Million) Forecast by End-use Feed Type, 2020-2035
  • Table 7: Global Market Value (USD Million) Forecast by Production Method, 2020-2035
  • Table 8: Global Market Value (USD Million) Forecast by Sales Channel, 2020-2035
  • Table 9: North America Market Value (USD Million) Forecast by Country, 2020-2035
  • Table 10: North America Market Value (USD Million) Forecast by Source, 2020-2035
  • Table 11: North America Market Value (USD Million) Forecast by Form, 2020-2035
  • Table 12: North America Market Value (USD Million) Forecast by Functionality, 2020-2035
  • Table 13: North America Market Value (USD Million) Forecast by Application, 2020-2035
  • Table 14: North America Market Value (USD Million) Forecast by End-use Feed Type, 2020-2035
  • Table 15: North America Market Value (USD Million) Forecast by Production Method, 2020-2035
  • Table 16: North America Market Value (USD Million) Forecast by Sales Channel, 2020-2035
  • Table 17: Latin America Market Value (USD Million) Forecast by Country, 2020-2035
  • Table 18: Latin America Market Value (USD Million) Forecast by Source, 2020-2035
  • Table 19: Latin America Market Value (USD Million) Forecast by Form, 2020-2035
  • Table 20: Latin America Market Value (USD Million) Forecast by Functionality, 2020-2035
  • Table 21: Latin America Market Value (USD Million) Forecast by Application, 2020-2035
  • Table 22: Latin America Market Value (USD Million) Forecast by End-use Feed Type, 2020-2035
  • Table 23: Latin America Market Value (USD Million) Forecast by Production Method, 2020-2035
  • Table 24: Latin America Market Value (USD Million) Forecast by Sales Channel, 2020-2035
  • Table 25: Europe Market Value (USD Million) Forecast by Country, 2020-2035
  • Table 26: Europe Market Value (USD Million) Forecast by Source, 2020-2035
  • Table 27: Europe Market Value (USD Million) Forecast by Form, 2020-2035
  • Table 28: Europe Market Value (USD Million) Forecast by Functionality, 2020-2035
  • Table 29: Europe Market Value (USD Million) Forecast by Application, 2020-2035
  • Table 30: Europe Market Value (USD Million) Forecast by End-use Feed Type, 2020-2035
  • Table 31: Europe Market Value (USD Million) Forecast by Production Method, 2020-2035
  • Table 32: Europe Market Value (USD Million) Forecast by Sales Channel, 2020-2035
  • Table 33: East Asia Market Value (USD Million) Forecast by Country, 2020-2035
  • Table 34: East Asia Market Value (USD Million) Forecast by Source, 2020-2035
  • Table 35: East Asia Market Value (USD Million) Forecast by Form, 2020-2035
  • Table 36: East Asia Market Value (USD Million) Forecast by Functionality, 2020-2035
  • Table 37: East Asia Market Value (USD Million) Forecast by Application, 2020-2035
  • Table 38: East Asia Market Value (USD Million) Forecast by End-use Feed Type, 2020-2035
  • Table 39: East Asia Market Value (USD Million) Forecast by Production Method, 2020-2035
  • Table 40: East Asia Market Value (USD Million) Forecast by Sales Channel, 2020-2035
  • Table 41: South Asia & Pacific Market Value (USD Million) Forecast by Country, 2020-2035
  • Table 42: South Asia & Pacific Market Value (USD Million) Forecast by Source, 2020-2035
  • Table 43: South Asia & Pacific Market Value (USD Million) Forecast by Form, 2020-2035
  • Table 44: South Asia & Pacific Market Value (USD Million) Forecast by Functionality, 2020-2035
  • Table 45: South Asia & Pacific Market Value (USD Million) Forecast by Application, 2020-2035
  • Table 46: South Asia & Pacific Market Value (USD Million) Forecast by End-use Feed Type, 2020-2035
  • Table 47: South Asia & Pacific Market Value (USD Million) Forecast by Production Method, 2020-2035
  • Table 48: South Asia & Pacific Market Value (USD Million) Forecast by Sales Channel, 2020-2035
  • Table 49: Middle East and Africa Market Value (USD Million) Forecast by Country, 2020-2035
  • Table 50: Middle East and Africa Market Value (USD Million) Forecast by Source, 2020-2035
  • Table 51: Middle East and Africa Market Value (USD Million) Forecast by Form, 2020-2035
  • Table 52: Middle East and Africa Market Value (USD Million) Forecast by Functionality, 2020-2035
  • Table 53: Middle East and Africa Market Value (USD Million) Forecast by Application, 2020-2035
  • Table 54: Middle East and Africa Market Value (USD Million) Forecast by End-use Feed Type, 2020-2035
  • Table 55: Middle East and Africa Market Value (USD Million) Forecast by Production Method, 2020-2035
  • Table 56: Middle East and Africa Market Value (USD Million) Forecast by Sales Channel, 2020-2035

List of Figures

  • Figure 1: Global Market Pricing Analysis
  • Figure 2: Global Market Value (USD Million) Forecast 2020-2035
  • Figure 3: Global Market Value Share and BPS Analysis by Source, 2025 and 2035
  • Figure 4: Global Market Y-o-Y Growth Comparison by Source, 2025-2035
  • Figure 5: Global Market Attractiveness Analysis by Source
  • Figure 6: Global Market Value Share and BPS Analysis by Form, 2025 and 2035
  • Figure 7: Global Market Y-o-Y Growth Comparison by Form, 2025-2035
  • Figure 8: Global Market Attractiveness Analysis by Form
  • Figure 9: Global Market Value Share and BPS Analysis by Functionality, 2025 and 2035
  • Figure 10: Global Market Y-o-Y Growth Comparison by Functionality, 2025-2035
  • Figure 11: Global Market Attractiveness Analysis by Functionality
  • Figure 12: Global Market Value Share and BPS Analysis by Application, 2025 and 2035
  • Figure 13: Global Market Y-o-Y Growth Comparison by Application, 2025-2035
  • Figure 14: Global Market Attractiveness Analysis by Application
  • Figure 15: Global Market Value Share and BPS Analysis by End-use Feed Type, 2025 and 2035
  • Figure 16: Global Market Y-o-Y Growth Comparison by End-use Feed Type, 2025-2035
  • Figure 17: Global Market Attractiveness Analysis by End-use Feed Type
  • Figure 18: Global Market Value Share and BPS Analysis by Production Method, 2025 and 2035
  • Figure 19: Global Market Y-o-Y Growth Comparison by Production Method, 2025-2035
  • Figure 20: Global Market Attractiveness Analysis by Production Method
  • Figure 21: Global Market Value Share and BPS Analysis by Sales Channel, 2025 and 2035
  • Figure 22: Global Market Y-o-Y Growth Comparison by Sales Channel, 2025-2035
  • Figure 23: Global Market Attractiveness Analysis by Sales Channel
  • Figure 24: Global Market Value (USD Million) Share and BPS Analysis by Region, 2025 and 2035
  • Figure 25: Global Market Y-o-Y Growth Comparison by Region, 2025-2035
  • Figure 26: Global Market Attractiveness Analysis by Region
  • Figure 27: North America Market Incremental $ Opportunity, 2025-2035
  • Figure 28: Latin America Market Incremental $ Opportunity, 2025-2035
  • Figure 29: Europe Market Incremental $ Opportunity, 2025-2035
  • Figure 30: East Asia Market Incremental $ Opportunity, 2025-2035
  • Figure 31: South Asia & Pacific Market Incremental $ Opportunity, 2025-2035
  • Figure 32: Middle East and Africa Market Incremental $ Opportunity, 2025-2035
  • Figure 33: North America Market Value Share and BPS Analysis by Country, 2025 and 2035
  • Figure 34: North America Market Value Share and BPS Analysis by Source, 2025 and 2035
  • Figure 35: North America Market Y-o-Y Growth Comparison by Source, 2025-2035
  • Figure 36: North America Market Attractiveness Analysis by Source
  • Figure 37: North America Market Value Share and BPS Analysis by Form, 2025 and 2035
  • Figure 38: North America Market Y-o-Y Growth Comparison by Form, 2025-2035
  • Figure 39: North America Market Attractiveness Analysis by Form
  • Figure 40: North America Market Value Share and BPS Analysis by Functionality, 2025 and 2035
  • Figure 41: North America Market Y-o-Y Growth Comparison by Functionality, 2025-2035
  • Figure 42: North America Market Attractiveness Analysis by Functionality
  • Figure 43: North America Market Value Share and BPS Analysis by Application, 2025 and 2035
  • Figure 44: North America Market Y-o-Y Growth Comparison by Application, 2025-2035
  • Figure 45: North America Market Attractiveness Analysis by Application
  • Figure 46: North America Market Value Share and BPS Analysis by End-use Feed Type, 2025 and 2035
  • Figure 47: North America Market Y-o-Y Growth Comparison by End-use Feed Type, 2025-2035
  • Figure 48: North America Market Attractiveness Analysis by End-use Feed Type
  • Figure 49: North America Market Value Share and BPS Analysis by Production Method, 2025 and 2035
  • Figure 50: North America Market Y-o-Y Growth Comparison by Production Method, 2025-2035
  • Figure 51: North America Market Attractiveness Analysis by Production Method
  • Figure 52: North America Market Value Share and BPS Analysis by Sales Channel, 2025 and 2035
  • Figure 53: North America Market Y-o-Y Growth Comparison by Sales Channel, 2025-2035
  • Figure 54: North America Market Attractiveness Analysis by Sales Channel
  • Figure 55: Latin America Market Value Share and BPS Analysis by Country, 2025 and 2035
  • Figure 56: Latin America Market Value Share and BPS Analysis by Source, 2025 and 2035
  • Figure 57: Latin America Market Y-o-Y Growth Comparison by Source, 2025-2035
  • Figure 58: Latin America Market Attractiveness Analysis by Source
  • Figure 59: Latin America Market Value Share and BPS Analysis by Form, 2025 and 2035
  • Figure 60: Latin America Market Y-o-Y Growth Comparison by Form, 2025-2035
  • Figure 61: Latin America Market Attractiveness Analysis by Form
  • Figure 62: Latin America Market Value Share and BPS Analysis by Functionality, 2025 and 2035
  • Figure 63: Latin America Market Y-o-Y Growth Comparison by Functionality, 2025-2035
  • Figure 64: Latin America Market Attractiveness Analysis by Functionality
  • Figure 65: Latin America Market Value Share and BPS Analysis by Application, 2025 and 2035
  • Figure 66: Latin America Market Y-o-Y Growth Comparison by Application, 2025-2035
  • Figure 67: Latin America Market Attractiveness Analysis by Application
  • Figure 68: Latin America Market Value Share and BPS Analysis by End-use Feed Type, 2025 and 2035
  • Figure 69: Latin America Market Y-o-Y Growth Comparison by End-use Feed Type, 2025-2035
  • Figure 70: Latin America Market Attractiveness Analysis by End-use Feed Type
  • Figure 71: Latin America Market Value Share and BPS Analysis by Production Method, 2025 and 2035
  • Figure 72: Latin America Market Y-o-Y Growth Comparison by Production Method, 2025-2035
  • Figure 73: Latin America Market Attractiveness Analysis by Production Method
  • Figure 74: Latin America Market Value Share and BPS Analysis by Sales Channel, 2025 and 2035
  • Figure 75: Latin America Market Y-o-Y Growth Comparison by Sales Channel, 2025-2035
  • Figure 76: Latin America Market Attractiveness Analysis by Sales Channel
  • Figure 77: Europe Market Value Share and BPS Analysis by Country, 2025 and 2035
  • Figure 78: Europe Market Value Share and BPS Analysis by Source, 2025 and 2035
  • Figure 79: Europe Market Y-o-Y Growth Comparison by Source, 2025-2035
  • Figure 80: Europe Market Attractiveness Analysis by Source
  • Figure 81: Europe Market Value Share and BPS Analysis by Form, 2025 and 2035
  • Figure 82: Europe Market Y-o-Y Growth Comparison by Form, 2025-2035
  • Figure 83: Europe Market Attractiveness Analysis by Form
  • Figure 84: Europe Market Value Share and BPS Analysis by Functionality, 2025 and 2035
  • Figure 85: Europe Market Y-o-Y Growth Comparison by Functionality, 2025-2035
  • Figure 86: Europe Market Attractiveness Analysis by Functionality
  • Figure 87: Europe Market Value Share and BPS Analysis by Application, 2025 and 2035
  • Figure 88: Europe Market Y-o-Y Growth Comparison by Application, 2025-2035
  • Figure 89: Europe Market Attractiveness Analysis by Application
  • Figure 90: Europe Market Value Share and BPS Analysis by End-use Feed Type, 2025 and 2035
  • Figure 91: Europe Market Y-o-Y Growth Comparison by End-use Feed Type, 2025-2035
  • Figure 92: Europe Market Attractiveness Analysis by End-use Feed Type
  • Figure 93: Europe Market Value Share and BPS Analysis by Production Method, 2025 and 2035
  • Figure 94: Europe Market Y-o-Y Growth Comparison by Production Method, 2025-2035
  • Figure 95: Europe Market Attractiveness Analysis by Production Method
  • Figure 96: Europe Market Value Share and BPS Analysis by Sales Channel, 2025 and 2035
  • Figure 97: Europe Market Y-o-Y Growth Comparison by Sales Channel, 2025-2035
  • Figure 98: Europe Market Attractiveness Analysis by Sales Channel
  • Figure 99: East Asia Market Value Share and BPS Analysis by Country, 2025 and 2035
  • Figure 100: East Asia Market Value Share and BPS Analysis by Source, 2025 and 2035
  • Figure 101: East Asia Market Y-o-Y Growth Comparison by Source, 2025-2035
  • Figure 102: East Asia Market Attractiveness Analysis by Source
  • Figure 103: East Asia Market Value Share and BPS Analysis by Form, 2025 and 2035
  • Figure 104: East Asia Market Y-o-Y Growth Comparison by Form, 2025-2035
  • Figure 105: East Asia Market Attractiveness Analysis by Form
  • Figure 106: East Asia Market Value Share and BPS Analysis by Functionality, 2025 and 2035
  • Figure 107: East Asia Market Y-o-Y Growth Comparison by Functionality, 2025-2035
  • Figure 108: East Asia Market Attractiveness Analysis by Functionality
  • Figure 109: East Asia Market Value Share and BPS Analysis by Application, 2025 and 2035
  • Figure 110: East Asia Market Y-o-Y Growth Comparison by Application, 2025-2035
  • Figure 111: East Asia Market Attractiveness Analysis by Application
  • Figure 112: East Asia Market Value Share and BPS Analysis by End-use Feed Type, 2025 and 2035
  • Figure 113: East Asia Market Y-o-Y Growth Comparison by End-use Feed Type, 2025-2035
  • Figure 114: East Asia Market Attractiveness Analysis by End-use Feed Type
  • Figure 115: East Asia Market Value Share and BPS Analysis by Production Method, 2025 and 2035
  • Figure 116: East Asia Market Y-o-Y Growth Comparison by Production Method, 2025-2035
  • Figure 117: East Asia Market Attractiveness Analysis by Production Method
  • Figure 118: East Asia Market Value Share and BPS Analysis by Sales Channel, 2025 and 2035
  • Figure 119: East Asia Market Y-o-Y Growth Comparison by Sales Channel, 2025-2035
  • Figure 120: East Asia Market Attractiveness Analysis by Sales Channel
  • Figure 121: South Asia & Pacific Market Value Share and BPS Analysis by Country, 2025 and 2035
  • Figure 122: South Asia & Pacific Market Value Share and BPS Analysis by Source, 2025 and 2035
  • Figure 123: South Asia & Pacific Market Y-o-Y Growth Comparison by Source, 2025-2035
  • Figure 124: South Asia & Pacific Market Attractiveness Analysis by Source
  • Figure 125: South Asia & Pacific Market Value Share and BPS Analysis by Form, 2025 and 2035
  • Figure 126: South Asia & Pacific Market Y-o-Y Growth Comparison by Form, 2025-2035
  • Figure 127: South Asia & Pacific Market Attractiveness Analysis by Form
  • Figure 128: South Asia & Pacific Market Value Share and BPS Analysis by Functionality, 2025 and 2035
  • Figure 129: South Asia & Pacific Market Y-o-Y Growth Comparison by Functionality, 2025-2035
  • Figure 130: South Asia & Pacific Market Attractiveness Analysis by Functionality
  • Figure 131: South Asia & Pacific Market Value Share and BPS Analysis by Application, 2025 and 2035
  • Figure 132: South Asia & Pacific Market Y-o-Y Growth Comparison by Application, 2025-2035
  • Figure 133: South Asia & Pacific Market Attractiveness Analysis by Application
  • Figure 134: South Asia & Pacific Market Value Share and BPS Analysis by End-use Feed Type, 2025 and 2035
  • Figure 135: South Asia & Pacific Market Y-o-Y Growth Comparison by End-use Feed Type, 2025-2035
  • Figure 136: South Asia & Pacific Market Attractiveness Analysis by End-use Feed Type
  • Figure 137: South Asia & Pacific Market Value Share and BPS Analysis by Production Method, 2025 and 2035
  • Figure 138: South Asia & Pacific Market Y-o-Y Growth Comparison by Production Method, 2025-2035
  • Figure 139: South Asia & Pacific Market Attractiveness Analysis by Production Method
  • Figure 140: South Asia & Pacific Market Value Share and BPS Analysis by Sales Channel, 2025 and 2035
  • Figure 141: South Asia & Pacific Market Y-o-Y Growth Comparison by Sales Channel, 2025-2035
  • Figure 142: South Asia & Pacific Market Attractiveness Analysis by Sales Channel
  • Figure 143: Middle East and Africa Market Value Share and BPS Analysis by Country, 2025 and 2035
  • Figure 144: Middle East and Africa Market Value Share and BPS Analysis by Source, 2025 and 2035
  • Figure 145: Middle East and Africa Market Y-o-Y Growth Comparison by Source, 2025-2035
  • Figure 146: Middle East and Africa Market Attractiveness Analysis by Source
  • Figure 147: Middle East and Africa Market Value Share and BPS Analysis by Form, 2025 and 2035
  • Figure 148: Middle East and Africa Market Y-o-Y Growth Comparison by Form, 2025-2035
  • Figure 149: Middle East and Africa Market Attractiveness Analysis by Form
  • Figure 150: Middle East and Africa Market Value Share and BPS Analysis by Functionality, 2025 and 2035
  • Figure 151: Middle East and Africa Market Y-o-Y Growth Comparison by Functionality, 2025-2035
  • Figure 152: Middle East and Africa Market Attractiveness Analysis by Functionality
  • Figure 153: Middle East and Africa Market Value Share and BPS Analysis by Application, 2025 and 2035
  • Figure 154: Middle East and Africa Market Y-o-Y Growth Comparison by Application, 2025-2035
  • Figure 155: Middle East and Africa Market Attractiveness Analysis by Application
  • Figure 156: Middle East and Africa Market Value Share and BPS Analysis by End-use Feed Type, 2025 and 2035
  • Figure 157: Middle East and Africa Market Y-o-Y Growth Comparison by End-use Feed Type, 2025-2035
  • Figure 158: Middle East and Africa Market Attractiveness Analysis by End-use Feed Type
  • Figure 159: Middle East and Africa Market Value Share and BPS Analysis by Production Method, 2025 and 2035
  • Figure 160: Middle East and Africa Market Y-o-Y Growth Comparison by Production Method, 2025-2035
  • Figure 161: Middle East and Africa Market Attractiveness Analysis by Production Method
  • Figure 162: Middle East and Africa Market Value Share and BPS Analysis by Sales Channel, 2025 and 2035
  • Figure 163: Middle East and Africa Market Y-o-Y Growth Comparison by Sales Channel, 2025-2035
  • Figure 164: Middle East and Africa Market Attractiveness Analysis by Sales Channel
  • Figure 165: Global Market - Tier Structure Analysis
  • Figure 166: Global Market - Company Share Analysis

Frequently Asked Questions

How big is the Plant-Based Methionine Market in 2025?

The global Plant-Based Methionine Market is estimated to be valued at USD 0.85 billion in 2025.

What will be the size of the Plant-Based Methionine Market in 2035?

The market size for the Plant-Based Methionine Market is projected to reach USD 1.53 billion by 2035.

How much will be the Plant-Based Methionine Market growth between 2025 and 2035?

The Plant-Based Methionine Market is expected to grow at a 6.1% CAGR between 2025 and 2035.

What are the key product types in the Plant-Based Methionine Market?

The key product types are L-Methionine, DL-Methionine (plant-origin), and Hydroxy Analog of Methionine (HMTBA).

Which source segment will contribute significant share in the Plant-Based Methionine Market in 2025?

In terms of source, Soy-derived methionine will command 28.4% share in 2025, while Algae-derived methionine will grow fastest at 8.3% CAGR.

Explore Similar Insights

Future Market Insights

Plant-Based Methionine Market