
- Market Size (2026)
- USD 189.2 Mn
- Forecast (2036)
- USD 329.4 Mn
- CAGR (2026 to 2036)
- 5.7%
How big is Polybags Market in 2026?
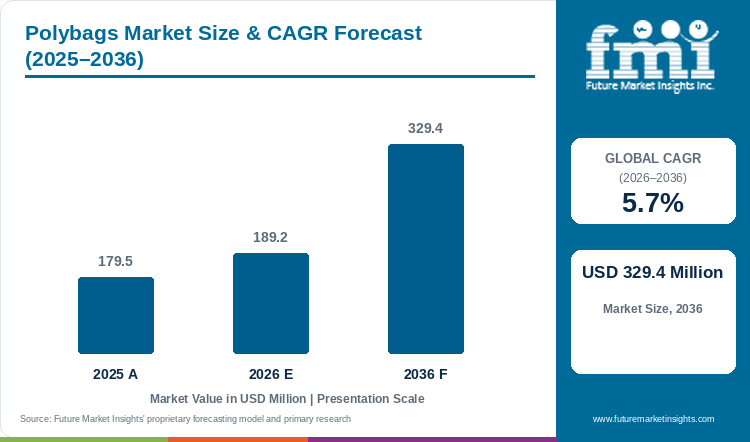
The polybags market demonstrated steady progress from USD 179.5 million in 2025 to USD 189.2 million in 2026, building toward a targeted valuation of USD 329.4 million by 2036 at a CAGR of 5.7%.
Automated e-commerce fulfillment centers and garment finishers are replacing bulky corrugated boxes with lightweight blown-film polybags to cut dimensional parcel freight charges and double hourly packing throughput. Global polybags demand totaled USD 179.5 million in 2025 and will reach an estimated USD 189.2 million in 2026. Overall polybags market value will climb to USD 329.4 million by 2036, reflecting a 5.7% yearly compound expansion rate over the ten-year study period. Low-Density Polyethylene LDPE commands 30.9% of 2026 resin formulation demand as converters extrude clear virgin and recycled LDPE webs that run smoothly with polybag mailers on high-speed impulse sealers. Adoption of certified recycled polyethylene films is reinforced by fiscal plastic taxes, as Amcor partnered with Wilkin and Sons Tiptree in August 2026 to deploy RecyClass-certified 30% post-consumer recycled polyethylene films ahead of United Kingdom Plastic Packaging Tax updates. Film extruders are also consolidating global polyethylene converting capacity, with Amcor completing its combination with Berry Global in 2025 and expanding its unified polyethylene film portfolio in February 2026. FMI sector analysis indicates that fulfillment buyers renew annual polybag supply contracts on verified hot-tack seal integrity and optical barcode scan clarity, and converters that maintain puncture resistance in sub-1.5 mil recycled films hold those accounts through 2036.
Key Market Trends & Insights
- By resin formulation: Low-Density Polyethylene LDPE holds an estimated 30.9% share in 2026 because low-haze branched polyethylene permits rapid optical barcode scanning and clean impulse sealing.
- By structural style: Flat Open-Top Polybags represent 34.6% in 2026 as high-volume garment and hardware packers standardize economical pillow-style bags on manual and semi-automatic sealers.
- By film thickness: Light Duty Under 1.5 Mil accounts for 46.7% in 2026 because apparel finishers and laundry operations minimize resin weight per thousand bags.
- By end-use sector: Retail Apparel and Garment Bags secure 42.1% in 2026 owing to individual shirt and knitwear polybagging at textile factories.
- By sales channel: Direct to Fulfillment and Apparel Brands commands 53.8% in 2026 through custom-printed rollstock and pre-opened bag-on-roll supply contracts.
Regional Highlights
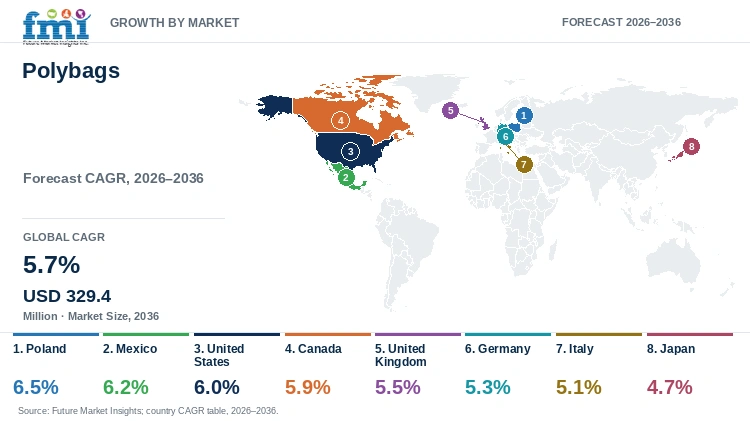
- Top national expansion: Poland leads national growth projections at a 6.5% CAGR through 2036 as Central European e-commerce fashion fulfillment hubs expand automated bagging capacity.
- Broader country progression: Mexico tracks at a 6.2% CAGR ahead of the United States at 6.0% and Canada at 5.9%, whereas Japan advances at a 4.7% CAGR.
Market Size & Forecast
Table 1: Market Size and Forecast for the Polybags Market (USD million and CAGR percentage), 2025 to 2036
| Metric | Value |
|---|---|
| 2025 Market Size | USD 179.5 million |
| Estimated Market Size in 2026 | USD 189.2 million |
| Projected Market Size by 2036 | USD 329.4 million |
| CAGR, 2026 to 2036 | 5.7% |
| Added Value, 2026 to 2036 | USD 140.2 million |
Food packagers and garment exporters require flexible polyethylene bags that prevent moisture ingress and microbial spoilage without relying on migratory chemical additives. When film extruders modify low-density polyethylene matrices with bio-based fillers or compatibilizers, converters improve gas-barrier retention while preserving standard blown-film line speeds. In March 2026, polymer scientists reporting in Carbohydrate Polymers demonstrated that compatibilized cotton-straw LDPE composite films reduce oxygen transmission by up to 55% while maintaining balanced water-vapor permeability for food preservation. Fulfillment operators pair these engineered polybags with protective padded mailers to safeguard delicate retail merchandise during parcel sortation.
Extruded Film Tonnage and Bag Converting Sizing
Table 2: Extruded Film Tonnage and Bag Converting Sizing for the Polybags Market (USD million and operational ranges), 2025 to 2036
| Metric | 2025 | 2026 | 2036 |
|---|---|---|---|
| Market size (USD million) | 179.5 | 189.2 | 329.4 |
| Converted polybag resin volume (thousand metric tons) | 84.5 to 89.0 | 88.5 to 93.5 | 146.0 to 155.0 |
| Light-duty & PCR polybag volume (thousand metric tons) | 42.0 to 45.0 | 45.0 to 48.5 | 82.0 to 88.0 |
| Average realized converted polybag price per metric ton (USD) | 2,020 to 2,130 | 2,030 to 2,145 | 2,130 to 2,260 |
Operational note: Extruded film tonnage and converted bag counts reflect commercial blown-film and cast-film output across LDPE and LLDPE resins. The figures also incorporate HDPE and biodegradable PBAT/PLA blends converted into open-top and gusseted polybags as well as zipper and roll-perforated styles.
Blown-film converters extruding biodegradable polybags from polybutylene adipate-co-terephthalate and polylactic acid blends must overcome low melt strength and bubble instability during thin-gauge drawdown. In July 2025, materials engineers publishing in Polymers demonstrated that reactive twin-screw extrusion of 80% PBAT and 20% PLA blends with 0.1% dicumyl peroxide increases film elongation at break by 200% and tensile strength by 44%. Packaging converters combine these high-elongation bio-resins with sealant web films to produce compostable retail garment and produce bags.
Per Capita & Automated Bagging Line Spending Indicators
Table 3: Per Capita and Automated Bagging Line Indicators for the Polybags Market (USD), 2025 to 2036
| Metric | 2025 | 2026 | 2036 |
|---|---|---|---|
| World population (billion) | 8.2 | 8.3 | 9.0 |
| Market value per 1,000 people (USD) | 21.9 | 22.8 | 36.6 |
| Annual polybag procurement per automated fulfillment line (USD thousand) | 6.8 to 7.6 | 7.1 to 8.0 | 11.5 to 13.0 |
| Post-consumer recycled & bio-blend resin share (%) | 24.0% to 28.0% | 26.5% to 31.0% | 48.0% to 54.0% |
Table 4: Fulfillment Line & Channel Indicators for the Polybags Market (USD million and operational basis), 2026
| Metric | Value | Institutional Reference Basis |
|---|---|---|
| Market size, 2026 | USD 189.2 million | 2026 global polybags valuation baseline |
| Automated roll-bagging & garment lines global | 25,200 lines | Apparel, hardware, food & e-commerce bagging lines |
| Average polybag value per bagging line | USD 7,507.9 | Annualized polybag and rollstock procurement |
| Direct to Fulfillment & Apparel Brands value, 2026 | USD 101.8 million | 53.8% sales channel allocation |
High-speed e-commerce and industrial parts fulfillment centers rely on pre-opened perforated polybags on rolls that index automatically through pneumatic and thermal bagging machines. In its annual Form 10-K report for fiscal 2025 submitted to federal securities regulators in February 2026, Sealed Air Corporation detailed how automated Autobag systems and protective polybag rollstock lower warehouse packing labor per shipped order. Apparel and hardware distributors pair automated roll-bagging webs with outer polyethylene shrink wrap to unitize outbound parcel loads.
Analyst Perspective
"Apparel brands and third-party logistics providers no longer buy polybags as unbranded commodity polyethylene sleeves; they buy certified 30% to 100% post-consumer recycled film that runs jam-free at 40 bags per minute on automated baggers. Extruders that eliminate gel defects and haze in recycled LDPE and LLDPE rollstock will capture multi-year fulfillment contracts."
- Nandini Roy Choudhury, Principal Consultant, Future Market Insights.
How is the polybags market segmented?
The polybags market is segmented by resin formulation, structural style, film thickness, end-use sector, and sales channel. In 2026, Low-Density Polyethylene LDPE is projected at 30.9%, Flat Open-Top Polybags at 34.6%, Light Duty Under 1.5 Mil at 46.7%, Retail Apparel and Garment Bags at 42.1%, and Direct to Fulfillment and Apparel Brands at 53.8%.
By resin formulation: Low-Density Polyethylene LDPE and Linear Low-Density Polyethylene LLDPE. The category also covers High-Density Polyethylene HDPE and Biodegradable Compostable PBAT PLA Blend.
By structural style: Flat Open-Top Polybags and Side and Bottom Gusseted Bags. Zipper Resealable Grip-Seal Bags and Perforated Bags on Roll complete the style breakdown.
By film thickness: Light Duty Under 1.5 Mil and Medium Duty 1.5 to 3.0 Mil. Heavy Duty Above 3.0 Mil serves industrial hardware and bulk parts protection.
By end-use sector: Retail Apparel and Garment Bags with Industrial Hardware and Fasteners. Food and Fresh Produce Packaging and E-Commerce Courier Logistics complete the end-use scope.
By sales channel: Direct to Fulfillment and Apparel Brands with Industrial Packaging Distributors. Foodservice and Retail Supply and Online B2B Packaging Portals serve commercial buyers.
Why does Low-Density Polyethylene LDPE lead the resin formulation category?
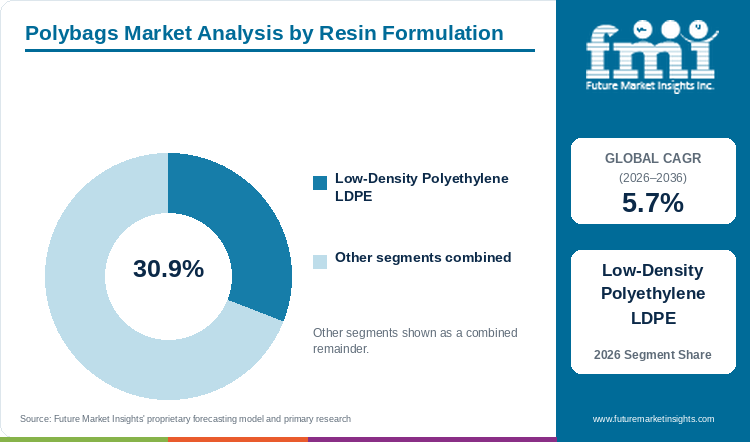
Low-Density Polyethylene LDPE holds an estimated 30.9% of resin formulation demand in 2026, anchored by optical barcode clarity and broad heat-seal tolerances.
Table 5: Resin Formulation Share for the Polybags Market (percentage share), 2026
| Resin Formulation | Share (2026) |
|---|---|
| Low-Density Polyethylene LDPE | 30.9% |
| Other Segments Combined | 69.1%* |
| Total | 100.0% |
Note that remaining resin formulation categories account for the balance of 2026 global polybags market demand.
Table 6: Resin Formulation Leadership and Market Growth for the Polybags Market (segment and CAGR percentage), 2026 to 2036
| Metric | Value |
|---|---|
| Global CAGR (2026 to 2036) | 5.7% |
| Leading Segment | Low-Density Polyethylene LDPE |
Low-density polyethylene produced via high-pressure autoclave or tubular reactors exhibits long-chain branching that delivers low haze and a wide heat-sealing temperature window. Apparel factories and commercial bakeries prefer LDPE polybags over stiffer high-density grades because clear optical transmission allows warehouse scanners to read garment hangtags without opening the bag, complementing stretch film packs used on outer master pallets.
- Low-Density Polyethylene LDPE holds 30.9% of resin formulation value in 2026 because high optical clarity and low seal-initiation temperatures suit automated garment and food bagging.
- A comparative study in the International Journal of Biological Macromolecules in July 2025 confirmed that LDPE films achieve over 70% light transmission and superior moisture barrier stability during 12-week storage trials.
What sustains Flat Open-Top Polybags leadership in the structural style segment?
Flat Open-Top Polybags represent 34.6% of the structural style category in 2026, supported by high-speed tubular extrusion and low converting scrap.
Flat open-top pillow polybags extruded from tubular blown film require only a single bottom heat seal and zero side-gusset folding or zipper-track extrusion steps. Converters supplying pallet stretch films and industrial liners produce flat open-top bags at high linear speeds with minimal trim scrap for shirts and retail fasteners.
- Flat Open-Top Polybags represent 34.6% of the structural style segment in 2026 as garment manufacturers and hardware distributors prioritize low unit cost and rapid heat sealing.
- Amcor published its FY25 Sustainability Report in October 2025, detailing advancements in mono-material polyethylene film extrusion and recycled-content bag converting across global consumer accounts.
How does Light Duty Under 1.5 Mil lead the film thickness category?
Light Duty Under 1.5 Mil formats account for 46.7% of film thickness volume in 2026, driven by garment downgauging and plastic tax weight reduction.
Light duty polybags gauged below 1.5 mil (38 microns) protect folded shirts and dry bakery items against warehouse dust and humidity while minimizing polymer weight per bag. Because extended producer responsibility fees and plastic packaging taxes are assessed per metric ton of resin placed on the market, brands pairing thin-gauge polybags with fresh food packaging formats actively downgauge from 1.5 mil to 1.0 mil.
- Light Duty Under 1.5 Mil accounts for 46.7% of film thickness demand in 2026 because apparel and produce packers downgauge film thickness to reduce resin cost and plastic tax liability.
- The U.S. Environmental Protection Agency reported in May 2026 on mechanical and advanced plastic recycling pathways that support source reduction and thin-gauge polyethylene recovery across commercial waste streams.
Why do Retail Apparel and Garment Bags lead the end-use sector category?
Retail Apparel and Garment Bags secure 42.1% of end-use sector value in 2026, supported by factory-floor SKU bagging and e-commerce fashion returns handling.
Global apparel supply chains require individual transparent polybags at the garment factory floor to protect garments from soil and hanger abrasion across ocean container transit and distribution center sortation. Even as retailers test paper bands for in-store display, e-commerce fashion warehouses retain individual LDPE and recycled-PE garment polybags to prevent returns damage during automated chute sorting.
- Retail Apparel and Garment Bags secure 42.1% of end-use sector demand in 2026 as global clothing exporters and online fashion platforms bag individual SKUs at the point of manufacture.
- A February 2026 techno-economic synthesis in Green Chemistry documented that packaging accounts for 45% of global bio-polymer and flexible film demand as apparel and consumer brands evaluate lower-carbon bag substrates.
What gives Direct to Fulfillment and Apparel Brands the leading position in sales channel?
Direct to Fulfillment and Apparel Brands commands 53.8% of sales channel share in 2026, anchored by custom PCR rollstock and suffocation-warning print specifications.
Large fashion retailers and third-party e-commerce fulfillment operators contract directly with primary polyethylene film extruders to lock in certified post-consumer recycled resin allocations and custom suffocation-warning print layouts. Direct mill contracts also guarantee exact coefficient-of-friction specifications so pre-opened bags feed without double-picking on high-speed automated bagging lines.
- Direct to Fulfillment and Apparel Brands commands 53.8% of sales channel value in 2026 because multinational clothing brands audit PCR resin traceability directly with film converters.
- Amcor received recognition at the 2026 Sustainability and Impact Awards in July 2026 for its recyclable mono-material polyolefin film breakthroughs deployed with global retail brands.
What are the drivers, restraints, and opportunities in the polybags market?
In the polybags market, automated e-commerce order bagging and garment export volume are projected to drive adoption whereas retail single-use plastic restrictions and bio-film composting gaps restrain uncertified films and RecyClass-certified PCR polyethylene creates growth opportunities.
- Driver: Automated e-commerce order fulfillment and garment export volume drive recurring procurement of lightweight LDPE and LLDPE polybags that reduce parcel dimensional weight.
- Restraint: Retail single-use plastic bans and inconsistent industrial composting disintegration of bio-based films restrain conventional virgin polyethylene bag usage.
- Opportunity: Certified 30% to 100% post-consumer recycled polyethylene and reactive-extruded PBAT/PLA compostable films enable tax-exempt circular polybag supply contracts.
Growth Analysis and Future Potential: Automated E-Commerce Bagging and Thin-Gauge Bio-Blends
High-velocity apparel and parcel fulfillment centers are expanding polybag adoption as automated bagging machines replace manual carton packing and cut packaging material weight by over 70% per shipment. Film converters are simultaneously formulating blown-film PBAT and PLA blends that run on standard polyethylene bag-making lines with protective transit packaging systems. In January 2026, polymer researchers reporting in Polymers fabricated melt-extruded blown PBAT and PLA active packaging films incorporating 0.1% to 1.0% rosemary extract that blocked ultraviolet light transmission while preserving mechanical tear strength. Fulfillment buyers consequently specify engineered mono-material PE and compostable blown films to meet corporate scope-3 emissions targets.
Risk Assessment of the Polybags Market: Compostability Gaps and Recycled Resin Gel Defects
Divergent real-world composting disintegration rates and municipal recycling restrictions on thin-gauge flexible films create regulatory compliance friction for polybag buyers. In March 2025, waste management scientists publishing in Waste Management tested commercial biodegradable plastic packaging under simulated industrial composting conditions and found wide variations in disintegration completeness across film thicknesses. Brand owners procuring printed retail packaging and flexible polybags therefore audit third-party RecyClass and ASTM D6400 certifications before approving resin switches.
Commercial Opportunity Analysis: Active Bio-Composite and High-PCR Polybags
Polyethylene and bio-polymer converters capture price premiums by supplying active moisture-regulating and certified post-consumer recycled polybags for fresh produce and export apparel accounts. In November 2025, food packaging researchers in Foods demonstrated that extrusion-blown PBAT and thermoplastic starch films blended with grape seed extract achieve uniform film blowing and active antioxidant protection for perishable goods. Converters pairing certified PCR polyethylene and active blown films with rigid sleeve boxes secure high-margin contracts across grocery and specialty retail channels.
Polybags Market by Country (2026 to 2036)
National growth projections place Poland at the front of polybags demand with a 6.5% CAGR through 2036, whereas Japan records a 4.7% annual pace. Commercial uptake across garment returns hubs in Central Europe and automated fulfillment centers in North America reflects recycled-content tax thresholds and roll-fed bagging automation.
Table 7: Country CAGR and Primary Growth Levers for the Polybags Market (CAGR percentage and operational drivers), 2026 to 2036
| Country | CAGR (2026 to 2036) | Primary Growth Lever |
|---|---|---|
| Poland | 6.5% | Central European fashion e-commerce fulfillment and garment re-bagging hubs |
| Mexico | 6.2% | Nearshored automotive fastener, electronics, and maquiladora export bagging |
| United States | 6.0% | Automated roll-bagging fulfillment lines and dimensional-weight parcel optimization |
| Canada | 5.9% | Cold-crack-resistant LLDPE food bagging and certified PCR e-commerce rollstock |
| United Kingdom | 5.5% | 30% recycled-content Plastic Packaging Tax compliance across apparel and food bags |
| Germany | 5.3% | Precision industrial hardware and spare-parts bagging with high-PCR polyethylene |
| Italy | 5.1% | Luxury knitwear and fashion export polybagging plus PBAT/starch produce bags |
| Japan | 4.7% | Biomass-blended polyethylene and anti-static precision electronics and food bags |
Source: Future Market Insights analysis
Poland Polybags Market Outlook (2026 to 2036)
Polybags demand in Poland will expand at a top 6.5% CAGR through 2036 as major European online fashion platforms and third-party logistics operators concentrate garment fulfillment centers across Silesia and central Poland. Unlike high-cost Western European warehouses, fulfillment hubs in Poland process hundreds of millions of returned and re-bagged apparel items annually for cross-border delivery into Germany and Western Europe. Per the July 2026 Poland Exporter Guide issued by agricultural trade attaches in Warsaw, food and consumer goods imports into Poland surpassed USD 48 billion as modern warehouse infrastructure expanded across central corridors. Local film converters consequently extrude high-clarity recycled LDPE garment bags and perforated rollstock to supply automated re-bagging lines.
Key takeaway: In Poland, cross-border European fashion re-bagging hubs and expanding retail logistics are projected to drive a leading 6.5% CAGR in polybags demand.
Mexico Polybags Market Outlook (2026 to 2036)
Whereas demand in Poland centers on European fashion returns processing, the polybags market in Mexico is driven by nearshored automotive fastener and apparel maquiladora plants shipping directly into the United States. Polybags expenditure in Mexico will advance at a 6.2% annual rate from 2026 to 2036 inside northern border industrial manufacturing parks and domestic commercial food processors. Per the July 2026 Mexico Exporter Guide from USDA Foreign Agricultural Service economists, export-oriented food and industrial assembly plants continue to expand packaging procurement across northern and central states. Export manufacturers in Monterrey and Bajio specify medium-duty and heavy-duty LLDPE gusseted polybags to protect metal hardware and packaged foods during cross-border truck transit.
Key takeaway: In Mexico, nearshored industrial component bagging and expanding food-processing output are forecast to sustain 6.2% CAGR polybags expansion.
United States Polybags Market Outlook (2026 to 2036)
Across the United States, polybags procurement is anchored by high-speed automated roll-bagging machines deployed inside omnichannel retail and hardware fulfillment centers. Sales of polybags in the United States will expand by 6.0% per year across 2026 to 2036 because parcel carriers enforce dimensional-weight tariffs that penalize oversized corrugated boxes. According to the November 2025 quarterly filing by Sonoco Products Company with federal securities regulators, protective and flexible industrial packaging demand remained resilient across domestic fulfillment customers. Domestic blown-film extruders blend linear low-density metallocene resins with post-consumer recycled polyethylene to supply puncture-resistant bags on rolls for automated bagging lines across regional e-commerce and industrial distribution hubs.
Key takeaway: In the United States, dimensional-weight parcel economics and automated roll-bagging installations are anticipated to drive 6.0% CAGR polybags growth.
Canada Polybags Market Outlook (2026 to 2036)
Polybags demand in Canada is slated to rise at a 5.9% CAGR through 2036 as grocery chains and e-commerce hubs transition toward recyclable mono-material polyethylene and certified compostable bags. Unlike single-use checkout bag categories subject to federal prohibitions, commercial garment polybags and automated courier rollstock remain essential across distribution centers in Canada. Per the July 2026 Canada Exporter Guide from USDA Foreign Agricultural Service trade specialists, bilateral consumer goods shipments between Canada and the United States represent 25% of U.S. agricultural exports across integrated supply chains. Blown-film plants in Toronto and Montreal therefore deliver cold-crack-resistant LLDPE and high-PCR LDPE polybags for frozen food processors and national apparel warehouses.
Key takeaway: In Canada, cold-resistant LLDPE food bagging and high-PCR e-commerce fulfillment rollstock are estimated to support 5.9% CAGR progression.
United Kingdom Polybags Market Outlook (2026 to 2036)
What distinguishes the polybags market in the United Kingdom from continental Europe is the fiscal enforcement of the UK Plastic Packaging Tax, which charges per-ton levies on plastic packaging containing less than 30% recycled content. Revenue from polybags across the United Kingdom is anticipated to climb at a 5.6% annual rate from 2026 through 2036 as clothing brands and parcel couriers convert virgin LDPE mailers to certified recycled films. In September 2026, the UK Department for Business and Trade released updated compliance guidance covering European Union Regulation 2025/40 recyclability and recycled-content thresholds for cross-channel exporters. Domestic converters consequently supply RecyClass-certified 30% to 50% post-consumer recycled polybags that exempt retail buyers from statutory plastic tax charges.
Key takeaway: In the United Kingdom, the 30% recycled-content Plastic Packaging Tax threshold is projected to drive 5.5% CAGR demand for certified PCR polybags.
Germany Polybags Market Outlook (2026 to 2036)
In Germany, polybags consumption is shaped by rigorous Duales System recovery fees and automotive and machinery spare-parts export logistics that require anti-corrosion and heavy-duty polyethylene bagging across automated warehouses. Polybags demand across Germany is forecast to gain at a 5.3% CAGR from 2026 to 2036 across industrial hardware packagers and online apparel distributors operating across central logistics corridors. Per the July 2026 Germany Exporter Guide issued by USDA Foreign Agricultural Service researchers, importers and retailers across Germany enforce strict packaging recyclability and material recovery standards across commercial deliveries. Film extruders in Germany supply co-extruded LDPE and LLDPE grip-seal and gusseted polybags engineered with high post-industrial and post-consumer recyclate content.
Key takeaway: In Germany, precision automotive spare-parts bagging and circular packaging fee schedules are slated to sustain 5.3% CAGR polybags expansion.
Italy Polybags Market Outlook (2026 to 2036)
Italy diverges from northern European polybag markets through its dual concentration in luxury knitwear and garment export polybagging as well as pioneer adoption of biodegradable PBAT and starch-blend produce bags. Demand for polybags in Italy is likely to increase at a 5.1% CAGR through 2036 across textile districts in Prato and Carpi as well as modern supermarket produce aisles. Per the July 2026 Italy Exporter Guide published by USDA Foreign Agricultural Service staff, modern grocery distribution and packaged goods logistics in Italy require certified recyclable or compostable flexible films across retail chains. Converters in Italy supply ultra-clear virgin and PCR LDPE garment bags with resealable adhesive strips to protect export fashion collections.
Key takeaway: In Italy, luxury garment export protection and biodegradable produce bag mandates are likely to support 5.1% CAGR polybags growth.
Japan Polybags Market Outlook (2026 to 2036)
Unlike bulk industrial bagging markets in the Americas, the polybags market in Japan emphasizes ultra-thin polyethylene and biomass-blended bags used for convenience-store food portions and department-store apparel across urban retail networks. Polybags revenue across Japan will rise by 4.7% annually from 2026 to 2036 as domestic converters incorporate sugarcane bio-polyethylene and chemically recycled polyolefins into commercial film extruders. Per the April 2026 Tokyo agricultural trade assessment on packaged food ingredients, domestic food manufacturers and retailers prioritize high-clarity inner protective wrapping across packaged goods. Film manufacturers in Japan engineer precision anti-static and low-extractable LDPE polybags to protect semiconductor sub-assemblies and chilled retail foods across domestic distribution.
Key takeaway: In Japan, biomass-blended polyethylene adoption and precision electronics and food portion bagging are predicted to sustain 4.7% CAGR growth.
Full report country CAGRs cover: North America; Latin America; Western Europe; Eastern Europe; East Asia; South Asia and Pacific; Middle East and Africa.
Who are the notable companies in the polybags market?
Amcor plc, Berry Global Group Inc., Sealed Air Corporation, Mondi Group plc, Smurfit Westrock plc, Sonoco Products Company, Huhtamaki Oyj, International Paper Company, DS Smith plc, and Tetra Pak International SA are the notable companies in the polybags market.
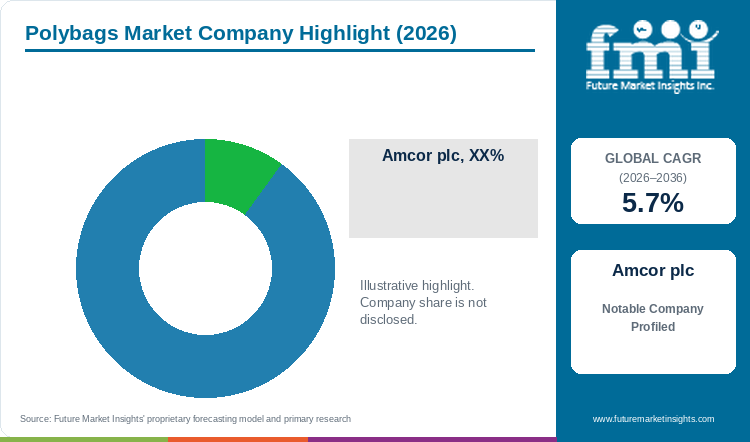
Competitive positioning in the polybags industry separates global polyethylene blown-film and flexible packaging leaders from automated bagging systems specialists and multi-substrate paper and fiber converters. Amcor and Berry Global with Mondi extrude virgin and post-consumer recycled mono-material polyethylene films and bags across global converting plants. Sealed Air and Sonoco with Huhtamaki engineer automated roll-bagging systems and specialty flexible barrier packs, while Smurfit Westrock and International Paper with DS Smith and Tetra Pak compete via fiber mailers and paperboard alternatives.
- Global Polyethylene Film and Polybag Extrusion Leaders: Amcor plc and Berry Global Group Inc. with Mondi Group plc operate blown-film and cast-film extrusion lines producing LDPE and LLDPE with certified PCR polybags.
- Automated Bagging Systems and Specialty Flexible Converters: Sealed Air Corporation and Sonoco Products Company with Huhtamaki Oyj supply pre-opened polybags on rolls and high-speed Autobag equipment with flexible food pouches.
- Adjacent Fiber Mailer and Paperboard Packaging Competitors: Smurfit Westrock plc and International Paper Company with DS Smith plc and Tetra Pak International SA provide paper mailers and fiber cartons that compete for retail fulfillment accounts.
Competitive Benchmarking: Polybags Market
Table 8: Competitive Benchmarking for the Polybags Market (qualitative capability ratings), 2026
| Company | Blown-Film PE & PCR Extrusion Scale | Automated Roll-Bagging Integration | Circular & Bio-Polymer Formulation | Geographic Reach |
|---|---|---|---|---|
| Amcor plc | High | High | High | Global polyethylene film and bag network across 40+ countries after Berry combination |
| Berry Global Group Inc. | High | High | High | Global blown-film PE, PCR shrink, and garment polybag operations within Amcor |
| Sealed Air Corporation | High | High | High | Global Autobag roll-fed polybag systems and protective fulfillment network |
| Mondi Group plc | High | Medium | High | European and international mono-material polyethylene and hybrid bag converting |
| Sonoco Products Company | Medium | Medium | High | North American and international flexible film, resin, and industrial bag supply |
| Huhtamaki Oyj | Medium | Medium | High | European and Asian mono-material flexible polyethylene and foodservice packaging |
| Smurfit Westrock plc | Unscored | Medium | High | Global e-commerce fulfillment packaging and paper mailer alternative network |
| International Paper Company | Unscored | Medium | Medium | North American and European e-commerce transit packaging and fulfillment supply |
| DS Smith plc | Unscored | Medium | High | European e-commerce fashion and retail fulfillment packaging solutions |
| Tetra Pak International SA | Unscored | Medium | High | Global food barrier packaging and renewable polymer-replacement R&D network |
Scoring basis: Blown-Film PE & PCR Extrusion Scale evaluates virgin and post-consumer recycled polyethylene resin compounding and film-blowing capacity, whereas Automated Roll-Bagging Integration rates compatibility with high-speed e-commerce bagging machinery. Circular & Bio-Polymer Formulation measures documented deployment of RecyClass-certified PCR or PBAT/PLA compostable polybag grades.
Key Developments in the Polybags Market
- Polymer researchers publishing in Polymers on April 10, 2026 developed multifunctional PBAT and curcumin bioactive composite blown films that improve UV barrier and antioxidant shelf-life performance in flexible packaging.
- Smurfit Westrock plc published its 2025 Sustainability Report on April 28, 2026, detailing certified chain-of-custody packaging operations and circular fulfillment solutions across global retail accounts.
- Huhtamaki Oyj released its 2025 Annual Report on February 19, 2026, documenting operational investments in mono-material flexible polyethylene and recyclable packaging across Europe and Asia.
Key Players in the Polybags Market
Global Polyethylene Film and Polybag Extrusion Leaders
- Amcor plc
- Berry Global Group Inc.
- Mondi Group plc
- Sealed Air Corporation
Automated Bagging Systems and Specialty Flexible Converters
- Sonoco Products Company
- Huhtamaki Oyj
- Smurfit Westrock plc
- International Paper Company
Adjacent Fiber Mailer and Paperboard Packaging Competitors
- DS Smith plc
- Tetra Pak International SA
Polybags Market - Report Scope
Table 9: Report Scope for the Polybags Market (coverage fields and definitions), 2026 to 2036
| Coverage field | Report scope |
|---|---|
| Market breakdown | Resin Formulation; Structural Style; Film Thickness; End-Use Sector; Sales Channel |
| Quantitative Units | USD Million |
| Market Definition | Includes commercial converter revenue from blown-film and cast-film polybags fabricated from LDPE, LLDPE, HDPE, post-consumer recycled polyethylene, and biodegradable PBAT/PLA blends across flat open-top, gusseted, zipper resealable, and perforated roll-fed styles. Category Scope Note: Excludes retail T-shirt grocery checkout carrier bags, heavy-duty woven polypropylene FIBC bulk bags, and multi-layer aluminum-foil retort pouches. |
| Regions Covered | North America; Latin America; Western Europe; Eastern Europe; East Asia; South Asia and Pacific; Middle East and Africa |
| Countries Covered | Poland, Mexico, United States, Canada, United Kingdom, Germany, Italy, Japan, and additional countries in the full report |
| Key Companies Covered | Amcor plc, Berry Global Group Inc., Sealed Air Corporation, Mondi Group plc, Smurfit Westrock plc, Sonoco Products Company, Huhtamaki Oyj, International Paper Company, DS Smith plc, Tetra Pak International SA |
| Forecast Period | 2026 to 2036 |
| Approach | Primary and secondary research with top-down and bottom-up extruded tonnage and ASP triangulation. |
Polybags Market - Research Methodology
Table 10: Research Methodology for the Polybags Market (research methods and approach), 2026 edition
| Method | Approach |
|---|---|
| Primary Research | Structured interviews with blown-film extrusion plant managers, apparel fulfillment engineering directors, PCR resin compounders, and automated bagging equipment integrators to validate mil thickness and per-thousand bag pricing. |
| Secondary Research | Analysis of U.S. EPA plastic recycling reports, Eurostat packaging waste registries, UK Plastic Packaging Tax guidance, USDA FAS Exporter Guide reports, SEC Form 10-K filings, and peer-reviewed polymer extrusion studies. |
| Market Sizing and Forecasting | Top-down flexible polyethylene packaging baselines reconciled against bottom-up converted polybag resin tonnage (88.5K to 93.5K metric tons in 2026) and realized selling prices per metric ton from 2026 to 2036. |
| Country Forecasting Model | Econometric country projections weight automated roll-bagging machine installations, garment export and e-commerce return volumes, statutory PCR tax thresholds, and nearshored hardware manufacturing across eight national markets. |
| Operational Benchmark Traceability | Extruded film tonnage and bagging line indicators in Tables 2, 3, and 4 trace to SEC Form 10-K fulfillment disclosures, Green Chemistry bio-packaging benchmarks, and RecyClass PCR certification audits. |
| Data Triangulation and Validation | Valuation estimates isolate protective merchandise, garment, hardware, produce, and roll-fed fulfillment polybags while strictly excluding checkout carrier bags, trash can liners, and heavy woven sacks. Child market represents 7.2% of the Global Industrial and Consumer Packaging Market. |
Polybags Market by Segments
Polybags Market segmented by Resin Formulation:
- Low-Density Polyethylene LDPE
- Linear Low-Density Polyethylene LLDPE
- High-Density Polyethylene HDPE
- Biodegradable Compostable PBAT PLA Blend
Polybags Market segmented by Structural Style:
- Flat Open-Top Polybags
- Side and Bottom Gusseted Bags
- Zipper Resealable Grip-Seal Bags
- Perforated Bags on Roll
Polybags Market segmented by Film Thickness:
- Light Duty Under 1.5 Mil
- Medium Duty 1.5 to 3.0 Mil
- Heavy Duty Above 3.0 Mil
- Extra Heavy Industrial Above 4.0 Mil
- Micro-Thin High-Yield Under 1.0 Mil
Polybags Market segmented by End-Use Sector:
- Retail Apparel and Garment Bags
- Industrial Hardware and Fasteners
- Food and Fresh Produce Packaging
- E-Commerce Courier Logistics
Polybags Market segmented by Sales Channel:
- Direct to Fulfillment and Apparel Brands
- Industrial Packaging Distributors
- Foodservice and Retail Supply
- Online B2B Packaging Portals
Polybags Market by Region
- North America
- United States
- Canada
- Latin America
- Brazil
- Mexico
- Argentina
- Chile
- Western Europe
- Germany
- France
- United Kingdom
- Italy
- Spain
- Benelux
- Nordics
- Eastern Europe
- Poland
- Czech Republic
- Romania
- Hungary
- East Asia
- China
- Japan
- South Korea
- South Asia and Pacific
- India
- ASEAN
- Australia and New Zealand
- Middle East and Africa
- GCC Countries
- South Africa
- Türkiye
- Israel
Research Sources and Bibliography
- [1] Amcor plc. (2026, August 25). Amcor and Tiptree adopt RecyClass-certified 30% PCR polyethylene films ahead of UK Plastic Packaging Tax updates. Amcor Corporate Media News.
- [2] Amcor plc. (2026, February 10). Combination with Berry Global provides comprehensive polyethylene shrink and flexible film portfolio. Amcor Corporate Media News.
- [3] Wang, L., Chen, H., & Zhang, Y. (2026, March 15). Toward sustainable LDPE packaging films from cotton straw with reduced oxygen transmission and improved food preservation. Carbohydrate Polymers, 352, 123410 (PMC13185940).
- [4] Naser, A. Z., Deiab, I., & Darras, B. M. (2025, July 31). Stretchability and Melt Strength Enhancement of Biodegradable PBAT and PLA Polymer Blends for Packaging Solutions. Polymers, 17(15), 2088 (PubMed PMID 40807386).
- [5] Sealed Air Corporation. (2026, February 24). Form 10-K Annual Report for the Fiscal Year Ended December 31, 2025. U.S. Securities and Exchange Commission EDGAR Filing.
- [6] Silva, R. M., Costa, P., & Oliveira, F. (2025, July 3). Comparative study of packaging performance of thermoplastic starch and PBAT blends versus low-density polyethylene. International Journal of Biological Macromolecules, 312, 144102 (PubMed PMID 40614991).
- [7] Amcor plc. (2025, October 27). Amcor FY25 Sustainability Report details circular polyethylene film and recycled resin integration. Amcor Corporate Media News.
- [8] U.S. Environmental Protection Agency. (2026, May 22). Advanced and Mechanical Recycling of Polyethylene and Municipal Solid Waste Plastics. U.S. EPA Office of Resource Conservation and Recovery.
- [9] Kumar, V., & Singh, A. (2026, February 18). Beyond fossil plastics and next-generation PLA and PBAT bio-packaging for consumer and food applications. Green Chemistry, 28(4), 1120-1148 (PMC13001162).
- [10] Amcor plc. (2026, July 30). Amcor wins Gold and Silver at Sustainability and Impact Awards 2026 for mono-material polyolefin packaging. Amcor Corporate Media News.
- [11] Li, X., & Zhao, Q. (2026, January 8). Active Packaging Films from PBAT and PLA Fabricated via Melt Extrusion and Blown Film Processing. Polymers, 18(2), 214 (PMC12844194).
- [12] Briassoulis, D., & Pikasi, A. (2025, March 12). Disintegration of commercial biodegradable plastic packaging products under simulated industrial composting conditions. Waste Management, 196, 114-126 (PubMed PMID 40075087).
- [13] Chen, M., & Liu, Z. (2025, November 28). Extrusion-Blown PBAT and Thermoplastic Starch Active Films for Flexible Bag Packaging. Foods, 14(23), 4012 (PMC12692432).
- [14] USDA Foreign Agricultural Service. (2026, July 27). Poland Exporter Guide Annual and Retail Distribution Logistics Assessment. U.S. Department of Agriculture GAIN Report PL2026-0014.
- [15] USDA Foreign Agricultural Service. (2026, July 7). Mexico Exporter Guide Annual and Food Processing and Retail Packaging Overview. U.S. Department of Agriculture GAIN Report MX2026-0029.
- [16] Sonoco Products Company. (2025, November 6). Form 10-Q Quarterly Report for the Period Ended September 28, 2025. U.S. Securities and Exchange Commission EDGAR Filing.
- [17] USDA Foreign Agricultural Service. (2026, July 31). Canada Exporter Guide Annual and Cross-Border Consumer Goods Trade. U.S. Department of Agriculture GAIN Report CA2026-0022.
- [18] UK Department for Business and Trade. (2026, September 4). EU Packaging and Packaging Waste Regulation 2025/40 compliance guidance for exporters. Business.gov.uk Regulatory Guidance.
- [19] USDA Foreign Agricultural Service. (2026, July 1). Germany Exporter Guide Annual and Packaged Goods Import Standards. U.S. Department of Agriculture GAIN Report GM2026-0015.
- [20] USDA Foreign Agricultural Service. (2026, July 3). Italy Exporter Guide Annual and Retail Food Packaging Channels. U.S. Department of Agriculture GAIN Report IT2026-0012.
- [21] USDA Foreign Agricultural Service. (2026, April 15). Japan Food Processing Ingredients Annual and Retail Packaging Specifications. U.S. Department of Agriculture GAIN Report JA2026-0012.
- [22] Zhang, W., & Zhou, J. (2026, April 10). Multifunctional PBAT and Curcumin Bioactive Composite Films with Enhanced Barrier Performance. Polymers, 18(8), 1195 (PMC13516504).
- [23] Smurfit Westrock plc. (2026, April 28). Smurfit Westrock 2025 Sustainability Report and Certified Packaging Operations. Smurfit Westrock Corporate Publications.
- [24] Huhtamaki Oyj. (2026, February 19). Huhtamaki Annual Report 2025 Flexible and Fiber Packaging Financial Review. Huhtamaki Global Corporate Publications.
- [25] USDA Foreign Agricultural Service. (2026, July 9). China Notifies WTO of Amendment to Mandatory Packaging Standards for Foods and Cosmetics GB23350. U.S. Department of Agriculture GAIN Report CH2026-0088.
- [26] USDA Foreign Agricultural Service. (2025, September 26). India Retail Foods Annual and E-Commerce Grocery Packaging Expansion. U.S. Department of Agriculture GAIN Report IN2025-0055.
- [27] European Commission Eurostat. (2026, October 16). Packaging waste statistics and plastic recycling rate benchmarks across European Union member states. Eurostat Statistics Explained PDF Archive.
- [28] Huhtamaki Oyj. (2025, December 15). Huhtamaki financial reporting schedule and packaging segment disclosures for 2026. Huhtamaki Stock Exchange Release.
- [29] USDA Foreign Agricultural Service. (2025, September 24). Germany Retail Foods Annual and Private-Label Packaging Procurement. U.S. Department of Agriculture GAIN Report GM2025-0028.
- [30] USDA Foreign Agricultural Service. (2025, June 30). Germany Exporter Guide Annual and Consumer Packaging Compliance. U.S. Department of Agriculture GAIN Report GM2025-0013.
This bibliography is provided for reader reference and is not exhaustive. The full report contains the complete reference list and detailed citations.
This Report Answers
- How large is the polybags market in 2026 and what is forecast for 2036?
- Which e-commerce fulfillment automation and recycled plastic tax rules support demand for polybags?
- Why does Low-Density Polyethylene LDPE lead the resin formulation category?
- Why do Flat Open-Top Polybags and Light Duty Under 1.5 Mil films lead their categories globally?
- How do national growth rates compare across Poland and Mexico with the United States and Canada?
- Which leading companies supply blown-film polyethylene bags versus automated roll-bagging systems?
- What composting disintegration gaps and recycled resin gel defects restrain polybag converters?
- What should apparel and fulfillment buyers evaluate when qualifying 30% to 50% PCR polybags?
Table of Content
- Key Takeaways
- Market Size and CAGR
- Top Growth Driver
- Fastest Growing Segment
- Leading Region
- Key Companies
- Emerging Opportunities
- Executive Summary
- Global Market Outlook
- Demand-side Trends
- Supply-side Trends
- Technology Roadmap Analysis
- Analysis and Recommendations
- Analyst Perspective (What is happening? Why now? What should investors know?)
- Key Questions Answered
- How large is the market?
- What is the CAGR?
- What are key trends?
- Which region dominates?
- Who are the leaders?
Read More...
- Market Overview
- Market Coverage / Taxonomy
- Market Definition / Scope / Limitations
- Research Methodology
- Chapter Orientation
- Analytical Lens and Working Hypotheses
- Market Structure, Signals, and Trend Drivers
- Benchmarking and Cross-market Comparability
- Market Sizing, Forecasting, and Opportunity Mapping
- Research Design and Evidence Framework
- Desk Research Programme (Secondary Evidence)
- Expert Input and Fieldwork (Primary Evidence)
- Tooling, Models, and Reference Databases
- Data Engineering and Model Build
- Quality Assurance and Audit Trail
- Market Background
- Market Dynamics (Drivers, Restraints, Opportunity, Trends)
- Scenario Forecast (Optimistic, Likely, Conservative)
- Impact Analysis
- AI Impact
- Sustainability Impact
- Regulatory Impact
- Technology Impact
- Consumer / Buyer Analysis
- Purchase Drivers
- Adoption Barriers
- Buyer Journey
- Opportunity Map Analysis
- Product Life Cycle Analysis
- Supply Chain Analysis
- Investment Feasibility Matrix
- Value Chain Analysis
- PESTLE and Porter's Analysis
- Regulatory Landscape
- Regional Parent Market Outlook
- Production and Consumption Statistics
- Import and Export Statistics
- Global Market Analysis and Forecast, 2021 to 2036
- Historical Market Size Value (USD Million) Analysis, 2021 to 2025
- Current and Future Market Size Value (USD Million) Projections, 2026 to 2036
- Y-o-Y Growth Trend Analysis
- Absolute $ Opportunity Analysis
- Global Market Pricing Analysis, 2021 to 2036
- Global Market Analysis and Forecast, By Resin Formulation, 2021 to 2036
- Introduction / Key Findings
- Historical Market Size Value (USD Million) Analysis By Resin Formulation, 2021 to 2025
- Current and Future Market Size Value (USD Million) Analysis and Forecast By Resin Formulation, 2026 to 2036
- Low-Density Polyethylene LDPE
- Linear Low-Density Polyethylene LLDPE
- High-Density Polyethylene HDPE
- Biodegradable Compostable PBAT PLA Blend
- Y-o-Y Growth Trend Analysis By Resin Formulation, 2021 to 2025
- Absolute $ Opportunity Analysis By Resin Formulation, 2026 to 2036
- Global Market Analysis and Forecast, By Structural Style, 2021 to 2036
- Introduction / Key Findings
- Historical Market Size Value (USD Million) Analysis By Structural Style, 2021 to 2025
- Current and Future Market Size Value (USD Million) Analysis and Forecast By Structural Style, 2026 to 2036
- Flat Open-Top Polybags
- Side and Bottom Gusseted Bags
- Zipper Resealable Grip-Seal Bags
- Perforated Bags on Roll
- Y-o-Y Growth Trend Analysis By Structural Style, 2021 to 2025
- Absolute $ Opportunity Analysis By Structural Style, 2026 to 2036
- Global Market Analysis and Forecast, By Film Thickness, 2021 to 2036
- Introduction / Key Findings
- Historical Market Size Value (USD Million) Analysis By Film Thickness, 2021 to 2025
- Current and Future Market Size Value (USD Million) Analysis and Forecast By Film Thickness, 2026 to 2036
- Light Duty Under 1.5 Mil
- Medium Duty 1.5 to 3.0 Mil
- Heavy Duty Above 3.0 Mil
- Extra Heavy Industrial Above 4.0 Mil
- Micro-Thin High-Yield Under 1.0 Mil
- Y-o-Y Growth Trend Analysis By Film Thickness, 2021 to 2025
- Absolute $ Opportunity Analysis By Film Thickness, 2026 to 2036
- Global Market Analysis and Forecast, By End-Use Sector, 2021 to 2036
- Introduction / Key Findings
- Historical Market Size Value (USD Million) Analysis By End-Use Sector, 2021 to 2025
- Current and Future Market Size Value (USD Million) Analysis and Forecast By End-Use Sector, 2026 to 2036
- Retail Apparel and Garment Bags
- Industrial Hardware and Fasteners
- Food and Fresh Produce Packaging
- E-Commerce Courier Logistics
- Y-o-Y Growth Trend Analysis By End-Use Sector, 2021 to 2025
- Absolute $ Opportunity Analysis By End-Use Sector, 2026 to 2036
- Global Market Analysis and Forecast, By Sales Channel, 2021 to 2036
- Introduction / Key Findings
- Historical Market Size Value (USD Million) Analysis By Sales Channel, 2021 to 2025
- Current and Future Market Size Value (USD Million) Analysis and Forecast By Sales Channel, 2026 to 2036
- Direct to Fulfillment and Apparel Brands
- Industrial Packaging Distributors
- Foodservice and Retail Supply
- Online B2B Packaging Portals
- Y-o-Y Growth Trend Analysis By Sales Channel, 2021 to 2025
- Absolute $ Opportunity Analysis By Sales Channel, 2026 to 2036
- Global Market Analysis and Forecast, By Region, 2021 to 2036
- Introduction
- Historical Market Size Value (USD Million) Analysis By Region, 2021 to 2025
- Current Market Size Value (USD Million) Analysis and Forecast By Region, 2026 to 2036
- North America
- Latin America
- Western Europe
- Eastern Europe
- East Asia
- South Asia and Pacific
- Middle East and Africa
- Market Attractiveness Analysis By Region
- North America Market Analysis and Forecast, By Country, 2021 to 2036
- Historical Market Size Value (USD Million) Trend Analysis By Market Taxonomy, 2021 to 2025
- Market Size Value (USD Million) Forecast By Market Taxonomy, 2026 to 2036
- By Country
- United States
- Canada
- By Resin Formulation
- By Structural Style
- By Film Thickness
- By End-Use Sector
- By Sales Channel
- By Country
- Market Attractiveness Analysis
- By Country
- By Resin Formulation
- By Structural Style
- By Film Thickness
- By End-Use Sector
- By Sales Channel
- Key Takeaways
- Latin America Market Analysis and Forecast, By Country
- Historical Market Size Value (USD Million) Trend Analysis By Market Taxonomy, 2021 to 2025
- Market Size Value (USD Million) Forecast By Market Taxonomy, 2026 to 2036
- By Country
- Brazil
- Mexico
- Argentina
- Chile
- By Resin Formulation
- By Structural Style
- By Film Thickness
- By End-Use Sector
- By Sales Channel
- By Country
- Market Attractiveness Analysis
- By Country
- By Resin Formulation
- By Structural Style
- By Film Thickness
- By End-Use Sector
- By Sales Channel
- Key Takeaways
- Western Europe Market Analysis and Forecast, By Country
- Historical Market Size Value (USD Million) Trend Analysis By Market Taxonomy, 2021 to 2025
- Market Size Value (USD Million) Forecast By Market Taxonomy, 2026 to 2036
- By Country
- Germany
- France
- United Kingdom
- Italy
- Spain
- Benelux
- Nordics
- By Resin Formulation
- By Structural Style
- By Film Thickness
- By End-Use Sector
- By Sales Channel
- By Country
- Market Attractiveness Analysis
- By Country
- By Resin Formulation
- By Structural Style
- By Film Thickness
- By End-Use Sector
- By Sales Channel
- Key Takeaways
- Eastern Europe Market Analysis and Forecast, By Country
- Historical Market Size Value (USD Million) Trend Analysis By Market Taxonomy, 2021 to 2025
- Market Size Value (USD Million) Forecast By Market Taxonomy, 2026 to 2036
- By Country
- Poland
- Czech Republic
- Romania
- Hungary
- By Resin Formulation
- By Structural Style
- By Film Thickness
- By End-Use Sector
- By Sales Channel
- By Country
- Market Attractiveness Analysis
- By Country
- By Resin Formulation
- By Structural Style
- By Film Thickness
- By End-Use Sector
- By Sales Channel
- Key Takeaways
- East Asia Market Analysis and Forecast, By Country
- Historical Market Size Value (USD Million) Trend Analysis By Market Taxonomy, 2021 to 2025
- Market Size Value (USD Million) Forecast By Market Taxonomy, 2026 to 2036
- By Country
- China
- Japan
- South Korea
- By Resin Formulation
- By Structural Style
- By Film Thickness
- By End-Use Sector
- By Sales Channel
- By Country
- Market Attractiveness Analysis
- By Country
- By Resin Formulation
- By Structural Style
- By Film Thickness
- By End-Use Sector
- By Sales Channel
- Key Takeaways
- South Asia and Pacific Market Analysis and Forecast, By Country
- Historical Market Size Value (USD Million) Trend Analysis By Market Taxonomy, 2021 to 2025
- Market Size Value (USD Million) Forecast By Market Taxonomy, 2026 to 2036
- By Country
- India
- ASEAN
- Australia and New Zealand
- By Resin Formulation
- By Structural Style
- By Film Thickness
- By End-Use Sector
- By Sales Channel
- By Country
- Market Attractiveness Analysis
- By Country
- By Resin Formulation
- By Structural Style
- By Film Thickness
- By End-Use Sector
- By Sales Channel
- Key Takeaways
- Middle East and Africa Market Analysis and Forecast, By Country
- Historical Market Size Value (USD Million) Trend Analysis By Market Taxonomy, 2021 to 2025
- Market Size Value (USD Million) Forecast By Market Taxonomy, 2026 to 2036
- By Country
- GCC Countries
- South Africa
- Türkiye
- Israel
- By Resin Formulation
- By Structural Style
- By Film Thickness
- By End-Use Sector
- By Sales Channel
- By Country
- Market Attractiveness Analysis
- By Country
- By Resin Formulation
- By Structural Style
- By Film Thickness
- By End-Use Sector
- By Sales Channel
- Key Takeaways
- Key Countries Market Analysis
- United States
- Pricing Analysis
- Market Share Analysis, 2025
- By Resin Formulation
- By Structural Style
- By Film Thickness
- By End-Use Sector
- By Sales Channel
- Canada
- Pricing Analysis
- Market Share Analysis, 2025
- By Resin Formulation
- By Structural Style
- By Film Thickness
- By End-Use Sector
- By Sales Channel
- Mexico
- Pricing Analysis
- Market Share Analysis, 2025
- By Resin Formulation
- By Structural Style
- By Film Thickness
- By End-Use Sector
- By Sales Channel
- Brazil
- Pricing Analysis
- Market Share Analysis, 2025
- By Resin Formulation
- By Structural Style
- By Film Thickness
- By End-Use Sector
- By Sales Channel
- Chile
- Pricing Analysis
- Market Share Analysis, 2025
- By Resin Formulation
- By Structural Style
- By Film Thickness
- By End-Use Sector
- By Sales Channel
- Germany
- Pricing Analysis
- Market Share Analysis, 2025
- By Resin Formulation
- By Structural Style
- By Film Thickness
- By End-Use Sector
- By Sales Channel
- United Kingdom
- Pricing Analysis
- Market Share Analysis, 2025
- By Resin Formulation
- By Structural Style
- By Film Thickness
- By End-Use Sector
- By Sales Channel
- Italy
- Pricing Analysis
- Market Share Analysis, 2025
- By Resin Formulation
- By Structural Style
- By Film Thickness
- By End-Use Sector
- By Sales Channel
- Spain
- Pricing Analysis
- Market Share Analysis, 2025
- By Resin Formulation
- By Structural Style
- By Film Thickness
- By End-Use Sector
- By Sales Channel
- France
- Pricing Analysis
- Market Share Analysis, 2025
- By Resin Formulation
- By Structural Style
- By Film Thickness
- By End-Use Sector
- By Sales Channel
- India
- Pricing Analysis
- Market Share Analysis, 2025
- By Resin Formulation
- By Structural Style
- By Film Thickness
- By End-Use Sector
- By Sales Channel
- ASEAN
- Pricing Analysis
- Market Share Analysis, 2025
- By Resin Formulation
- By Structural Style
- By Film Thickness
- By End-Use Sector
- By Sales Channel
- Australia and New Zealand
- Pricing Analysis
- Market Share Analysis, 2025
- By Resin Formulation
- By Structural Style
- By Film Thickness
- By End-Use Sector
- By Sales Channel
- China
- Pricing Analysis
- Market Share Analysis, 2025
- By Resin Formulation
- By Structural Style
- By Film Thickness
- By End-Use Sector
- By Sales Channel
- Japan
- Pricing Analysis
- Market Share Analysis, 2025
- By Resin Formulation
- By Structural Style
- By Film Thickness
- By End-Use Sector
- By Sales Channel
- South Korea
- Pricing Analysis
- Market Share Analysis, 2025
- By Resin Formulation
- By Structural Style
- By Film Thickness
- By End-Use Sector
- By Sales Channel
- Poland
- Pricing Analysis
- Market Share Analysis, 2025
- By Resin Formulation
- By Structural Style
- By Film Thickness
- By End-Use Sector
- By Sales Channel
- Hungary
- Pricing Analysis
- Market Share Analysis, 2025
- By Resin Formulation
- By Structural Style
- By Film Thickness
- By End-Use Sector
- By Sales Channel
- Türkiye
- Pricing Analysis
- Market Share Analysis, 2025
- By Resin Formulation
- By Structural Style
- By Film Thickness
- By End-Use Sector
- By Sales Channel
- South Africa
- Pricing Analysis
- Market Share Analysis, 2025
- By Resin Formulation
- By Structural Style
- By Film Thickness
- By End-Use Sector
- By Sales Channel
- United States
- Market Structure Analysis
- Competition Dashboard
- Competition Benchmarking
- Market Share Analysis of Top Players
- By Regional
- By Resin Formulation
- By Structural Style
- By Film Thickness
- By End-Use Sector
- By Sales Channel
- Emerging Startups
- Innovation Benchmarking
- Competition Analysis
- Competition Deep Dive
- Amcor plc
- Overview
- Product Portfolio
- Profitability by Market Segments
- Sales Footprint
- Strategy Overview
- Marketing Strategy
- Product Strategy
- Channel Strategy
- Berry Global Group Inc.
- Sealed Air Corporation
- Mondi Group plc
- Sonoco Products Company
- Huhtamaki Oyj
- Smurfit Westrock plc
- International Paper Company
- DS Smith plc
- Tetra Pak International SA
- Amcor plc
- Case Studies
- Success Stories
- Recent Developments
- Competition Deep Dive
- Assumptions & Acronyms Used
List of Tables
- Table 1: Global Market Value (USD Million) Forecast by Region, 2021 to 2036
- Table 2: Global Market Value (USD Million) Forecast by Resin Formulation, 2021 to 2036
- Table 3: Global Market Value (USD Million) Forecast by Structural Style, 2021 to 2036
- Table 4: Global Market Value (USD Million) Forecast by Film Thickness, 2021 to 2036
- Table 5: Global Market Value (USD Million) Forecast by End-Use Sector, 2021 to 2036
- Table 6: Global Market Value (USD Million) Forecast by Sales Channel, 2021 to 2036
- Table 7: North America Market Value (USD Million) Forecast by Country, 2021 to 2036
- Table 8: North America Market Value (USD Million) Forecast by Resin Formulation, 2021 to 2036
- Table 9: North America Market Value (USD Million) Forecast by Structural Style, 2021 to 2036
- Table 10: North America Market Value (USD Million) Forecast by Film Thickness, 2021 to 2036
- Table 11: North America Market Value (USD Million) Forecast by End-Use Sector, 2021 to 2036
- Table 12: North America Market Value (USD Million) Forecast by Sales Channel, 2021 to 2036
- Table 13: Latin America Market Value (USD Million) Forecast by Country, 2021 to 2036
- Table 14: Latin America Market Value (USD Million) Forecast by Resin Formulation, 2021 to 2036
- Table 15: Latin America Market Value (USD Million) Forecast by Structural Style, 2021 to 2036
- Table 16: Latin America Market Value (USD Million) Forecast by Film Thickness, 2021 to 2036
- Table 17: Latin America Market Value (USD Million) Forecast by End-Use Sector, 2021 to 2036
- Table 18: Latin America Market Value (USD Million) Forecast by Sales Channel, 2021 to 2036
- Table 19: Western Europe Market Value (USD Million) Forecast by Country, 2021 to 2036
- Table 20: Western Europe Market Value (USD Million) Forecast by Resin Formulation, 2021 to 2036
- Table 21: Western Europe Market Value (USD Million) Forecast by Structural Style, 2021 to 2036
- Table 22: Western Europe Market Value (USD Million) Forecast by Film Thickness, 2021 to 2036
- Table 23: Western Europe Market Value (USD Million) Forecast by End-Use Sector, 2021 to 2036
- Table 24: Western Europe Market Value (USD Million) Forecast by Sales Channel, 2021 to 2036
- Table 25: Eastern Europe Market Value (USD Million) Forecast by Country, 2021 to 2036
- Table 26: Eastern Europe Market Value (USD Million) Forecast by Resin Formulation, 2021 to 2036
- Table 27: Eastern Europe Market Value (USD Million) Forecast by Structural Style, 2021 to 2036
- Table 28: Eastern Europe Market Value (USD Million) Forecast by Film Thickness, 2021 to 2036
- Table 29: Eastern Europe Market Value (USD Million) Forecast by End-Use Sector, 2021 to 2036
- Table 30: Eastern Europe Market Value (USD Million) Forecast by Sales Channel, 2021 to 2036
- Table 31: East Asia Market Value (USD Million) Forecast by Country, 2021 to 2036
- Table 32: East Asia Market Value (USD Million) Forecast by Resin Formulation, 2021 to 2036
- Table 33: East Asia Market Value (USD Million) Forecast by Structural Style, 2021 to 2036
- Table 34: East Asia Market Value (USD Million) Forecast by Film Thickness, 2021 to 2036
- Table 35: East Asia Market Value (USD Million) Forecast by End-Use Sector, 2021 to 2036
- Table 36: East Asia Market Value (USD Million) Forecast by Sales Channel, 2021 to 2036
- Table 37: South Asia and Pacific Market Value (USD Million) Forecast by Country, 2021 to 2036
- Table 38: South Asia and Pacific Market Value (USD Million) Forecast by Resin Formulation, 2021 to 2036
- Table 39: South Asia and Pacific Market Value (USD Million) Forecast by Structural Style, 2021 to 2036
- Table 40: South Asia and Pacific Market Value (USD Million) Forecast by Film Thickness, 2021 to 2036
- Table 41: South Asia and Pacific Market Value (USD Million) Forecast by End-Use Sector, 2021 to 2036
- Table 42: South Asia and Pacific Market Value (USD Million) Forecast by Sales Channel, 2021 to 2036
- Table 43: Middle East and Africa Market Value (USD Million) Forecast by Country, 2021 to 2036
- Table 44: Middle East and Africa Market Value (USD Million) Forecast by Resin Formulation, 2021 to 2036
- Table 45: Middle East and Africa Market Value (USD Million) Forecast by Structural Style, 2021 to 2036
- Table 46: Middle East and Africa Market Value (USD Million) Forecast by Film Thickness, 2021 to 2036
- Table 47: Middle East and Africa Market Value (USD Million) Forecast by End-Use Sector, 2021 to 2036
- Table 48: Middle East and Africa Market Value (USD Million) Forecast by Sales Channel, 2021 to 2036
List of Figures
- Figure 1: Global Market Pricing Analysis
- Figure 2: Global Market Value (USD Million) Forecast 2021-2036
- Figure 3: Global Market Value Share and BPS Analysis by Resin Formulation, 2026 and 2036
- Figure 4: Global Market Y-o-Y Growth Comparison by Resin Formulation, 2026-2036
- Figure 5: Global Market Attractiveness Analysis by Resin Formulation
- Figure 6: Global Market Value Share and BPS Analysis by Structural Style, 2026 and 2036
- Figure 7: Global Market Y-o-Y Growth Comparison by Structural Style, 2026-2036
- Figure 8: Global Market Attractiveness Analysis by Structural Style
- Figure 9: Global Market Value Share and BPS Analysis by Film Thickness, 2026 and 2036
- Figure 10: Global Market Y-o-Y Growth Comparison by Film Thickness, 2026-2036
- Figure 11: Global Market Attractiveness Analysis by Film Thickness
- Figure 12: Global Market Value Share and BPS Analysis by End-Use Sector, 2026 and 2036
- Figure 13: Global Market Y-o-Y Growth Comparison by End-Use Sector, 2026-2036
- Figure 14: Global Market Attractiveness Analysis by End-Use Sector
- Figure 15: Global Market Value Share and BPS Analysis by Sales Channel, 2026 and 2036
- Figure 16: Global Market Y-o-Y Growth Comparison by Sales Channel, 2026-2036
- Figure 17: Global Market Attractiveness Analysis by Sales Channel
- Figure 18: Global Market Value (USD Million) Share and BPS Analysis by Region, 2026 and 2036
- Figure 19: Global Market Y-o-Y Growth Comparison by Region, 2026-2036
- Figure 20: Global Market Attractiveness Analysis by Region
- Figure 21: North America Market Incremental Dollar Opportunity, 2026-2036
- Figure 22: Latin America Market Incremental Dollar Opportunity, 2026-2036
- Figure 23: Western Europe Market Incremental Dollar Opportunity, 2026-2036
- Figure 24: Eastern Europe Market Incremental Dollar Opportunity, 2026-2036
- Figure 25: East Asia Market Incremental Dollar Opportunity, 2026-2036
- Figure 26: South Asia and Pacific Market Incremental Dollar Opportunity, 2026-2036
- Figure 27: Middle East and Africa Market Incremental Dollar Opportunity, 2026-2036
- Figure 28: North America Market Value Share and BPS Analysis by Country, 2026 and 2036
- Figure 29: North America Market Value Share and BPS Analysis by Resin Formulation, 2026 and 2036
- Figure 30: North America Market Y-o-Y Growth Comparison by Resin Formulation, 2026-2036
- Figure 31: North America Market Attractiveness Analysis by Resin Formulation
- Figure 32: North America Market Value Share and BPS Analysis by Structural Style, 2026 and 2036
- Figure 33: North America Market Y-o-Y Growth Comparison by Structural Style, 2026-2036
- Figure 34: North America Market Attractiveness Analysis by Structural Style
- Figure 35: North America Market Value Share and BPS Analysis by Film Thickness, 2026 and 2036
- Figure 36: North America Market Y-o-Y Growth Comparison by Film Thickness, 2026-2036
- Figure 37: North America Market Attractiveness Analysis by Film Thickness
- Figure 38: North America Market Value Share and BPS Analysis by End-Use Sector, 2026 and 2036
- Figure 39: North America Market Y-o-Y Growth Comparison by End-Use Sector, 2026-2036
- Figure 40: North America Market Attractiveness Analysis by End-Use Sector
- Figure 41: North America Market Value Share and BPS Analysis by Sales Channel, 2026 and 2036
- Figure 42: North America Market Y-o-Y Growth Comparison by Sales Channel, 2026-2036
- Figure 43: North America Market Attractiveness Analysis by Sales Channel
- Figure 44: Latin America Market Value Share and BPS Analysis by Country, 2026 and 2036
- Figure 45: Latin America Market Value Share and BPS Analysis by Resin Formulation, 2026 and 2036
- Figure 46: Latin America Market Y-o-Y Growth Comparison by Resin Formulation, 2026-2036
- Figure 47: Latin America Market Attractiveness Analysis by Resin Formulation
- Figure 48: Latin America Market Value Share and BPS Analysis by Structural Style, 2026 and 2036
- Figure 49: Latin America Market Y-o-Y Growth Comparison by Structural Style, 2026-2036
- Figure 50: Latin America Market Attractiveness Analysis by Structural Style
- Figure 51: Latin America Market Value Share and BPS Analysis by Film Thickness, 2026 and 2036
- Figure 52: Latin America Market Y-o-Y Growth Comparison by Film Thickness, 2026-2036
- Figure 53: Latin America Market Attractiveness Analysis by Film Thickness
- Figure 54: Latin America Market Value Share and BPS Analysis by End-Use Sector, 2026 and 2036
- Figure 55: Latin America Market Y-o-Y Growth Comparison by End-Use Sector, 2026-2036
- Figure 56: Latin America Market Attractiveness Analysis by End-Use Sector
- Figure 57: Latin America Market Value Share and BPS Analysis by Sales Channel, 2026 and 2036
- Figure 58: Latin America Market Y-o-Y Growth Comparison by Sales Channel, 2026-2036
- Figure 59: Latin America Market Attractiveness Analysis by Sales Channel
- Figure 60: Western Europe Market Value Share and BPS Analysis by Country, 2026 and 2036
- Figure 61: Western Europe Market Value Share and BPS Analysis by Resin Formulation, 2026 and 2036
- Figure 62: Western Europe Market Y-o-Y Growth Comparison by Resin Formulation, 2026-2036
- Figure 63: Western Europe Market Attractiveness Analysis by Resin Formulation
- Figure 64: Western Europe Market Value Share and BPS Analysis by Structural Style, 2026 and 2036
- Figure 65: Western Europe Market Y-o-Y Growth Comparison by Structural Style, 2026-2036
- Figure 66: Western Europe Market Attractiveness Analysis by Structural Style
- Figure 67: Western Europe Market Value Share and BPS Analysis by Film Thickness, 2026 and 2036
- Figure 68: Western Europe Market Y-o-Y Growth Comparison by Film Thickness, 2026-2036
- Figure 69: Western Europe Market Attractiveness Analysis by Film Thickness
- Figure 70: Western Europe Market Value Share and BPS Analysis by End-Use Sector, 2026 and 2036
- Figure 71: Western Europe Market Y-o-Y Growth Comparison by End-Use Sector, 2026-2036
- Figure 72: Western Europe Market Attractiveness Analysis by End-Use Sector
- Figure 73: Western Europe Market Value Share and BPS Analysis by Sales Channel, 2026 and 2036
- Figure 74: Western Europe Market Y-o-Y Growth Comparison by Sales Channel, 2026-2036
- Figure 75: Western Europe Market Attractiveness Analysis by Sales Channel
- Figure 76: Eastern Europe Market Value Share and BPS Analysis by Country, 2026 and 2036
- Figure 77: Eastern Europe Market Value Share and BPS Analysis by Resin Formulation, 2026 and 2036
- Figure 78: Eastern Europe Market Y-o-Y Growth Comparison by Resin Formulation, 2026-2036
- Figure 79: Eastern Europe Market Attractiveness Analysis by Resin Formulation
- Figure 80: Eastern Europe Market Value Share and BPS Analysis by Structural Style, 2026 and 2036
- Figure 81: Eastern Europe Market Y-o-Y Growth Comparison by Structural Style, 2026-2036
- Figure 82: Eastern Europe Market Attractiveness Analysis by Structural Style
- Figure 83: Eastern Europe Market Value Share and BPS Analysis by Film Thickness, 2026 and 2036
- Figure 84: Eastern Europe Market Y-o-Y Growth Comparison by Film Thickness, 2026-2036
- Figure 85: Eastern Europe Market Attractiveness Analysis by Film Thickness
- Figure 86: Eastern Europe Market Value Share and BPS Analysis by End-Use Sector, 2026 and 2036
- Figure 87: Eastern Europe Market Y-o-Y Growth Comparison by End-Use Sector, 2026-2036
- Figure 88: Eastern Europe Market Attractiveness Analysis by End-Use Sector
- Figure 89: Eastern Europe Market Value Share and BPS Analysis by Sales Channel, 2026 and 2036
- Figure 90: Eastern Europe Market Y-o-Y Growth Comparison by Sales Channel, 2026-2036
- Figure 91: Eastern Europe Market Attractiveness Analysis by Sales Channel
- Figure 92: East Asia Market Value Share and BPS Analysis by Country, 2026 and 2036
- Figure 93: East Asia Market Value Share and BPS Analysis by Resin Formulation, 2026 and 2036
- Figure 94: East Asia Market Y-o-Y Growth Comparison by Resin Formulation, 2026-2036
- Figure 95: East Asia Market Attractiveness Analysis by Resin Formulation
- Figure 96: East Asia Market Value Share and BPS Analysis by Structural Style, 2026 and 2036
- Figure 97: East Asia Market Y-o-Y Growth Comparison by Structural Style, 2026-2036
- Figure 98: East Asia Market Attractiveness Analysis by Structural Style
- Figure 99: East Asia Market Value Share and BPS Analysis by Film Thickness, 2026 and 2036
- Figure 100: East Asia Market Y-o-Y Growth Comparison by Film Thickness, 2026-2036
- Figure 101: East Asia Market Attractiveness Analysis by Film Thickness
- Figure 102: East Asia Market Value Share and BPS Analysis by End-Use Sector, 2026 and 2036
- Figure 103: East Asia Market Y-o-Y Growth Comparison by End-Use Sector, 2026-2036
- Figure 104: East Asia Market Attractiveness Analysis by End-Use Sector
- Figure 105: East Asia Market Value Share and BPS Analysis by Sales Channel, 2026 and 2036
- Figure 106: East Asia Market Y-o-Y Growth Comparison by Sales Channel, 2026-2036
- Figure 107: East Asia Market Attractiveness Analysis by Sales Channel
- Figure 108: South Asia and Pacific Market Value Share and BPS Analysis by Country, 2026 and 2036
- Figure 109: South Asia and Pacific Market Value Share and BPS Analysis by Resin Formulation, 2026 and 2036
- Figure 110: South Asia and Pacific Market Y-o-Y Growth Comparison by Resin Formulation, 2026-2036
- Figure 111: South Asia and Pacific Market Attractiveness Analysis by Resin Formulation
- Figure 112: South Asia and Pacific Market Value Share and BPS Analysis by Structural Style, 2026 and 2036
- Figure 113: South Asia and Pacific Market Y-o-Y Growth Comparison by Structural Style, 2026-2036
- Figure 114: South Asia and Pacific Market Attractiveness Analysis by Structural Style
- Figure 115: South Asia and Pacific Market Value Share and BPS Analysis by Film Thickness, 2026 and 2036
- Figure 116: South Asia and Pacific Market Y-o-Y Growth Comparison by Film Thickness, 2026-2036
- Figure 117: South Asia and Pacific Market Attractiveness Analysis by Film Thickness
- Figure 118: South Asia and Pacific Market Value Share and BPS Analysis by End-Use Sector, 2026 and 2036
- Figure 119: South Asia and Pacific Market Y-o-Y Growth Comparison by End-Use Sector, 2026-2036
- Figure 120: South Asia and Pacific Market Attractiveness Analysis by End-Use Sector
- Figure 121: South Asia and Pacific Market Value Share and BPS Analysis by Sales Channel, 2026 and 2036
- Figure 122: South Asia and Pacific Market Y-o-Y Growth Comparison by Sales Channel, 2026-2036
- Figure 123: South Asia and Pacific Market Attractiveness Analysis by Sales Channel
- Figure 124: Middle East and Africa Market Value Share and BPS Analysis by Country, 2026 and 2036
- Figure 125: Middle East and Africa Market Value Share and BPS Analysis by Resin Formulation, 2026 and 2036
- Figure 126: Middle East and Africa Market Y-o-Y Growth Comparison by Resin Formulation, 2026-2036
- Figure 127: Middle East and Africa Market Attractiveness Analysis by Resin Formulation
- Figure 128: Middle East and Africa Market Value Share and BPS Analysis by Structural Style, 2026 and 2036
- Figure 129: Middle East and Africa Market Y-o-Y Growth Comparison by Structural Style, 2026-2036
- Figure 130: Middle East and Africa Market Attractiveness Analysis by Structural Style
- Figure 131: Middle East and Africa Market Value Share and BPS Analysis by Film Thickness, 2026 and 2036
- Figure 132: Middle East and Africa Market Y-o-Y Growth Comparison by Film Thickness, 2026-2036
- Figure 133: Middle East and Africa Market Attractiveness Analysis by Film Thickness
- Figure 134: Middle East and Africa Market Value Share and BPS Analysis by End-Use Sector, 2026 and 2036
- Figure 135: Middle East and Africa Market Y-o-Y Growth Comparison by End-Use Sector, 2026-2036
- Figure 136: Middle East and Africa Market Attractiveness Analysis by End-Use Sector
- Figure 137: Middle East and Africa Market Value Share and BPS Analysis by Sales Channel, 2026 and 2036
- Figure 138: Middle East and Africa Market Y-o-Y Growth Comparison by Sales Channel, 2026-2036
- Figure 139: Middle East and Africa Market Attractiveness Analysis by Sales Channel
- Figure 140: Global Market - Tier Structure Analysis
- Figure 141: Global Market - Company Share Analysis
Frequently Asked Questions
How big is the polybags market in 2026, and what is forecast for 2036?
Global polybags sales totaled USD 179.5 million in 2025 and reached an estimated USD 189.2 million in 2026. Category revenue will reach USD 329.4 million by 2036 while apparel factories and e-commerce warehouses adopt certified post-consumer recycled polyethylene and roll-fed automated bagging films.
What is the CAGR for the polybags market from 2026 to 2036?
Global polybags demand will advance at a 5.7% CAGR between 2026 and 2036, creating USD 140.2 million in incremental revenue across garment and fulfillment bagging operations.
Which resin formulation segment leads the polybags market?
Low-Density Polyethylene LDPE holds 30.9% of resin formulation demand in 2026 because high optical clarity and broad heat-seal windows support high-speed garment and produce bagging.
Which film thickness segment leads the polybags market?
Light Duty Under 1.5 Mil films represent 46.7% of the film thickness category in 2026 as apparel and retail packers downgauge bag thickness to cut resin weight and plastic tax exposure.
Which country has a notable growth outlook during the assessment period?
Poland achieves the fastest national growth at a 6.5% CAGR through 2036, fueled by pan-European fashion returns centers and third-party fulfillment warehouses.
Who are the key players in the market?
Amcor plc and Mondi Group plc lead polybag film extrusion with Berry Global Group Inc. and Sealed Air Corporation. Additional notable converters include Huhtamaki Oyj and International Paper Company with Sonoco Products Company and Smurfit Westrock plc as well as DS Smith plc and Tetra Pak International SA.
Preview the report firsthand - request a free sample
Get SampleGet the brochure for pricing and purchase details.
Get PDF
