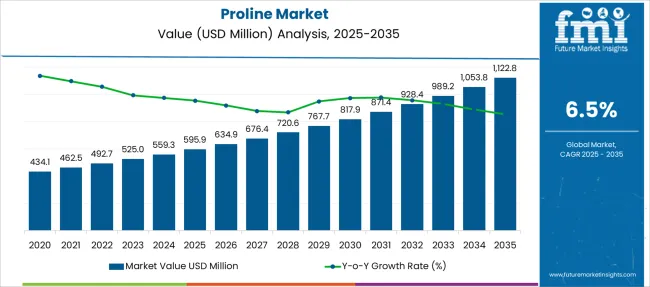
The global proline market size is expected to reach USD 559.30 Million in 2032. The proline market is growing rapidly.
As per FMI Analysts, the global Proline market is estimated to be valued at USD 462.50 Million in 2022 and is projected to increase at a CAGR of 6.54% in the forecast period from 2022 to 2032.
Report Attribute | Details |
---|---|
Proline Market Estimated Base Year Value (2021) | USD 434.11 Million |
Proline Market Expected Market Value (2022) | USD 462.50 Million |
Proline Market Anticipated Forecast Value (2032) | USD 559.30 Million |
Proline Market Projected Growth Rate (2022 to 2032) | 6.54% CAGR |
Proline's application to support skin health has been the most studied in the last few years, however, the pharmaceutical segment is projected to experience the fastest growth of the proline market over the forecast period, due to the most prevalent use of proline in pharmaceutical applications when providing solutions for heart diseases.
Due to modern production technology and large to scale production of proline, proline has become relatively inexpensive, which has contributed to the growth of the proline market. However, the price instability of raw materials and fluctuating regulations across different regions are expected to compromise the growth rate of the market.
Proline is supported by athletes who, due to prolonged exercise, experience decreases in proline levels; an increase in proline supplements has been documented in the past few years. The growing health awareness among consumers has encouraged manufacturers to introduce new health and nutritional supplements.
Market growth of proline in the regional market is expected to be influenced by rising production of amino acids and growth in exports of feed additives from key countries such as China and Japan.
It is expected that the increasing use of feed additives containing a proportionate amount of prominent amino acids, such as lysine, methionine, and threonine, in order to improve animal performance is a key driver of the regional market. But rising demand for high to quality meat and meat products is also anticipated to fuel the market for proline in the feed industry.
As the Asian continent continues to grow rapidly, manufacturers are focusing their efforts on expanding their business. Research and development to develop effective proline to based health supplements is expected to offer lucrative opportunities for the proline market in North America. Since it has gained significant popularity, the market is expected to grow significantly.
Ajinomoto, a leading manufacturer of amino acids, authorized a Chinese company to produce amino acids for animal feed. Meihua Holdings Group will manufacture amino acids for the animal feed applications under the agreement.
The proline market has received a lot of traction in the industry.
Proline is most often found in pharmaceutical applications to provide solutions for heart diseases, exhibiting the fastest growth over the forecast period. The numerous applications of proline to support skin health have been the primary focus of research in the past few years, whereas the pharmaceutical segment is expected to experience the fastest growth of the proline market over the forecast period.
In response to growing health awareness among consumers, manufacturers of health and nutritional supplements have developed a series of health supplements, and this has led to increased demand for proline. This has been influenced by athletes who undergo prolonged workouts and experience decreases in proline levels, which is why proline supplements have increased in popularity in recent years.
The increasing production of amino acids in the region as well as the exports of feed additives from key countries, such as China and Japan, will contribute to the growth of the proline market on a regional basis.
The technological advancements such as modern production technologies, combined with large-scale production of proline, contribute to the reasonable price of the product, contributing positively to proline market growth. However, the fluctuating regulatory environment in different regions and price volatility of raw materials will decrease the growth rate of the proline market somewhat.
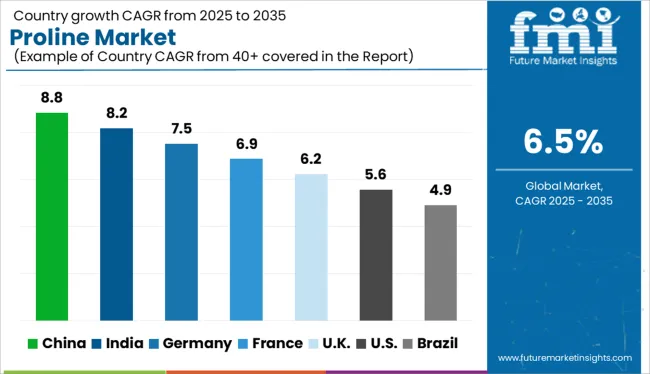
It is estimated that the regional market growth of the proline market will be driven by the growing production of amino acids in the region and growing exports of feed additives from key countries including China and Japan.
It is expected that growing demand for high-quality meat and meat products is expected to fuel the feed additives market in Europe, which, in turn, will fuel the amino acids consumption within the feed industry. Moreover, the use of animal feed additives that contain prominent amino acids such as lysine, methionine, and threonine for improving animal growth performance is expected to contribute to the growth in demand of proline in the regional market.
Proline-based health supplements have gained tremendous popularity in North America; due to this popularity, the market in North America is expected to grow substantially in the near future. In Asia Pacific, manufacturers are focusing on expansion as the region is emerging rapidly. Also, growth in research and development to launch efficient proline products is expected to offer lucrative opportunities for the growth of the proline market.
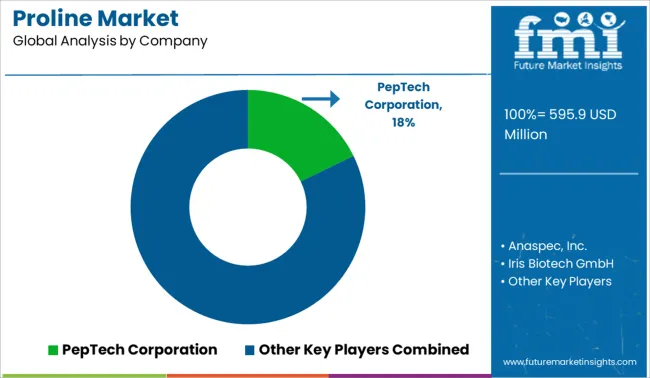
Some of the leading companies operating in the global proline market include PepTech Corporation, Anaspec, Inc., Iris Biotech GmbH, Ajinomoto Co. Inc.
As part of a recent agreement, Ajinomoto, a leading manufacturer of amino acids, authorized a Chinese company to produce amino acids for animal feed. Meihua Holdings Group will manufacture amino acids for the animal feed applications under the agreement.
Proline supplementation has increased in popularity in recent years due to increased health awareness among consumers; this has prompted manufacturers to introduce a variety of supplements; this has ultimately led to an increase in demand for proline. If athletes engage in prolonged workout sessions, the levels of proline decrease; this has led to an increase in proline supplementation.
Proline is becoming more affordable due to technological developments, along with large-scale production, which has contributed to the strong growth of the proline market. However, price instability of raw materials, in conjunction with fluctuating regulations, are expected to impede the market's growth rate a little.
Report Attribute | Details |
---|---|
Growth Rate | CAGR of 6.54% from 2022 to 2032 |
Base Year for Estimation | 2021 |
Historical Data | 2015 to 2021 |
Forecast Period | 2022 to 2032 |
Quantitative Units | Revenue in USD Billion, Volume in Kilotons and CAGR from 2022 to 2032 |
Report Coverage | Revenue Forecast, Volume Forecast, Company Ranking, Competitive Landscape, Growth Factors, Trends and Pricing Analysis |
Segments Covered | Product Type, Grade, End User, Region |
Regions Covered | North America; Latin America; Europe; East Asia; South Asia; Oceania ; Middle East and Africa |
Key Countries Profiled | USA, Canada, Brazil, Mexico, Germany, UK, France, Spain, Italy, Russia, Poland, Australia, New Zealand, China, India, Japan, South Korea, Thailand, Malaysia, Vietnam, Indonesia, GCC, Turkey, South Africa, North Africa |
Key Companies Profiled | PepTech Corporation; Anaspec, Inc.; Iris Biotech GmbH; Ajinomoto Co. Inc.; ChemPep Inc.; KYOWA HAKKO BIO CO., LTD.; Wuhan Vanz Pharm Inc.; Xi'an Huisun Bio to Tech Co., Ltd.; Star Lake; Wuxi Jinghai Amino Acid Co., Ltd; Hubei Bafeng Pharmaceutical and Chemical Share Co., Ltd.; Shijiazhuang Baokang Biotechnology Co., Ltd.; Xinjiang Meihua Amino Acid Co., Ltd.; Xi'an Natural Field Bio to Technique Co., Ltd.; Xi'an Lyphar Biotech Co., Ltd. |
Customization | Available Upon Request |
Table 1: Global Proline Market Value (US$ Mn) Forecast by Region, 2017-2032
Table 2: Global Proline Market Volume (Tons) Forecast by Region, 2017-2032
Table 3: Global Proline Market Value (US$ Mn) Forecast by Product Type, 2017-2032
Table 4: Global Proline Market Volume (Tons) Forecast by Product Type, 2017-2032
Table 5: Global Proline Market Value (US$ Mn) Forecast by Grade, 2017-2032
Table 6: Global Proline Market Volume (Tons) Forecast by Grade, 2017-2032
Table 7: Global Proline Market Value (US$ Mn) Forecast by End Use, 2017-2032
Table 8: Global Proline Market Volume (Tons) Forecast by End Use, 2017-2032
Table 9: Global Proline Market Value (US$ Mn) Forecast by Packaging, 2017-2032
Table 10: Global Proline Market Volume (Tons) Forecast by Packaging, 2017-2032
Table 11: North America Proline Market Value (US$ Mn) Forecast by Country, 2017-2032
Table 12: North America Proline Market Volume (Tons) Forecast by Country, 2017-2032
Table 13: North America Proline Market Value (US$ Mn) Forecast by Product Type, 2017-2032
Table 14: North America Proline Market Volume (Tons) Forecast by Product Type, 2017-2032
Table 15: North America Proline Market Value (US$ Mn) Forecast by Grade, 2017-2032
Table 16: North America Proline Market Volume (Tons) Forecast by Grade, 2017-2032
Table 17: North America Proline Market Value (US$ Mn) Forecast by End Use, 2017-2032
Table 18: North America Proline Market Volume (Tons) Forecast by End Use, 2017-2032
Table 19: North America Proline Market Value (US$ Mn) Forecast by Packaging, 2017-2032
Table 20: North America Proline Market Volume (Tons) Forecast by Packaging, 2017-2032
Table 21: Latin America Proline Market Value (US$ Mn) Forecast by Country, 2017-2032
Table 22: Latin America Proline Market Volume (Tons) Forecast by Country, 2017-2032
Table 23: Latin America Proline Market Value (US$ Mn) Forecast by Product Type, 2017-2032
Table 24: Latin America Proline Market Volume (Tons) Forecast by Product Type, 2017-2032
Table 25: Latin America Proline Market Value (US$ Mn) Forecast by Grade, 2017-2032
Table 26: Latin America Proline Market Volume (Tons) Forecast by Grade, 2017-2032
Table 27: Latin America Proline Market Value (US$ Mn) Forecast by End Use, 2017-2032
Table 28: Latin America Proline Market Volume (Tons) Forecast by End Use, 2017-2032
Table 29: Latin America Proline Market Value (US$ Mn) Forecast by Packaging, 2017-2032
Table 30: Latin America Proline Market Volume (Tons) Forecast by Packaging, 2017-2032
Table 31: Europe Proline Market Value (US$ Mn) Forecast by Country, 2017-2032
Table 32: Europe Proline Market Volume (Tons) Forecast by Country, 2017-2032
Table 33: Europe Proline Market Value (US$ Mn) Forecast by Product Type, 2017-2032
Table 34: Europe Proline Market Volume (Tons) Forecast by Product Type, 2017-2032
Table 35: Europe Proline Market Value (US$ Mn) Forecast by Grade, 2017-2032
Table 36: Europe Proline Market Volume (Tons) Forecast by Grade, 2017-2032
Table 37: Europe Proline Market Value (US$ Mn) Forecast by End Use, 2017-2032
Table 38: Europe Proline Market Volume (Tons) Forecast by End Use, 2017-2032
Table 39: Europe Proline Market Value (US$ Mn) Forecast by Packaging, 2017-2032
Table 40: Europe Proline Market Volume (Tons) Forecast by Packaging, 2017-2032
Table 41: East Asia Proline Market Value (US$ Mn) Forecast by Country, 2017-2032
Table 42: East Asia Proline Market Volume (Tons) Forecast by Country, 2017-2032
Table 43: East Asia Proline Market Value (US$ Mn) Forecast by Product Type, 2017-2032
Table 44: East Asia Proline Market Volume (Tons) Forecast by Product Type, 2017-2032
Table 45: East Asia Proline Market Value (US$ Mn) Forecast by Grade, 2017-2032
Table 46: East Asia Proline Market Volume (Tons) Forecast by Grade, 2017-2032
Table 47: East Asia Proline Market Value (US$ Mn) Forecast by End Use, 2017-2032
Table 48: East Asia Proline Market Volume (Tons) Forecast by End Use, 2017-2032
Table 49: East Asia Proline Market Value (US$ Mn) Forecast by Packaging, 2017-2032
Table 50: East Asia Proline Market Volume (Tons) Forecast by Packaging, 2017-2032
Table 51: South Asia & Pacific Proline Market Value (US$ Mn) Forecast by Country, 2017-2032
Table 52: South Asia & Pacific Proline Market Volume (Tons) Forecast by Country, 2017-2032
Table 53: South Asia & Pacific Proline Market Value (US$ Mn) Forecast by Product Type, 2017-2032
Table 54: South Asia & Pacific Proline Market Volume (Tons) Forecast by Product Type, 2017-2032
Table 55: South Asia & Pacific Proline Market Value (US$ Mn) Forecast by Grade, 2017-2032
Table 56: South Asia & Pacific Proline Market Volume (Tons) Forecast by Grade, 2017-2032
Table 57: South Asia & Pacific Proline Market Value (US$ Mn) Forecast by End Use, 2017-2032
Table 58: South Asia & Pacific Proline Market Volume (Tons) Forecast by End Use, 2017-2032
Table 59: South Asia & Pacific Proline Market Value (US$ Mn) Forecast by Packaging, 2017-2032
Table 60: South Asia & Pacific Proline Market Volume (Tons) Forecast by Packaging, 2017-2032
Table 61: MEA Proline Market Value (US$ Mn) Forecast by Country, 2017-2032
Table 62: MEA Proline Market Volume (Tons) Forecast by Country, 2017-2032
Table 63: MEA Proline Market Value (US$ Mn) Forecast by Product Type, 2017-2032
Table 64: MEA Proline Market Volume (Tons) Forecast by Product Type, 2017-2032
Table 65: MEA Proline Market Value (US$ Mn) Forecast by Grade, 2017-2032
Table 66: MEA Proline Market Volume (Tons) Forecast by Grade, 2017-2032
Table 67: MEA Proline Market Value (US$ Mn) Forecast by End Use, 2017-2032
Table 68: MEA Proline Market Volume (Tons) Forecast by End Use, 2017-2032
Table 69: MEA Proline Market Value (US$ Mn) Forecast by Packaging, 2017-2032
Table 70: MEA Proline Market Volume (Tons) Forecast by Packaging, 2017-2032
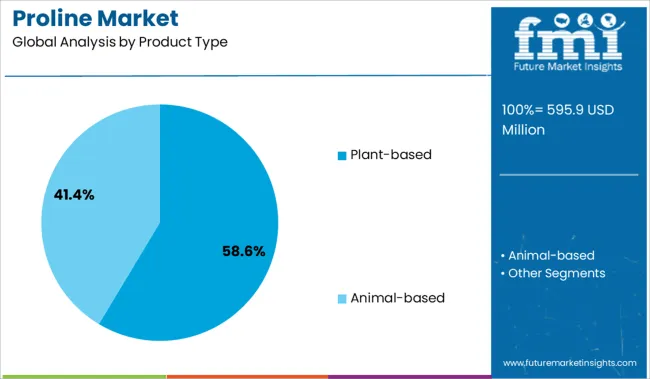
Figure 1: Global Proline Market Value (US$ Mn) by Product Type, 2022-2032
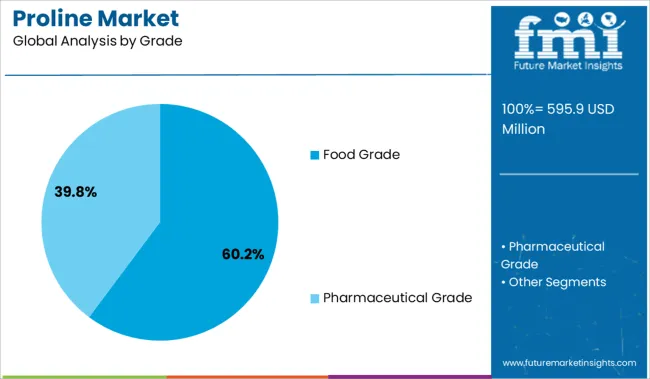
Figure 2: Global Proline Market Value (US$ Mn) by Grade, 2022-2032
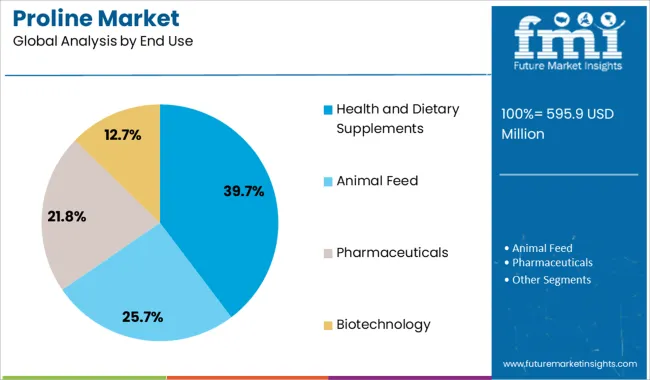
Figure 3: Global Proline Market Value (US$ Mn) by End Use, 2022-2032
Figure 4: Global Proline Market Value (US$ Mn) by Packaging, 2022-2032
Figure 5: Global Proline Market Value (US$ Mn) by Region, 2022-2032
Figure 6: Global Proline Market Value (US$ Mn) Analysis by Region, 2017-2032
Figure 7: Global Proline Market Volume (Tons) Analysis by Region, 2017-2032
Figure 8: Global Proline Market Value Share (%) and BPS Analysis by Region, 2022-2032
Figure 9: Global Proline Market Y-o-Y Growth (%) Projections by Region, 2022-2032
Figure 10: Global Proline Market Value (US$ Mn) Analysis by Product Type, 2017-2032
Figure 11: Global Proline Market Volume (Tons) Analysis by Product Type, 2017-2032
Figure 12: Global Proline Market Value Share (%) and BPS Analysis by Product Type, 2022-2032
Figure 13: Global Proline Market Y-o-Y Growth (%) Projections by Product Type, 2022-2032
Figure 14: Global Proline Market Value (US$ Mn) Analysis by Grade, 2017-2032
Figure 15: Global Proline Market Volume (Tons) Analysis by Grade, 2017-2032
Figure 16: Global Proline Market Value Share (%) and BPS Analysis by Grade, 2022-2032
Figure 17: Global Proline Market Y-o-Y Growth (%) Projections by Grade, 2022-2032
Figure 18: Global Proline Market Value (US$ Mn) Analysis by End Use, 2017-2032
Figure 19: Global Proline Market Volume (Tons) Analysis by End Use, 2017-2032
Figure 20: Global Proline Market Value Share (%) and BPS Analysis by End Use, 2022-2032
Figure 21: Global Proline Market Y-o-Y Growth (%) Projections by End Use, 2022-2032
Figure 22: Global Proline Market Value (US$ Mn) Analysis by Packaging, 2017-2032
Figure 23: Global Proline Market Volume (Tons) Analysis by Packaging, 2017-2032
Figure 24: Global Proline Market Value Share (%) and BPS Analysis by Packaging, 2022-2032
Figure 25: Global Proline Market Y-o-Y Growth (%) Projections by Packaging, 2022-2032
Figure 26: Global Proline Market Attractiveness by Product Type, 2022-2032
Figure 27: Global Proline Market Attractiveness by Grade, 2022-2032
Figure 28: Global Proline Market Attractiveness by End Use, 2022-2032
Figure 29: Global Proline Market Attractiveness by Packaging, 2022-2032
Figure 30: Global Proline Market Attractiveness by Region, 2022-2032
Figure 31: North America Proline Market Value (US$ Mn) by Product Type, 2022-2032
Figure 32: North America Proline Market Value (US$ Mn) by Grade, 2022-2032
Figure 33: North America Proline Market Value (US$ Mn) by End Use, 2022-2032
Figure 34: North America Proline Market Value (US$ Mn) by Packaging, 2022-2032
Figure 35: North America Proline Market Value (US$ Mn) by Country, 2022-2032
Figure 36: North America Proline Market Value (US$ Mn) Analysis by Country, 2017-2032
Figure 37: North America Proline Market Volume (Tons) Analysis by Country, 2017-2032
Figure 38: North America Proline Market Value Share (%) and BPS Analysis by Country, 2022-2032
Figure 39: North America Proline Market Y-o-Y Growth (%) Projections by Country, 2022-2032
Figure 40: North America Proline Market Value (US$ Mn) Analysis by Product Type, 2017-2032
Figure 41: North America Proline Market Volume (Tons) Analysis by Product Type, 2017-2032
Figure 42: North America Proline Market Value Share (%) and BPS Analysis by Product Type, 2022-2032
Figure 43: North America Proline Market Y-o-Y Growth (%) Projections by Product Type, 2022-2032
Figure 44: North America Proline Market Value (US$ Mn) Analysis by Grade, 2017-2032
Figure 45: North America Proline Market Volume (Tons) Analysis by Grade, 2017-2032
Figure 46: North America Proline Market Value Share (%) and BPS Analysis by Grade, 2022-2032
Figure 47: North America Proline Market Y-o-Y Growth (%) Projections by Grade, 2022-2032
Figure 48: North America Proline Market Value (US$ Mn) Analysis by End Use, 2017-2032
Figure 49: North America Proline Market Volume (Tons) Analysis by End Use, 2017-2032
Figure 50: North America Proline Market Value Share (%) and BPS Analysis by End Use, 2022-2032
Figure 51: North America Proline Market Y-o-Y Growth (%) Projections by End Use, 2022-2032
Figure 52: North America Proline Market Value (US$ Mn) Analysis by Packaging, 2017-2032
Figure 53: North America Proline Market Volume (Tons) Analysis by Packaging, 2017-2032
Figure 54: North America Proline Market Value Share (%) and BPS Analysis by Packaging, 2022-2032
Figure 55: North America Proline Market Y-o-Y Growth (%) Projections by Packaging, 2022-2032
Figure 56: North America Proline Market Attractiveness by Product Type, 2022-2032
Figure 57: North America Proline Market Attractiveness by Grade, 2022-2032
Figure 58: North America Proline Market Attractiveness by End Use, 2022-2032
Figure 59: North America Proline Market Attractiveness by Packaging, 2022-2032
Figure 60: North America Proline Market Attractiveness by Country, 2022-2032
Figure 61: Latin America Proline Market Value (US$ Mn) by Product Type, 2022-2032
Figure 62: Latin America Proline Market Value (US$ Mn) by Grade, 2022-2032
Figure 63: Latin America Proline Market Value (US$ Mn) by End Use, 2022-2032
Figure 64: Latin America Proline Market Value (US$ Mn) by Packaging, 2022-2032
Figure 65: Latin America Proline Market Value (US$ Mn) by Country, 2022-2032
Figure 66: Latin America Proline Market Value (US$ Mn) Analysis by Country, 2017-2032
Figure 67: Latin America Proline Market Volume (Tons) Analysis by Country, 2017-2032
Figure 68: Latin America Proline Market Value Share (%) and BPS Analysis by Country, 2022-2032
Figure 69: Latin America Proline Market Y-o-Y Growth (%) Projections by Country, 2022-2032
Figure 70: Latin America Proline Market Value (US$ Mn) Analysis by Product Type, 2017-2032
Figure 71: Latin America Proline Market Volume (Tons) Analysis by Product Type, 2017-2032
Figure 72: Latin America Proline Market Value Share (%) and BPS Analysis by Product Type, 2022-2032
Figure 73: Latin America Proline Market Y-o-Y Growth (%) Projections by Product Type, 2022-2032
Figure 74: Latin America Proline Market Value (US$ Mn) Analysis by Grade, 2017-2032
Figure 75: Latin America Proline Market Volume (Tons) Analysis by Grade, 2017-2032
Figure 76: Latin America Proline Market Value Share (%) and BPS Analysis by Grade, 2022-2032
Figure 77: Latin America Proline Market Y-o-Y Growth (%) Projections by Grade, 2022-2032
Figure 78: Latin America Proline Market Value (US$ Mn) Analysis by End Use, 2017-2032
Figure 79: Latin America Proline Market Volume (Tons) Analysis by End Use, 2017-2032
Figure 80: Latin America Proline Market Value Share (%) and BPS Analysis by End Use, 2022-2032
Figure 81: Latin America Proline Market Y-o-Y Growth (%) Projections by End Use, 2022-2032
Figure 82: Latin America Proline Market Value (US$ Mn) Analysis by Packaging, 2017-2032
Figure 83: Latin America Proline Market Volume (Tons) Analysis by Packaging, 2017-2032
Figure 84: Latin America Proline Market Value Share (%) and BPS Analysis by Packaging, 2022-2032
Figure 85: Latin America Proline Market Y-o-Y Growth (%) Projections by Packaging, 2022-2032
Figure 86: Latin America Proline Market Attractiveness by Product Type, 2022-2032
Figure 87: Latin America Proline Market Attractiveness by Grade, 2022-2032
Figure 88: Latin America Proline Market Attractiveness by End Use, 2022-2032
Figure 89: Latin America Proline Market Attractiveness by Packaging, 2022-2032
Figure 90: Latin America Proline Market Attractiveness by Country, 2022-2032
Figure 91: Europe Proline Market Value (US$ Mn) by Product Type, 2022-2032
Figure 92: Europe Proline Market Value (US$ Mn) by Grade, 2022-2032
Figure 93: Europe Proline Market Value (US$ Mn) by End Use, 2022-2032
Figure 94: Europe Proline Market Value (US$ Mn) by Packaging, 2022-2032
Figure 95: Europe Proline Market Value (US$ Mn) by Country, 2022-2032
Figure 96: Europe Proline Market Value (US$ Mn) Analysis by Country, 2017-2032
Figure 97: Europe Proline Market Volume (Tons) Analysis by Country, 2017-2032
Figure 98: Europe Proline Market Value Share (%) and BPS Analysis by Country, 2022-2032
Figure 99: Europe Proline Market Y-o-Y Growth (%) Projections by Country, 2022-2032
Figure 100: Europe Proline Market Value (US$ Mn) Analysis by Product Type, 2017-2032
Figure 101: Europe Proline Market Volume (Tons) Analysis by Product Type, 2017-2032
Figure 102: Europe Proline Market Value Share (%) and BPS Analysis by Product Type, 2022-2032
Figure 103: Europe Proline Market Y-o-Y Growth (%) Projections by Product Type, 2022-2032
Figure 104: Europe Proline Market Value (US$ Mn) Analysis by Grade, 2017-2032
Figure 105: Europe Proline Market Volume (Tons) Analysis by Grade, 2017-2032
Figure 106: Europe Proline Market Value Share (%) and BPS Analysis by Grade, 2022-2032
Figure 107: Europe Proline Market Y-o-Y Growth (%) Projections by Grade, 2022-2032
Figure 108: Europe Proline Market Value (US$ Mn) Analysis by End Use, 2017-2032
Figure 109: Europe Proline Market Volume (Tons) Analysis by End Use, 2017-2032
Figure 110: Europe Proline Market Value Share (%) and BPS Analysis by End Use, 2022-2032
Figure 111: Europe Proline Market Y-o-Y Growth (%) Projections by End Use, 2022-2032
Figure 112: Europe Proline Market Value (US$ Mn) Analysis by Packaging, 2017-2032
Figure 113: Europe Proline Market Volume (Tons) Analysis by Packaging, 2017-2032
Figure 114: Europe Proline Market Value Share (%) and BPS Analysis by Packaging, 2022-2032
Figure 115: Europe Proline Market Y-o-Y Growth (%) Projections by Packaging, 2022-2032
Figure 116: Europe Proline Market Attractiveness by Product Type, 2022-2032
Figure 117: Europe Proline Market Attractiveness by Grade, 2022-2032
Figure 118: Europe Proline Market Attractiveness by End Use, 2022-2032
Figure 119: Europe Proline Market Attractiveness by Packaging, 2022-2032
Figure 120: Europe Proline Market Attractiveness by Country, 2022-2032
Figure 121: East Asia Proline Market Value (US$ Mn) by Product Type, 2022-2032
Figure 122: East Asia Proline Market Value (US$ Mn) by Grade, 2022-2032
Figure 123: East Asia Proline Market Value (US$ Mn) by End Use, 2022-2032
Figure 124: East Asia Proline Market Value (US$ Mn) by Packaging, 2022-2032
Figure 125: East Asia Proline Market Value (US$ Mn) by Country, 2022-2032
Figure 126: East Asia Proline Market Value (US$ Mn) Analysis by Country, 2017-2032
Figure 127: East Asia Proline Market Volume (Tons) Analysis by Country, 2017-2032
Figure 128: East Asia Proline Market Value Share (%) and BPS Analysis by Country, 2022-2032
Figure 129: East Asia Proline Market Y-o-Y Growth (%) Projections by Country, 2022-2032
Figure 130: East Asia Proline Market Value (US$ Mn) Analysis by Product Type, 2017-2032
Figure 131: East Asia Proline Market Volume (Tons) Analysis by Product Type, 2017-2032
Figure 132: East Asia Proline Market Value Share (%) and BPS Analysis by Product Type, 2022-2032
Figure 133: East Asia Proline Market Y-o-Y Growth (%) Projections by Product Type, 2022-2032
Figure 134: East Asia Proline Market Value (US$ Mn) Analysis by Grade, 2017-2032
Figure 135: East Asia Proline Market Volume (Tons) Analysis by Grade, 2017-2032
Figure 136: East Asia Proline Market Value Share (%) and BPS Analysis by Grade, 2022-2032
Figure 137: East Asia Proline Market Y-o-Y Growth (%) Projections by Grade, 2022-2032
Figure 138: East Asia Proline Market Value (US$ Mn) Analysis by End Use, 2017-2032
Figure 139: East Asia Proline Market Volume (Tons) Analysis by End Use, 2017-2032
Figure 140: East Asia Proline Market Value Share (%) and BPS Analysis by End Use, 2022-2032
Figure 141: East Asia Proline Market Y-o-Y Growth (%) Projections by End Use, 2022-2032
Figure 142: East Asia Proline Market Value (US$ Mn) Analysis by Packaging, 2017-2032
Figure 143: East Asia Proline Market Volume (Tons) Analysis by Packaging, 2017-2032
Figure 144: East Asia Proline Market Value Share (%) and BPS Analysis by Packaging, 2022-2032
Figure 145: East Asia Proline Market Y-o-Y Growth (%) Projections by Packaging, 2022-2032
Figure 146: East Asia Proline Market Attractiveness by Product Type, 2022-2032
Figure 147: East Asia Proline Market Attractiveness by Grade, 2022-2032
Figure 148: East Asia Proline Market Attractiveness by End Use, 2022-2032
Figure 149: East Asia Proline Market Attractiveness by Packaging, 2022-2032
Figure 150: East Asia Proline Market Attractiveness by Country, 2022-2032
Figure 151: South Asia & Pacific Proline Market Value (US$ Mn) by Product Type, 2022-2032
Figure 152: South Asia & Pacific Proline Market Value (US$ Mn) by Grade, 2022-2032
Figure 153: South Asia & Pacific Proline Market Value (US$ Mn) by End Use, 2022-2032
Figure 154: South Asia & Pacific Proline Market Value (US$ Mn) by Packaging, 2022-2032
Figure 155: South Asia & Pacific Proline Market Value (US$ Mn) by Country, 2022-2032
Figure 156: South Asia & Pacific Proline Market Value (US$ Mn) Analysis by Country, 2017-2032
Figure 157: South Asia & Pacific Proline Market Volume (Tons) Analysis by Country, 2017-2032
Figure 158: South Asia & Pacific Proline Market Value Share (%) and BPS Analysis by Country, 2022-2032
Figure 159: South Asia & Pacific Proline Market Y-o-Y Growth (%) Projections by Country, 2022-2032
Figure 160: South Asia & Pacific Proline Market Value (US$ Mn) Analysis by Product Type, 2017-2032
Figure 161: South Asia & Pacific Proline Market Volume (Tons) Analysis by Product Type, 2017-2032
Figure 162: South Asia & Pacific Proline Market Value Share (%) and BPS Analysis by Product Type, 2022-2032
Figure 163: South Asia & Pacific Proline Market Y-o-Y Growth (%) Projections by Product Type, 2022-2032
Figure 164: South Asia & Pacific Proline Market Value (US$ Mn) Analysis by Grade, 2017-2032
Figure 165: South Asia & Pacific Proline Market Volume (Tons) Analysis by Grade, 2017-2032
Figure 166: South Asia & Pacific Proline Market Value Share (%) and BPS Analysis by Grade, 2022-2032
Figure 167: South Asia & Pacific Proline Market Y-o-Y Growth (%) Projections by Grade, 2022-2032
Figure 168: South Asia & Pacific Proline Market Value (US$ Mn) Analysis by End Use, 2017-2032
Figure 169: South Asia & Pacific Proline Market Volume (Tons) Analysis by End Use, 2017-2032
Figure 170: South Asia & Pacific Proline Market Value Share (%) and BPS Analysis by End Use, 2022-2032
Figure 171: South Asia & Pacific Proline Market Y-o-Y Growth (%) Projections by End Use, 2022-2032
Figure 172: South Asia & Pacific Proline Market Value (US$ Mn) Analysis by Packaging, 2017-2032
Figure 173: South Asia & Pacific Proline Market Volume (Tons) Analysis by Packaging, 2017-2032
Figure 174: South Asia & Pacific Proline Market Value Share (%) and BPS Analysis by Packaging, 2022-2032
Figure 175: South Asia & Pacific Proline Market Y-o-Y Growth (%) Projections by Packaging, 2022-2032
Figure 176: South Asia & Pacific Proline Market Attractiveness by Product Type, 2022-2032
Figure 177: South Asia & Pacific Proline Market Attractiveness by Grade, 2022-2032
Figure 178: South Asia & Pacific Proline Market Attractiveness by End Use, 2022-2032
Figure 179: South Asia & Pacific Proline Market Attractiveness by Packaging, 2022-2032
Figure 180: South Asia & Pacific Proline Market Attractiveness by Country, 2022-2032
Figure 181: MEA Proline Market Value (US$ Mn) by Product Type, 2022-2032
Figure 182: MEA Proline Market Value (US$ Mn) by Grade, 2022-2032
Figure 183: MEA Proline Market Value (US$ Mn) by End Use, 2022-2032
Figure 184: MEA Proline Market Value (US$ Mn) by Packaging, 2022-2032
Figure 185: MEA Proline Market Value (US$ Mn) by Country, 2022-2032
Figure 186: MEA Proline Market Value (US$ Mn) Analysis by Country, 2017-2032
Figure 187: MEA Proline Market Volume (Tons) Analysis by Country, 2017-2032
Figure 188: MEA Proline Market Value Share (%) and BPS Analysis by Country, 2022-2032
Figure 189: MEA Proline Market Y-o-Y Growth (%) Projections by Country, 2022-2032
Figure 190: MEA Proline Market Value (US$ Mn) Analysis by Product Type, 2017-2032
Figure 191: MEA Proline Market Volume (Tons) Analysis by Product Type, 2017-2032
Figure 192: MEA Proline Market Value Share (%) and BPS Analysis by Product Type, 2022-2032
Figure 193: MEA Proline Market Y-o-Y Growth (%) Projections by Product Type, 2022-2032
Figure 194: MEA Proline Market Value (US$ Mn) Analysis by Grade, 2017-2032
Figure 195: MEA Proline Market Volume (Tons) Analysis by Grade, 2017-2032
Figure 196: MEA Proline Market Value Share (%) and BPS Analysis by Grade, 2022-2032
Figure 197: MEA Proline Market Y-o-Y Growth (%) Projections by Grade, 2022-2032
Figure 198: MEA Proline Market Value (US$ Mn) Analysis by End Use, 2017-2032
Figure 199: MEA Proline Market Volume (Tons) Analysis by End Use, 2017-2032
Figure 200: MEA Proline Market Value Share (%) and BPS Analysis by End Use, 2022-2032
Figure 201: MEA Proline Market Y-o-Y Growth (%) Projections by End Use, 2022-2032
Figure 202: MEA Proline Market Value (US$ Mn) Analysis by Packaging, 2017-2032
Figure 203: MEA Proline Market Volume (Tons) Analysis by Packaging, 2017-2032
Figure 204: MEA Proline Market Value Share (%) and BPS Analysis by Packaging, 2022-2032
Figure 205: MEA Proline Market Y-o-Y Growth (%) Projections by Packaging, 2022-2032
Figure 206: MEA Proline Market Attractiveness by Product Type, 2022-2032
Figure 207: MEA Proline Market Attractiveness by Grade, 2022-2032
Figure 208: MEA Proline Market Attractiveness by End Use, 2022-2032
Figure 209: MEA Proline Market Attractiveness by Packaging, 2022-2032
Figure 210: MEA Proline Market Attractiveness by Country, 2022-2032
The global proline market is set to exceed USD 559.30 Million in 2032.
The USA is projected to lead the proline market in the forecast period.
PepTech Corporation, Anaspec, Inc, Iris Biotech GmbH, and others are some of the renowned companies in the proline market.
Explore Similar Insights
Thank you!
You will receive an email from our Business Development Manager. Please be sure to check your SPAM/JUNK folder too.