Pumpjacks Market Size and Share Forecast Outlook 2025 to 2035

The pumpjacks market is estimated to be valued at USD 3.8 billion in 2025 and is projected to reach USD 6.6 billion by 2035, registering a compound annual growth rate (CAGR) of 5.7% over the forecast period.

Analysis of the cost structure indicates that raw materials, primarily steel and high-strength alloys, constitute a significant portion of the production cost, alongside machining, fabrication, and assembly operations. Labor and energy expenses for manufacturing and site installation further influence the total cost, while ongoing maintenance and servicing contribute to the operational expenditure across the value chain. The value chain begins with raw material procurement, followed by component fabrication, mechanical assembly, and quality assurance testing. Equipment deployment at oilfields involves transportation, site preparation, installation, and commissioning, often accompanied by integration with monitoring and control systems.

Post-installation, the value chain extends to operational management, preventive maintenance, and eventual retrofitting or replacement, which collectively support revenue generation beyond initial sales. Between 2025 and 2035, the market shows incremental growth from USD 3.8 billion to USD 6.6 billion, reflecting gradual scaling across mature and emerging oil-producing regions. Value addition is increasingly influenced by technological improvements such as automated monitoring, enhanced energy efficiency, and modular designs, which optimize both upfront and operational costs. The market exhibits a cost-intensive but systematically structured value chain, where raw materials, assembly efficiency, and operational management drive profitability and long-term market resilience.
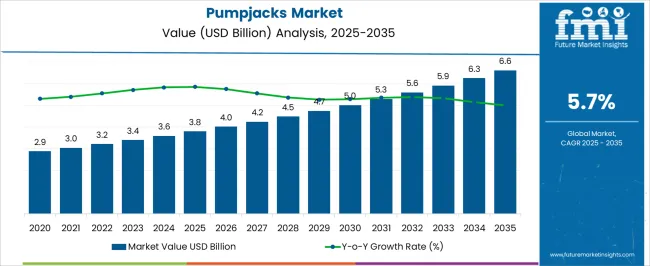
Quick Stats for Pumpjacks Market

  • Pumpjacks Market Value (2025): USD 3.8 billion
  • Pumpjacks Market Forecast Value (2035): USD 6.6 billion
  • Pumpjacks Market Forecast CAGR: 5.7%
  • Leading Segment in Pumpjacks Market in 2025: Conventional Pump Jacks (48.6%)
  • Key Growth Regions in Pumpjacks Market: North America, Asia-Pacific, Europe
  • Key Players in Pumpjacks Market: Baker Hughes Company, Borets International Limited, Canadian Advanced ESP Inc., Cavins Oil Well Tools, Dover Corporation, FMC Technologies Inc., Gardner Denver Holdings Inc., General Electric Company, Halliburton Company, Lufkin Industries LLC, National Oilwell Varco, Inc., Occidental Petroleum Corporation, Schlumberger Limited, Tenaris S.A., Weatherford International

Pumpjacks Market Market Value Analysis

Pumpjacks Market Key Takeaways

Metric Value
Pumpjacks Market Estimated Value in (2025 E) USD 3.8 billion
Pumpjacks Market Forecast Value in (2035 F) USD 6.6 billion
Forecast CAGR (2025 to 2035) 5.7%

The pumpjacks market represents a specialized segment within the global oilfield and petroleum extraction industry, emphasizing mechanical efficiency, durability, and continuous crude oil production. Within the broader oilfield equipment sector, it accounts for about 5.7%, driven by demand from onshore oilfields and aging wells requiring artificial lift solutions. In the oil extraction and production equipment segment, it secures 6.2%, reflecting reliance on mechanical pumping systems for consistent crude recovery. Across the energy infrastructure and petroleum services market, the share is 4.3%, supporting both small and large-scale production operations. Within the well intervention and enhanced oil recovery category, it represents 3.9%, highlighting use in secondary and tertiary extraction techniques. In the industrial energy solutions sector, it contributes about 3.5%, emphasizing adoption for reliable long-term production and low-maintenance operational requirements.

Recent developments in this market have focused on automation, energy efficiency, and remote monitoring integration. Innovations include variable speed drives, digital sensors for real-time performance tracking, and IoT-enabled predictive maintenance systems to reduce downtime. Key players are collaborating with oilfield service companies and energy operators to optimize pumpjack performance and extend operational life. Adoption of modular designs and low-energy consumption motors is gaining traction to improve efficiency and reduce operating costs. The hybrid systems combining solar or electric assist with mechanical pumping are being deployed to lower environmental impact and improve sustainability. These trends demonstrate how efficiency, digitalization, and innovation are shaping the pumpjacks market.

Why is the Pumpjacks Market Growing?

The pumpjacks market is experiencing stable growth driven by consistent global demand for crude oil extraction and the ongoing need for efficient artificial lift systems in mature oilfields. Aging wells with declining natural reservoir pressure are increasingly relying on pumpjack installations to maintain production efficiency.

Technological enhancements in motor efficiency, remote monitoring, and structural durability have extended operational lifespans while reducing maintenance costs. Additionally, demand in both onshore and marginal oilfields has remained resilient due to pumpjacks’ proven reliability and adaptability across diverse geographies and operational conditions.

While renewable energy adoption is rising, the long-term reliance on oil in industrial processes and transportation is sustaining market relevance. The outlook remains positive as operators continue to invest in equipment upgrades, automation integration, and region-specific customization to optimize extraction rates and operational safety.

Segmental Analysis

The pumpjacks market is segmented by type, operations, capacity, end-use, distribution channel, and geographic regions. By type, pumpjacks market is divided into conventional pump jacks, hydraulic pump jacks, electric pump jacks, and others (Gas Lift Pump Jacks, etc.). In terms of operations, pumpjacks market is classified into manual, semi-automatic, and automated. Based on capacity, pumpjacks market is segmented into up to 100 bpd, 100-500 bpd, 500-1000 bpd, and above 1000 bpd. By end-use, pumpjacks market is segmented into oil and gas industry, mining industry, agriculture, and others (construction, geothermal energy production, etc.). By distribution channel, pumpjacks market is segmented into direct and indirect. Regionally, the pumpjacks industry is classified into North America, Latin America, Western Europe, Eastern Europe, Balkan & Baltic Countries, Russia & Belarus, Central Asia, East Asia, South Asia & Pacific, and the Middle East & Africa.
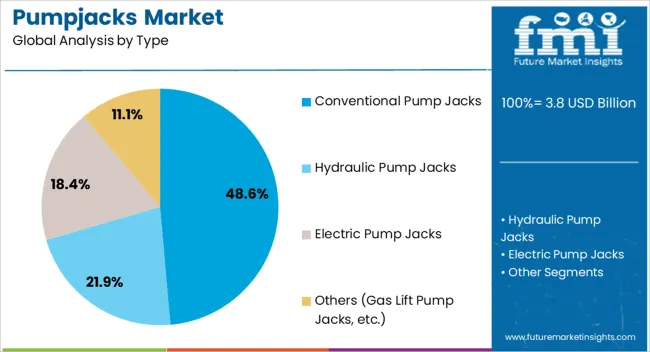
Insights into the Conventional Pump Jacks Type Segment

Pumpjacks Market Analysis By Type

The conventional pump jacks type segment is expected to hold 48.60% of the total market revenue by 2025, making it the leading type category. This dominance is attributed to its proven mechanical reliability, ease of operation, and adaptability in varied geological conditions.

Conventional units have a long-standing track record of efficient oil extraction from both shallow and deep wells, making them a preferred choice for operators seeking cost-effective artificial lift solutions. Their simpler design allows for easier maintenance, lower downtime, and faster deployment in the field.

The segment’s sustained use in mature and marginal fields has reinforced its strong market position.
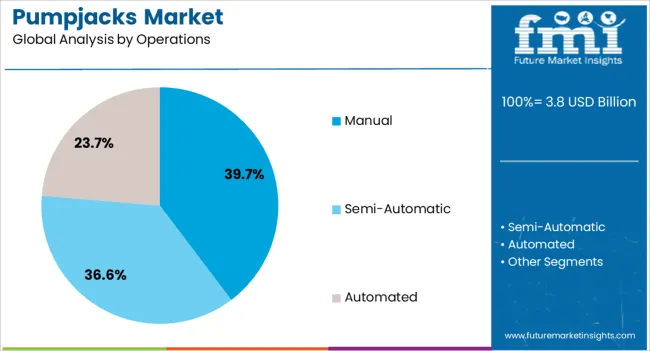
Insights into the Manual Operations Segment

Pumpjacks Market Analysis By Operations

The manual operations segment is projected to account for 39.70% of total market revenue by 2025, positioning it as the top operational mode. Its prevalence is linked to lower capital investment requirements and operational flexibility in remote or small-scale fields where automated systems may not be economically viable.

Manual pumpjack systems allow operators to maintain production with minimal infrastructure investment while retaining control over operation timing and maintenance schedules.

The segment’s cost advantages and suitability for low-production wells have sustained its market leadership.
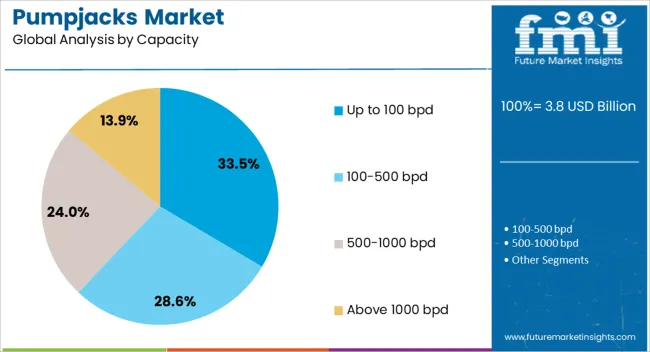
Insights into the Up to 100 bpd Capacity Segment

Pumpjacks Market Analysis By Capacity

The up to 100 bpd capacity segment is anticipated to represent 33.50% of market revenue by 2025, making it the leading capacity category. This capacity range is well-suited for low to moderate output wells, particularly in mature fields where production rates have declined.

Operators in both developed and emerging oil markets have adopted this capacity range for its balance between output efficiency and operational cost control.

Its compatibility with both manual and automated systems further broadens its applicability, ensuring continued dominance in the pumpjacks market.

What are the Drivers, Restraints, and Key Trends of the Pumpjacks Market?

The market has grown significantly due to the rising demand for crude oil extraction and enhanced recovery techniques in onshore oilfields. Pumpjacks, also known as nodding donkeys or beam pumps, are widely used to lift crude oil from wells with insufficient reservoir pressure. Growth has been influenced by expanding oil exploration activities, aging wells requiring artificial lift, and advancements in pumpjack efficiency and automation. Technological innovations, including variable speed drives, remote monitoring, and corrosion-resistant materials, have enhanced operational reliability and energy efficiency.

Onshore Oil Extraction Drives Market Adoption

Pumpjacks are extensively deployed in onshore oilfields where natural reservoir pressure is insufficient to push crude oil to the surface. These mechanical devices enable continuous extraction, maintaining production from aging or low-pressure wells. Operators prefer pumpjacks for their reliability, ease of maintenance, and ability to operate under harsh environmental conditions. In regions with mature oilfields, retrofitting existing wells with modern pumpjack systems allows extended well life and optimized production. The adoption of automated and digitally controlled pumpjacks improves monitoring, reduces downtime, and ensures consistent output. Increasing oil demand and the necessity to maintain production levels from legacy wells continue to drive the global adoption of pumpjack technologies.

Technological Advancements Enhance Efficiency

Recent technological advancements have improved the efficiency, reliability, and monitoring capabilities of pumpjacks. Variable speed drives, hydraulic systems, and automated controllers allow better energy utilization and precise control over pumping operations. Remote monitoring and IoT integration enable real-time diagnostics, predictive maintenance, and operational optimization. Corrosion-resistant coatings, wear-resistant components, and modular designs extend equipment life in challenging conditions such as high salinity, extreme temperatures, or abrasive fluids. These innovations reduce maintenance costs, enhance performance, and improve safety for operators. By increasing operational efficiency and lowering total cost of ownership, modern pumpjacks have become more attractive for oilfield operators globally.

Oilfield Services and Energy Infrastructure Expansion Boost Demand

The market benefits from the expansion of oilfield services and energy infrastructure development. New onshore drilling projects, rehabilitation of aging wells, and secondary recovery techniques all require reliable artificial lift solutions. Service providers and oilfield contractors are increasingly investing in modern pumpjack systems to improve production efficiency, minimize operational downtime, and comply with safety and environmental standards. Additionally, investments in energy infrastructure, particularly in emerging economies, create demand for portable, modular, and easily maintainable pumpjacks. This trend ensures that pumpjacks remain a critical component of upstream oilfield operations, supporting both traditional crude production and enhanced recovery initiatives.

Challenges from Environmental Regulations and Operational Costs

Despite growth, the pumpjacks market faces challenges related to environmental regulations, energy consumption, and maintenance costs. Strict emission and noise standards in several countries require manufacturers to develop compliant and efficient pumping solutions. Harsh operating environments can increase wear and tear, necessitating frequent inspections, lubrication, and component replacement. Fluctuating oil prices and operational expenditure pressures can impact capital investment in new pumpjack installations. Market players are addressing these challenges by adopting energy-efficient drives, corrosion-resistant materials, and predictive maintenance technologies. While operational hurdles exist, the ongoing need for onshore oil extraction ensures steady demand for pumpjacks worldwide.
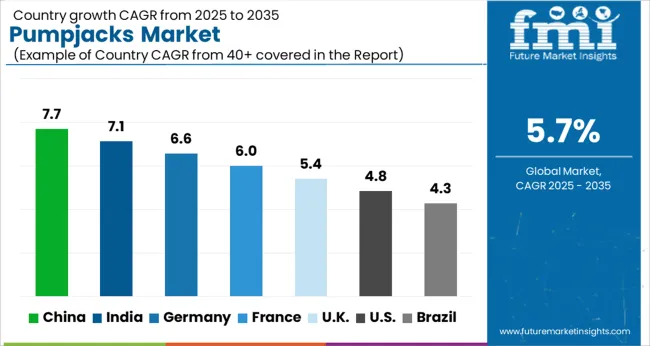
Analysis of Pumpjacks Market By Key Countries

Pumpjacks Market Cagr Analysis By Country

Country CAGR
China 7.7%
India 7.1%
Germany 6.6%
France 6.0%
UK 5.4%
USA 4.8%
Brazil 4.3%

The market is projected to expand at a CAGR of 5.7 percent from 2025 to 2035, driven by rising oil extraction activities and modernization of energy infrastructure. Germany achieved 6.6%, supported by technological upgrades in oil recovery methods. India recorded 7.1%, reflecting increasing investments in onshore oilfields. China led with 7.7%, driven by growing domestic energy demand and enhanced oil production strategies. The United Kingdom reached 5.4%, backed by offshore oil extraction and efficiency improvements. The United States accounted for 4.8%, with stable demand in mature oilfields and maintenance operations. These countries collectively illustrate the leading hubs producing, deploying, and innovating pumpjack technologies worldwide. This report includes insights on 40+ countries; the top markets are shown here for reference.

Expansion Outlook on Pumpjacks Market in China

China is projected to grow at a CAGR of 7.7%, driven by increasing oil exploration, upstream energy investments, and demand for onshore crude extraction equipment. Adoption has been reinforced by domestic manufacturers offering high efficiency, automated, and durable pumpjacks suitable for diverse oilfield conditions. Technological integration, including remote monitoring and predictive maintenance, enhances operational reliability. Rising investments in energy infrastructure and support for domestic oil production projects further stimulate market growth.

Market Dynamics of Pumpjacks in India

India is expected to grow at a CAGR of 7.1%, supported by rising domestic oil exploration and increased upstream investment. Adoption has been reinforced by demand for robust, low maintenance, and cost efficient pumpjacks for onshore oilfields. Domestic manufacturers and international collaborators supply both conventional and hydraulic pump systems. Government initiatives to enhance energy self-sufficiency and investment in new oilfield development support sustained growth.
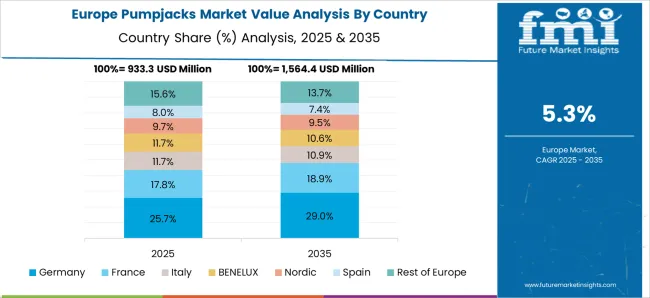
Growth Analysis of Pumpjacks Market in Germany

Pumpjacks Market Europe Country Market Share Analysis, 2025 & 2035

Germany is projected to grow at a CAGR of 6.6%, driven by modest onshore oil exploration, small scale extraction projects, and technological upgrades in existing fields. Adoption has been reinforced by high reliability, precision, and energy efficient pumpjack solutions for smaller production sites. Manufacturers focus on advanced materials, automation, and compliance with European environmental standards. Deployment in industrial and energy sectors for niche extraction supports market continuity.

Future Outlook on Pumpjacks Market in the United Kingdom

The United Kingdom is expected to grow at a CAGR of 5.4%, supported by adoption in onshore oilfields, energy projects, and marginal field extraction. Imports dominate high capacity and automated pumpjack solutions, while domestic manufacturers focus on low maintenance and smaller scale units. Upgrades of aging infrastructure and technological modernization drive incremental demand. The pumpjacks market in the U.K. is experiencing growth due to the continued focus on maximizing output from mature oilfields and ensuring energy security amid global supply uncertainties. Many of the country’s onshore and offshore wells are in late production stages, requiring reliable artificial lift systems such as pumpjacks to sustain crude oil extraction.
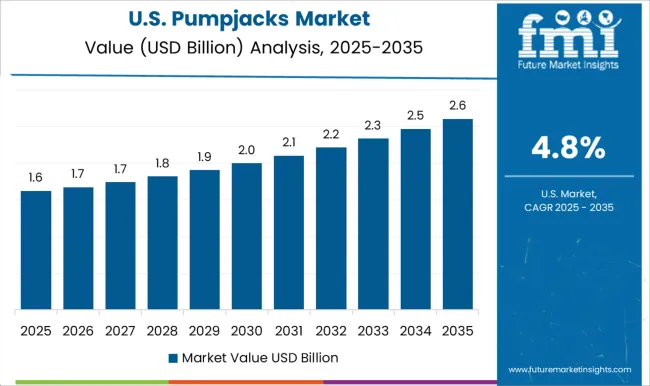
Market Trends of Pumpjacks in the United States

Pumpjacks Market Country Value Analysis

The United States is projected to grow at a CAGR of 4.8%, driven by adoption in shale and conventional onshore oilfields, with a focus on hydraulic, automated, and energy efficient pumpjacks. Domestic manufacturers emphasize durability, remote monitoring, and predictive maintenance. Sustained demand is supported by oilfield modernization, enhanced recovery techniques, and expanding upstream production projects. The pumpjacks market in the U.S. is growing due to the country’s large number of mature oilfields, particularly in regions like Texas, Oklahoma, and North Dakota, where artificial lift systems are essential to maintain production levels. With the shale boom and unconventional drilling continuing to play a major role, pumpjacks remain a cost-effective solution for enhancing crude oil recovery.
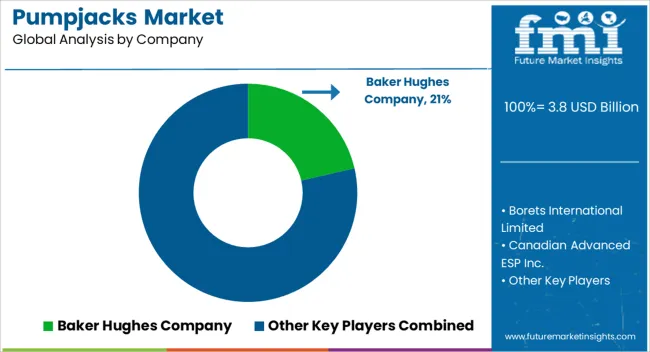
Competitive Landscape of Pumpjacks Market

Pumpjacks Market Analysis By Company

The market is led by a blend of global oilfield service providers, equipment manufacturers, and energy companies, offering solutions for crude oil extraction and artificial lift applications. Baker Hughes Company, Halliburton, and Schlumberger focus on advanced pumpjack systems integrated with digital monitoring and automation technologies to enhance operational efficiency and reduce downtime. Lufkin Industries LLC, Dover Corporation, and FMC Technologies provide robust mechanical designs and modular units suitable for both onshore and offshore operations, emphasizing durability and ease of maintenance.

Canadian Advanced ESP Inc., Borets International Limited, and Cavins Oil Well Tools deliver specialized solutions including high-capacity, customizable pumpjacks designed for varying well conditions and production requirements. Gardner Denver Holdings Inc., General Electric Company, and National Oilwell Varco, Inc. offer energy-efficient pumping solutions and aftermarket support, ensuring reliable performance and prolonged equipment lifespan.

Occidental Petroleum Corporation and Tenaris S.A. contribute through vertically integrated supply, combining pumpjack manufacturing with oilfield services. Competitive dynamics are shaped by technological innovation, energy efficiency, regulatory compliance, and service capabilities. Companies invest in predictive maintenance, IoT-enabled monitoring, and enhanced materials to withstand extreme environments. Market growth is driven by increasing oil production activities, aging well infrastructure, and the need for reliable artificial lift systems, prompting players to focus on performance optimization, cost efficiency, and global service networks.

Key Players in the Pumpjacks Market

  • Baker Hughes Company
  • Borets International Limited
  • Canadian Advanced ESP Inc.
  • Cavins Oil Well Tools
  • Dover Corporation
  • FMC Technologies Inc.
  • Gardner Denver Holdings Inc.
  • General Electric Company
  • Halliburton Company
  • Lufkin Industries LLC
  • National Oilwell Varco, Inc.
  • Occidental Petroleum Corporation
  • Schlumberger Limited
  • Tenaris S.A.
  • Weatherford International

Scope of the Report

Item Value
Quantitative Units USD 3.8 billion
Type Conventional Pump Jacks, Hydraulic Pump Jacks, Electric Pump Jacks, and Others (Gas Lift Pump Jacks, etc.)
Operations Manual, Semi-Automatic, and Automated
Capacity Up to 100 bpd, 100-500 bpd, 500-1000 bpd, and Above 1000 bpd
End-use Oil and Gas Industry, Mining Industry, Agriculture, and Others (Construction, Geothermal Energy Production, etc.)
Distribution Channel Direct and Indirect
Regions Covered North America, Europe, Asia-Pacific, Latin America, Middle East & Africa
Country Covered United States, Canada, Germany, France, United Kingdom, China, Japan, India, Brazil, South Africa
Key Companies Profiled Baker Hughes Company, Borets International Limited, Canadian Advanced ESP Inc., Cavins Oil Well Tools, Dover Corporation, FMC Technologies Inc., Gardner Denver Holdings Inc., General Electric Company, Halliburton Company, Lufkin Industries LLC, National Oilwell Varco, Inc., Occidental Petroleum Corporation, Schlumberger Limited, Tenaris S.A., and Weatherford International
Additional Attributes Dollar sales by pumpjack type and application, demand dynamics across onshore oil extraction, enhanced oil recovery, and energy infrastructure sectors, regional trends in upstream oilfield adoption, innovation in efficiency, automation, and remote monitoring, environmental impact of energy consumption and emissions, and emerging use cases in marginal field development, unconventional oil extraction, and digital oilfield integration.

Pumpjacks Market by Segments

Type:

  • Conventional Pump Jacks
  • Hydraulic Pump Jacks
  • Electric Pump Jacks
  • Others (Gas Lift Pump Jacks, etc.)

Operations:

  • Manual
  • Semi-Automatic
  • Automated

Capacity:

  • Up to 100 bpd
  • 100-500 bpd
  • 500-1000 bpd
  • Above 1000 bpd

End-use:

  • Oil and Gas Industry
  • Mining Industry
  • Agriculture
  • Others (Construction, Geothermal Energy Production, etc.)

Distribution Channel:

  • Direct
  • Indirect

Region:

  • North America
    • USA
    • Canada
    • Mexico
  • Latin America
    • Brazil
    • Chile
    • Rest of Latin America
  • Western Europe
    • Germany
    • UK
    • Italy
    • Spain
    • France
    • Nordic
    • BENELUX
    • Rest of Western Europe
  • Eastern Europe
    • Russia
    • Poland
    • Hungary
    • Balkan & Baltic
    • Rest of Eastern Europe
  • East Asia
    • China
    • Japan
    • South Korea
  • South Asia and Pacific
    • India
    • ASEAN
    • Australia & New Zealand
    • Rest of South Asia and Pacific
  • Middle East & Africa
    • Kingdom of Saudi Arabia
    • Other GCC Countries
    • Turkiye
    • South Africa
    • Other African Union
    • Rest of Middle East & Africa

Table of Content

  1. Executive Summary
    • Global Market Outlook
    • Demand-side Trends
    • Supply-side Trends
    • Technology Roadmap Analysis
    • Analysis and Recommendations
  2. Market Overview
    • Market Coverage / Taxonomy
    • Market Definition / Scope / Limitations
  3. Market Background
    • Market Dynamics
      • Drivers
      • Restraints
      • Opportunity
      • Trends
    • Scenario Forecast
      • Demand in Optimistic Scenario
      • Demand in Likely Scenario
      • Demand in Conservative Scenario
    • Opportunity Map Analysis
    • Product Life Cycle Analysis
    • Supply Chain Analysis
    • Investment Feasibility Matrix
    • Value Chain Analysis
    • PESTLE and Porter’s Analysis
    • Regulatory Landscape
    • Regional Parent Market Outlook
    • Production and Consumption Statistics
    • Import and Export Statistics
  4. Global Pumpjacks Market Analysis 2020-2024 and Forecast, 2025-2035
    • Historical Market Size Value (USD Mn) Analysis, 2020-2024
    • Current and Future Market Size Value (USD Mn) Projections, 2025-2035
      • Y-o-Y Growth Trend Analysis
      • Absolute $ Opportunity Analysis
  5. Global Pumpjacks Market Pricing Analysis 2020-2024 and Forecast 2025-2035
  6. Global Pumpjacks Market Analysis 2020-2024 and Forecast 2025-2035, By Type
    • Introduction / Key Findings
    • Historical Market Size Value (USD Mn) Analysis By Type , 2020-2024
    • Current and Future Market Size Value (USD Mn) Analysis and Forecast By Type , 2025-2035
      • Conventional Pump Jacks
      • Hydraulic Pump Jacks
      • Electric Pump Jacks
      • Others (Gas Lift Pump Jacks, etc.)
    • Y-o-Y Growth Trend Analysis By Type , 2020-2024
    • Absolute $ Opportunity Analysis By Type , 2025-2035
  7. Global Pumpjacks Market Analysis 2020-2024 and Forecast 2025-2035, By Operations
    • Introduction / Key Findings
    • Historical Market Size Value (USD Mn) Analysis By Operations, 2020-2024
    • Current and Future Market Size Value (USD Mn) Analysis and Forecast By Operations, 2025-2035
      • Manual
      • Semi-Automatic
      • Automated
    • Y-o-Y Growth Trend Analysis By Operations, 2020-2024
    • Absolute $ Opportunity Analysis By Operations, 2025-2035
  8. Global Pumpjacks Market Analysis 2020-2024 and Forecast 2025-2035, By Capacity
    • Introduction / Key Findings
    • Historical Market Size Value (USD Mn) Analysis By Capacity, 2020-2024
    • Current and Future Market Size Value (USD Mn) Analysis and Forecast By Capacity, 2025-2035
      • Up to 100 bpd
      • 100-500 bpd
      • 500-1000 bpd
      • Above 1000 bpd
    • Y-o-Y Growth Trend Analysis By Capacity, 2020-2024
    • Absolute $ Opportunity Analysis By Capacity, 2025-2035
  9. Global Pumpjacks Market Analysis 2020-2024 and Forecast 2025-2035, By End-use
    • Introduction / Key Findings
    • Historical Market Size Value (USD Mn) Analysis By End-use, 2020-2024
    • Current and Future Market Size Value (USD Mn) Analysis and Forecast By End-use, 2025-2035
      • Oil and Gas Industry
      • Mining Industry
      • Agriculture
      • Others (Construction, Geothermal Energy Production, etc.)
    • Y-o-Y Growth Trend Analysis By End-use, 2020-2024
    • Absolute $ Opportunity Analysis By End-use, 2025-2035
  10. Global Pumpjacks Market Analysis 2020-2024 and Forecast 2025-2035, By Distribution Channel
    • Introduction / Key Findings
    • Historical Market Size Value (USD Mn) Analysis By Distribution Channel, 2020-2024
    • Current and Future Market Size Value (USD Mn) Analysis and Forecast By Distribution Channel, 2025-2035
      • Direct
      • Indirect
    • Y-o-Y Growth Trend Analysis By Distribution Channel, 2020-2024
    • Absolute $ Opportunity Analysis By Distribution Channel, 2025-2035
  11. Global Pumpjacks Market Analysis 2020-2024 and Forecast 2025-2035, By Region
    • Introduction
    • Historical Market Size Value (USD Mn) Analysis By Region, 2020-2024
    • Current Market Size Value (USD Mn) Analysis and Forecast By Region, 2025-2035
      • North America
      • Latin America
      • Western Europe
      • Eastern Europe
      • East Asia
      • South Asia and Pacific
      • Middle East & Africa
    • Market Attractiveness Analysis By Region
  12. North America Pumpjacks Market Analysis 2020-2024 and Forecast 2025-2035, By Country
    • Historical Market Size Value (USD Mn) Trend Analysis By Market Taxonomy, 2020-2024
    • Market Size Value (USD Mn) Forecast By Market Taxonomy, 2025-2035
      • By Country
        • U.S.
        • Canada
        • Mexico
      • By Type
      • By Operations
      • By Capacity
      • By End-use
      • By Distribution Channel
    • Market Attractiveness Analysis
      • By Country
      • By Type
      • By Operations
      • By Capacity
      • By End-use
      • By Distribution Channel
    • Key Takeaways
  13. Latin America Pumpjacks Market Analysis 2020-2024 and Forecast 2025-2035, By Country
    • Historical Market Size Value (USD Mn) Trend Analysis By Market Taxonomy, 2020-2024
    • Market Size Value (USD Mn) Forecast By Market Taxonomy, 2025-2035
      • By Country
        • Brazil
        • Chile
        • Rest of Latin America
      • By Type
      • By Operations
      • By Capacity
      • By End-use
      • By Distribution Channel
    • Market Attractiveness Analysis
      • By Country
      • By Type
      • By Operations
      • By Capacity
      • By End-use
      • By Distribution Channel
    • Key Takeaways
  14. Western Europe Pumpjacks Market Analysis 2020-2024 and Forecast 2025-2035, By Country
    • Historical Market Size Value (USD Mn) Trend Analysis By Market Taxonomy, 2020-2024
    • Market Size Value (USD Mn) Forecast By Market Taxonomy, 2025-2035
      • By Country
        • Germany
        • UK
        • Italy
        • Spain
        • France
        • Nordic
        • BENELUX
        • Rest of Western Europe
      • By Type
      • By Operations
      • By Capacity
      • By End-use
      • By Distribution Channel
    • Market Attractiveness Analysis
      • By Country
      • By Type
      • By Operations
      • By Capacity
      • By End-use
      • By Distribution Channel
    • Key Takeaways
  15. Eastern Europe Pumpjacks Market Analysis 2020-2024 and Forecast 2025-2035, By Country
    • Historical Market Size Value (USD Mn) Trend Analysis By Market Taxonomy, 2020-2024
    • Market Size Value (USD Mn) Forecast By Market Taxonomy, 2025-2035
      • By Country
        • Russia
        • Poland
        • Hungary
        • Balkan & Baltic
        • Rest of Eastern Europe
      • By Type
      • By Operations
      • By Capacity
      • By End-use
      • By Distribution Channel
    • Market Attractiveness Analysis
      • By Country
      • By Type
      • By Operations
      • By Capacity
      • By End-use
      • By Distribution Channel
    • Key Takeaways
  16. East Asia Pumpjacks Market Analysis 2020-2024 and Forecast 2025-2035, By Country
    • Historical Market Size Value (USD Mn) Trend Analysis By Market Taxonomy, 2020-2024
    • Market Size Value (USD Mn) Forecast By Market Taxonomy, 2025-2035
      • By Country
        • China
        • Japan
        • South Korea
      • By Type
      • By Operations
      • By Capacity
      • By End-use
      • By Distribution Channel
    • Market Attractiveness Analysis
      • By Country
      • By Type
      • By Operations
      • By Capacity
      • By End-use
      • By Distribution Channel
    • Key Takeaways
  17. South Asia and Pacific Pumpjacks Market Analysis 2020-2024 and Forecast 2025-2035, By Country
    • Historical Market Size Value (USD Mn) Trend Analysis By Market Taxonomy, 2020-2024
    • Market Size Value (USD Mn) Forecast By Market Taxonomy, 2025-2035
      • By Country
        • India
        • ASEAN
        • Australia & New Zealand
        • Rest of South Asia and Pacific
      • By Type
      • By Operations
      • By Capacity
      • By End-use
      • By Distribution Channel
    • Market Attractiveness Analysis
      • By Country
      • By Type
      • By Operations
      • By Capacity
      • By End-use
      • By Distribution Channel
    • Key Takeaways
  18. Middle East & Africa Pumpjacks Market Analysis 2020-2024 and Forecast 2025-2035, By Country
    • Historical Market Size Value (USD Mn) Trend Analysis By Market Taxonomy, 2020-2024
    • Market Size Value (USD Mn) Forecast By Market Taxonomy, 2025-2035
      • By Country
        • Kingdom of Saudi Arabia
        • Other GCC Countries
        • Turkiye
        • South Africa
        • Other African Union
        • Rest of Middle East & Africa
      • By Type
      • By Operations
      • By Capacity
      • By End-use
      • By Distribution Channel
    • Market Attractiveness Analysis
      • By Country
      • By Type
      • By Operations
      • By Capacity
      • By End-use
      • By Distribution Channel
    • Key Takeaways
  19. Key Countries Pumpjacks Market Analysis
    • USA
      • Pricing Analysis
      • Market Share Analysis, 2024
        • By Type
        • By Operations
        • By Capacity
        • By End-use
        • By Distribution Channel
    • Canada
      • Pricing Analysis
      • Market Share Analysis, 2024
        • By Type
        • By Operations
        • By Capacity
        • By End-use
        • By Distribution Channel
    • Mexico
      • Pricing Analysis
      • Market Share Analysis, 2024
        • By Type
        • By Operations
        • By Capacity
        • By End-use
        • By Distribution Channel
    • Brazil
      • Pricing Analysis
      • Market Share Analysis, 2024
        • By Type
        • By Operations
        • By Capacity
        • By End-use
        • By Distribution Channel
    • Chile
      • Pricing Analysis
      • Market Share Analysis, 2024
        • By Type
        • By Operations
        • By Capacity
        • By End-use
        • By Distribution Channel
    • Germany
      • Pricing Analysis
      • Market Share Analysis, 2024
        • By Type
        • By Operations
        • By Capacity
        • By End-use
        • By Distribution Channel
    • UK
      • Pricing Analysis
      • Market Share Analysis, 2024
        • By Type
        • By Operations
        • By Capacity
        • By End-use
        • By Distribution Channel
    • Italy
      • Pricing Analysis
      • Market Share Analysis, 2024
        • By Type
        • By Operations
        • By Capacity
        • By End-use
        • By Distribution Channel
    • Spain
      • Pricing Analysis
      • Market Share Analysis, 2024
        • By Type
        • By Operations
        • By Capacity
        • By End-use
        • By Distribution Channel
    • France
      • Pricing Analysis
      • Market Share Analysis, 2024
        • By Type
        • By Operations
        • By Capacity
        • By End-use
        • By Distribution Channel
    • India
      • Pricing Analysis
      • Market Share Analysis, 2024
        • By Type
        • By Operations
        • By Capacity
        • By End-use
        • By Distribution Channel
    • ASEAN
      • Pricing Analysis
      • Market Share Analysis, 2024
        • By Type
        • By Operations
        • By Capacity
        • By End-use
        • By Distribution Channel
    • Australia & New Zealand
      • Pricing Analysis
      • Market Share Analysis, 2024
        • By Type
        • By Operations
        • By Capacity
        • By End-use
        • By Distribution Channel
    • China
      • Pricing Analysis
      • Market Share Analysis, 2024
        • By Type
        • By Operations
        • By Capacity
        • By End-use
        • By Distribution Channel
    • Japan
      • Pricing Analysis
      • Market Share Analysis, 2024
        • By Type
        • By Operations
        • By Capacity
        • By End-use
        • By Distribution Channel
    • South Korea
      • Pricing Analysis
      • Market Share Analysis, 2024
        • By Type
        • By Operations
        • By Capacity
        • By End-use
        • By Distribution Channel
    • Russia
      • Pricing Analysis
      • Market Share Analysis, 2024
        • By Type
        • By Operations
        • By Capacity
        • By End-use
        • By Distribution Channel
    • Poland
      • Pricing Analysis
      • Market Share Analysis, 2024
        • By Type
        • By Operations
        • By Capacity
        • By End-use
        • By Distribution Channel
    • Hungary
      • Pricing Analysis
      • Market Share Analysis, 2024
        • By Type
        • By Operations
        • By Capacity
        • By End-use
        • By Distribution Channel
    • Kingdom of Saudi Arabia
      • Pricing Analysis
      • Market Share Analysis, 2024
        • By Type
        • By Operations
        • By Capacity
        • By End-use
        • By Distribution Channel
    • Turkiye
      • Pricing Analysis
      • Market Share Analysis, 2024
        • By Type
        • By Operations
        • By Capacity
        • By End-use
        • By Distribution Channel
    • South Africa
      • Pricing Analysis
      • Market Share Analysis, 2024
        • By Type
        • By Operations
        • By Capacity
        • By End-use
        • By Distribution Channel
  20. Market Structure Analysis
    • Competition Dashboard
    • Competition Benchmarking
    • Market Share Analysis of Top Players
      • By Regional
      • By Type
      • By Operations
      • By Capacity
      • By End-use
      • By Distribution Channel
  21. Competition Analysis
    • Competition Deep Dive
      • Baker Hughes Company
        • Overview
        • Product Portfolio
        • Profitability by Market Segments (Product/Age /Sales Channel/Region)
        • Sales Footprint
        • Strategy Overview
          • Marketing Strategy
          • Product Strategy
          • Channel Strategy
      • Borets International Limited
      • Canadian Advanced ESP Inc.
      • Cavins Oil Well Tools
      • Dover Corporation
      • FMC Technologies Inc.
      • Gardner Denver Holdings Inc.
      • General Electric Company
      • Halliburton Company
      • Lufkin Industries LLC
      • National Oilwell Varco, Inc.
      • Occidental Petroleum Corporation
      • Schlumberger Limited
      • Tenaris S.A.
      • Weatherford International
  22. Assumptions & Acronyms Used
  23. Research Methodology

List of Tables

  • Table 1: Global Pumpjacks Market Value (USD Mn) Forecast by Region, 2020-2035
  • Table 2: Global Pumpjacks Market Value (USD Mn) Forecast by Type , 2020-2035
  • Table 3: Global Pumpjacks Market Value (USD Mn) Forecast by Operations, 2020-2035
  • Table 4: Global Pumpjacks Market Value (USD Mn) Forecast by Capacity, 2020-2035
  • Table 5: Global Pumpjacks Market Value (USD Mn) Forecast by End-use, 2020-2035
  • Table 6: Global Pumpjacks Market Value (USD Mn) Forecast by Distribution Channel, 2020-2035
  • Table 7: North America Pumpjacks Market Value (USD Mn) Forecast by Country, 2020-2035
  • Table 8: North America Pumpjacks Market Value (USD Mn) Forecast by Type , 2020-2035
  • Table 9: North America Pumpjacks Market Value (USD Mn) Forecast by Operations, 2020-2035
  • Table 10: North America Pumpjacks Market Value (USD Mn) Forecast by Capacity, 2020-2035
  • Table 11: North America Pumpjacks Market Value (USD Mn) Forecast by End-use, 2020-2035
  • Table 12: North America Pumpjacks Market Value (USD Mn) Forecast by Distribution Channel, 2020-2035
  • Table 13: Latin America Pumpjacks Market Value (USD Mn) Forecast by Country, 2020-2035
  • Table 14: Latin America Pumpjacks Market Value (USD Mn) Forecast by Type , 2020-2035
  • Table 15: Latin America Pumpjacks Market Value (USD Mn) Forecast by Operations, 2020-2035
  • Table 16: Latin America Pumpjacks Market Value (USD Mn) Forecast by Capacity, 2020-2035
  • Table 17: Latin America Pumpjacks Market Value (USD Mn) Forecast by End-use, 2020-2035
  • Table 18: Latin America Pumpjacks Market Value (USD Mn) Forecast by Distribution Channel, 2020-2035
  • Table 19: Western Europe Pumpjacks Market Value (USD Mn) Forecast by Country, 2020-2035
  • Table 20: Western Europe Pumpjacks Market Value (USD Mn) Forecast by Type , 2020-2035
  • Table 21: Western Europe Pumpjacks Market Value (USD Mn) Forecast by Operations, 2020-2035
  • Table 22: Western Europe Pumpjacks Market Value (USD Mn) Forecast by Capacity, 2020-2035
  • Table 23: Western Europe Pumpjacks Market Value (USD Mn) Forecast by End-use, 2020-2035
  • Table 24: Western Europe Pumpjacks Market Value (USD Mn) Forecast by Distribution Channel, 2020-2035
  • Table 25: Eastern Europe Pumpjacks Market Value (USD Mn) Forecast by Country, 2020-2035
  • Table 26: Eastern Europe Pumpjacks Market Value (USD Mn) Forecast by Type , 2020-2035
  • Table 27: Eastern Europe Pumpjacks Market Value (USD Mn) Forecast by Operations, 2020-2035
  • Table 28: Eastern Europe Pumpjacks Market Value (USD Mn) Forecast by Capacity, 2020-2035
  • Table 29: Eastern Europe Pumpjacks Market Value (USD Mn) Forecast by End-use, 2020-2035
  • Table 30: Eastern Europe Pumpjacks Market Value (USD Mn) Forecast by Distribution Channel, 2020-2035
  • Table 31: East Asia Pumpjacks Market Value (USD Mn) Forecast by Country, 2020-2035
  • Table 32: East Asia Pumpjacks Market Value (USD Mn) Forecast by Type , 2020-2035
  • Table 33: East Asia Pumpjacks Market Value (USD Mn) Forecast by Operations, 2020-2035
  • Table 34: East Asia Pumpjacks Market Value (USD Mn) Forecast by Capacity, 2020-2035
  • Table 35: East Asia Pumpjacks Market Value (USD Mn) Forecast by End-use, 2020-2035
  • Table 36: East Asia Pumpjacks Market Value (USD Mn) Forecast by Distribution Channel, 2020-2035
  • Table 37: South Asia and Pacific Pumpjacks Market Value (USD Mn) Forecast by Country, 2020-2035
  • Table 38: South Asia and Pacific Pumpjacks Market Value (USD Mn) Forecast by Type , 2020-2035
  • Table 39: South Asia and Pacific Pumpjacks Market Value (USD Mn) Forecast by Operations, 2020-2035
  • Table 40: South Asia and Pacific Pumpjacks Market Value (USD Mn) Forecast by Capacity, 2020-2035
  • Table 41: South Asia and Pacific Pumpjacks Market Value (USD Mn) Forecast by End-use, 2020-2035
  • Table 42: South Asia and Pacific Pumpjacks Market Value (USD Mn) Forecast by Distribution Channel, 2020-2035
  • Table 43: Middle East & Africa Pumpjacks Market Value (USD Mn) Forecast by Country, 2020-2035
  • Table 44: Middle East & Africa Pumpjacks Market Value (USD Mn) Forecast by Type , 2020-2035
  • Table 45: Middle East & Africa Pumpjacks Market Value (USD Mn) Forecast by Operations, 2020-2035
  • Table 46: Middle East & Africa Pumpjacks Market Value (USD Mn) Forecast by Capacity, 2020-2035
  • Table 47: Middle East & Africa Pumpjacks Market Value (USD Mn) Forecast by End-use, 2020-2035
  • Table 48: Middle East & Africa Pumpjacks Market Value (USD Mn) Forecast by Distribution Channel, 2020-2035

List of Figures

  • Figure 1: Global Pumpjacks Market Pricing Analysis
  • Figure 2: Global Pumpjacks Market Value (USD Mn) Forecast 2020–2035
  • Figure 3: Global Pumpjacks Market Value Share and BPS Analysis by Type , 2025 and 2035
  • Figure 4: Global Pumpjacks Market Y-o-Y Growth Comparison by Type , 2025–2035
  • Figure 5: Global Pumpjacks Market Attractiveness Analysis by Type
  • Figure 6: Global Pumpjacks Market Value Share and BPS Analysis by Operations, 2025 and 2035
  • Figure 7: Global Pumpjacks Market Y-o-Y Growth Comparison by Operations, 2025–2035
  • Figure 8: Global Pumpjacks Market Attractiveness Analysis by Operations
  • Figure 9: Global Pumpjacks Market Value Share and BPS Analysis by Capacity, 2025 and 2035
  • Figure 10: Global Pumpjacks Market Y-o-Y Growth Comparison by Capacity, 2025–2035
  • Figure 11: Global Pumpjacks Market Attractiveness Analysis by Capacity
  • Figure 12: Global Pumpjacks Market Value Share and BPS Analysis by End-use, 2025 and 2035
  • Figure 13: Global Pumpjacks Market Y-o-Y Growth Comparison by End-use, 2025–2035
  • Figure 14: Global Pumpjacks Market Attractiveness Analysis by End-use
  • Figure 15: Global Pumpjacks Market Value Share and BPS Analysis by Distribution Channel, 2025 and 2035
  • Figure 16: Global Pumpjacks Market Y-o-Y Growth Comparison by Distribution Channel, 2025–2035
  • Figure 17: Global Pumpjacks Market Attractiveness Analysis by Distribution Channel
  • Figure 18: Global Pumpjacks Market Value (USD Mn) Share and BPS Analysis by Region, 2025 and 2035
  • Figure 19: Global Pumpjacks Market Y-o-Y Growth Comparison by Region, 2025–2035
  • Figure 20: Global Pumpjacks Market Attractiveness Analysis by Region
  • Figure 21: North America Pumpjacks Market Incremental Dollar Opportunity, 2025–2035
  • Figure 22: Latin America Pumpjacks Market Incremental Dollar Opportunity, 2025–2035
  • Figure 23: Western Europe Pumpjacks Market Incremental Dollar Opportunity, 2025–2035
  • Figure 24: Eastern Europe Pumpjacks Market Incremental Dollar Opportunity, 2025–2035
  • Figure 25: East Asia Pumpjacks Market Incremental Dollar Opportunity, 2025–2035
  • Figure 26: South Asia and Pacific Pumpjacks Market Incremental Dollar Opportunity, 2025–2035
  • Figure 27: Middle East & Africa Pumpjacks Market Incremental Dollar Opportunity, 2025–2035
  • Figure 28: North America Pumpjacks Market Value Share and BPS Analysis by Country, 2025 and 2035
  • Figure 29: North America Pumpjacks Market Value Share and BPS Analysis by Type , 2025 and 2035
  • Figure 30: North America Pumpjacks Market Y-o-Y Growth Comparison by Type , 2025–2035
  • Figure 31: North America Pumpjacks Market Attractiveness Analysis by Type
  • Figure 32: North America Pumpjacks Market Value Share and BPS Analysis by Operations, 2025 and 2035
  • Figure 33: North America Pumpjacks Market Y-o-Y Growth Comparison by Operations, 2025–2035
  • Figure 34: North America Pumpjacks Market Attractiveness Analysis by Operations
  • Figure 35: North America Pumpjacks Market Value Share and BPS Analysis by Capacity, 2025 and 2035
  • Figure 36: North America Pumpjacks Market Y-o-Y Growth Comparison by Capacity, 2025–2035
  • Figure 37: North America Pumpjacks Market Attractiveness Analysis by Capacity
  • Figure 38: North America Pumpjacks Market Value Share and BPS Analysis by End-use, 2025 and 2035
  • Figure 39: North America Pumpjacks Market Y-o-Y Growth Comparison by End-use, 2025–2035
  • Figure 40: North America Pumpjacks Market Attractiveness Analysis by End-use
  • Figure 41: North America Pumpjacks Market Value Share and BPS Analysis by Distribution Channel, 2025 and 2035
  • Figure 42: North America Pumpjacks Market Y-o-Y Growth Comparison by Distribution Channel, 2025–2035
  • Figure 43: North America Pumpjacks Market Attractiveness Analysis by Distribution Channel
  • Figure 44: Latin America Pumpjacks Market Value Share and BPS Analysis by Country, 2025 and 2035
  • Figure 45: Latin America Pumpjacks Market Value Share and BPS Analysis by Type , 2025 and 2035
  • Figure 46: Latin America Pumpjacks Market Y-o-Y Growth Comparison by Type , 2025–2035
  • Figure 47: Latin America Pumpjacks Market Attractiveness Analysis by Type
  • Figure 48: Latin America Pumpjacks Market Value Share and BPS Analysis by Operations, 2025 and 2035
  • Figure 49: Latin America Pumpjacks Market Y-o-Y Growth Comparison by Operations, 2025–2035
  • Figure 50: Latin America Pumpjacks Market Attractiveness Analysis by Operations
  • Figure 51: Latin America Pumpjacks Market Value Share and BPS Analysis by Capacity, 2025 and 2035
  • Figure 52: Latin America Pumpjacks Market Y-o-Y Growth Comparison by Capacity, 2025–2035
  • Figure 53: Latin America Pumpjacks Market Attractiveness Analysis by Capacity
  • Figure 54: Latin America Pumpjacks Market Value Share and BPS Analysis by End-use, 2025 and 2035
  • Figure 55: Latin America Pumpjacks Market Y-o-Y Growth Comparison by End-use, 2025–2035
  • Figure 56: Latin America Pumpjacks Market Attractiveness Analysis by End-use
  • Figure 57: Latin America Pumpjacks Market Value Share and BPS Analysis by Distribution Channel, 2025 and 2035
  • Figure 58: Latin America Pumpjacks Market Y-o-Y Growth Comparison by Distribution Channel, 2025–2035
  • Figure 59: Latin America Pumpjacks Market Attractiveness Analysis by Distribution Channel
  • Figure 60: Western Europe Pumpjacks Market Value Share and BPS Analysis by Country, 2025 and 2035
  • Figure 61: Western Europe Pumpjacks Market Value Share and BPS Analysis by Type , 2025 and 2035
  • Figure 62: Western Europe Pumpjacks Market Y-o-Y Growth Comparison by Type , 2025–2035
  • Figure 63: Western Europe Pumpjacks Market Attractiveness Analysis by Type
  • Figure 64: Western Europe Pumpjacks Market Value Share and BPS Analysis by Operations, 2025 and 2035
  • Figure 65: Western Europe Pumpjacks Market Y-o-Y Growth Comparison by Operations, 2025–2035
  • Figure 66: Western Europe Pumpjacks Market Attractiveness Analysis by Operations
  • Figure 67: Western Europe Pumpjacks Market Value Share and BPS Analysis by Capacity, 2025 and 2035
  • Figure 68: Western Europe Pumpjacks Market Y-o-Y Growth Comparison by Capacity, 2025–2035
  • Figure 69: Western Europe Pumpjacks Market Attractiveness Analysis by Capacity
  • Figure 70: Western Europe Pumpjacks Market Value Share and BPS Analysis by End-use, 2025 and 2035
  • Figure 71: Western Europe Pumpjacks Market Y-o-Y Growth Comparison by End-use, 2025–2035
  • Figure 72: Western Europe Pumpjacks Market Attractiveness Analysis by End-use
  • Figure 73: Western Europe Pumpjacks Market Value Share and BPS Analysis by Distribution Channel, 2025 and 2035
  • Figure 74: Western Europe Pumpjacks Market Y-o-Y Growth Comparison by Distribution Channel, 2025–2035
  • Figure 75: Western Europe Pumpjacks Market Attractiveness Analysis by Distribution Channel
  • Figure 76: Eastern Europe Pumpjacks Market Value Share and BPS Analysis by Country, 2025 and 2035
  • Figure 77: Eastern Europe Pumpjacks Market Value Share and BPS Analysis by Type , 2025 and 2035
  • Figure 78: Eastern Europe Pumpjacks Market Y-o-Y Growth Comparison by Type , 2025–2035
  • Figure 79: Eastern Europe Pumpjacks Market Attractiveness Analysis by Type
  • Figure 80: Eastern Europe Pumpjacks Market Value Share and BPS Analysis by Operations, 2025 and 2035
  • Figure 81: Eastern Europe Pumpjacks Market Y-o-Y Growth Comparison by Operations, 2025–2035
  • Figure 82: Eastern Europe Pumpjacks Market Attractiveness Analysis by Operations
  • Figure 83: Eastern Europe Pumpjacks Market Value Share and BPS Analysis by Capacity, 2025 and 2035
  • Figure 84: Eastern Europe Pumpjacks Market Y-o-Y Growth Comparison by Capacity, 2025–2035
  • Figure 85: Eastern Europe Pumpjacks Market Attractiveness Analysis by Capacity
  • Figure 86: Eastern Europe Pumpjacks Market Value Share and BPS Analysis by End-use, 2025 and 2035
  • Figure 87: Eastern Europe Pumpjacks Market Y-o-Y Growth Comparison by End-use, 2025–2035
  • Figure 88: Eastern Europe Pumpjacks Market Attractiveness Analysis by End-use
  • Figure 89: Eastern Europe Pumpjacks Market Value Share and BPS Analysis by Distribution Channel, 2025 and 2035
  • Figure 90: Eastern Europe Pumpjacks Market Y-o-Y Growth Comparison by Distribution Channel, 2025–2035
  • Figure 91: Eastern Europe Pumpjacks Market Attractiveness Analysis by Distribution Channel
  • Figure 92: East Asia Pumpjacks Market Value Share and BPS Analysis by Country, 2025 and 2035
  • Figure 93: East Asia Pumpjacks Market Value Share and BPS Analysis by Type , 2025 and 2035
  • Figure 94: East Asia Pumpjacks Market Y-o-Y Growth Comparison by Type , 2025–2035
  • Figure 95: East Asia Pumpjacks Market Attractiveness Analysis by Type
  • Figure 96: East Asia Pumpjacks Market Value Share and BPS Analysis by Operations, 2025 and 2035
  • Figure 97: East Asia Pumpjacks Market Y-o-Y Growth Comparison by Operations, 2025–2035
  • Figure 98: East Asia Pumpjacks Market Attractiveness Analysis by Operations
  • Figure 99: East Asia Pumpjacks Market Value Share and BPS Analysis by Capacity, 2025 and 2035
  • Figure 100: East Asia Pumpjacks Market Y-o-Y Growth Comparison by Capacity, 2025–2035
  • Figure 101: East Asia Pumpjacks Market Attractiveness Analysis by Capacity
  • Figure 102: East Asia Pumpjacks Market Value Share and BPS Analysis by End-use, 2025 and 2035
  • Figure 103: East Asia Pumpjacks Market Y-o-Y Growth Comparison by End-use, 2025–2035
  • Figure 104: East Asia Pumpjacks Market Attractiveness Analysis by End-use
  • Figure 105: East Asia Pumpjacks Market Value Share and BPS Analysis by Distribution Channel, 2025 and 2035
  • Figure 106: East Asia Pumpjacks Market Y-o-Y Growth Comparison by Distribution Channel, 2025–2035
  • Figure 107: East Asia Pumpjacks Market Attractiveness Analysis by Distribution Channel
  • Figure 108: South Asia and Pacific Pumpjacks Market Value Share and BPS Analysis by Country, 2025 and 2035
  • Figure 109: South Asia and Pacific Pumpjacks Market Value Share and BPS Analysis by Type , 2025 and 2035
  • Figure 110: South Asia and Pacific Pumpjacks Market Y-o-Y Growth Comparison by Type , 2025–2035
  • Figure 111: South Asia and Pacific Pumpjacks Market Attractiveness Analysis by Type
  • Figure 112: South Asia and Pacific Pumpjacks Market Value Share and BPS Analysis by Operations, 2025 and 2035
  • Figure 113: South Asia and Pacific Pumpjacks Market Y-o-Y Growth Comparison by Operations, 2025–2035
  • Figure 114: South Asia and Pacific Pumpjacks Market Attractiveness Analysis by Operations
  • Figure 115: South Asia and Pacific Pumpjacks Market Value Share and BPS Analysis by Capacity, 2025 and 2035
  • Figure 116: South Asia and Pacific Pumpjacks Market Y-o-Y Growth Comparison by Capacity, 2025–2035
  • Figure 117: South Asia and Pacific Pumpjacks Market Attractiveness Analysis by Capacity
  • Figure 118: South Asia and Pacific Pumpjacks Market Value Share and BPS Analysis by End-use, 2025 and 2035
  • Figure 119: South Asia and Pacific Pumpjacks Market Y-o-Y Growth Comparison by End-use, 2025–2035
  • Figure 120: South Asia and Pacific Pumpjacks Market Attractiveness Analysis by End-use
  • Figure 121: South Asia and Pacific Pumpjacks Market Value Share and BPS Analysis by Distribution Channel, 2025 and 2035
  • Figure 122: South Asia and Pacific Pumpjacks Market Y-o-Y Growth Comparison by Distribution Channel, 2025–2035
  • Figure 123: South Asia and Pacific Pumpjacks Market Attractiveness Analysis by Distribution Channel
  • Figure 124: Middle East & Africa Pumpjacks Market Value Share and BPS Analysis by Country, 2025 and 2035
  • Figure 125: Middle East & Africa Pumpjacks Market Value Share and BPS Analysis by Type , 2025 and 2035
  • Figure 126: Middle East & Africa Pumpjacks Market Y-o-Y Growth Comparison by Type , 2025–2035
  • Figure 127: Middle East & Africa Pumpjacks Market Attractiveness Analysis by Type
  • Figure 128: Middle East & Africa Pumpjacks Market Value Share and BPS Analysis by Operations, 2025 and 2035
  • Figure 129: Middle East & Africa Pumpjacks Market Y-o-Y Growth Comparison by Operations, 2025–2035
  • Figure 130: Middle East & Africa Pumpjacks Market Attractiveness Analysis by Operations
  • Figure 131: Middle East & Africa Pumpjacks Market Value Share and BPS Analysis by Capacity, 2025 and 2035
  • Figure 132: Middle East & Africa Pumpjacks Market Y-o-Y Growth Comparison by Capacity, 2025–2035
  • Figure 133: Middle East & Africa Pumpjacks Market Attractiveness Analysis by Capacity
  • Figure 134: Middle East & Africa Pumpjacks Market Value Share and BPS Analysis by End-use, 2025 and 2035
  • Figure 135: Middle East & Africa Pumpjacks Market Y-o-Y Growth Comparison by End-use, 2025–2035
  • Figure 136: Middle East & Africa Pumpjacks Market Attractiveness Analysis by End-use
  • Figure 137: Middle East & Africa Pumpjacks Market Value Share and BPS Analysis by Distribution Channel, 2025 and 2035
  • Figure 138: Middle East & Africa Pumpjacks Market Y-o-Y Growth Comparison by Distribution Channel, 2025–2035
  • Figure 139: Middle East & Africa Pumpjacks Market Attractiveness Analysis by Distribution Channel
  • Figure 140: Global Pumpjacks Market – Tier Structure Analysis
  • Figure 141: Global Pumpjacks Market – Company Share Analysis

Frequently Asked Questions

How big is the pumpjacks market in 2025?

The global pumpjacks market is estimated to be valued at USD 3.8 billion in 2025.

What will be the size of pumpjacks market in 2035?

The market size for the pumpjacks market is projected to reach USD 6.6 billion by 2035.

How much will be the pumpjacks market growth between 2025 and 2035?

The pumpjacks market is expected to grow at a 5.7% CAGR between 2025 and 2035.

What are the key product types in the pumpjacks market?

The key product types in pumpjacks market are conventional pump jacks, hydraulic pump jacks, electric pump jacks and others (gas lift pump jacks, etc.).

Which operations segment to contribute significant share in the pumpjacks market in 2025?

In terms of operations, manual segment to command 39.7% share in the pumpjacks market in 2025.

Future Market Insights

Pumpjacks Market

Chat With

MaRIA

Hi There, I am MaRIA, Your Market Research Intelligence Assistant. How may I help you?