The ride-on mower industry stands at the threshold of a decade-long expansion trajectory that promises to reshape turf maintenance technology, sustainable landscaping solutions, and automated mowing applications. The market's journey from USD 4.0 billion in 2025 to USD 6.2 billion by 2035 represents substantial growth, demonstrating the accelerating adoption of advanced mower configurations and cutting technology across residential properties, commercial landscaping, municipal maintenance, and golf course sectors.
The first half of the decade (2025-2030) will witness the market climbing from USD 4.0 billion to approximately USD 5.0 billion, adding USD 1.0 billion in value, which constitutes 45% of the total forecast growth period. This phase will be characterized by the rapid adoption of battery-electric zero-turn systems, driven by increasing noise regulation requirements and the growing need for high-performance emission-free equipment worldwide. Advanced hydrostatic transmission capabilities and electrified propulsion systems will become standard expectations rather than premium options.
The latter half (2030-2035) will witness sustained growth from USD 5.0 billion to USD 6.2 billion, representing an addition of USD 1.2 billion or 55% of the decade's expansion. This period will be defined by mass market penetration of specialized autonomous mowing systems, integration with comprehensive fleet management platforms, and seamless compatibility with existing landscape maintenance infrastructure. The market trajectory signals fundamental shifts in how property managers approach turf care optimization and operational efficiency management, with participants positioned to benefit from sustained demand across multiple mower types and application segments.
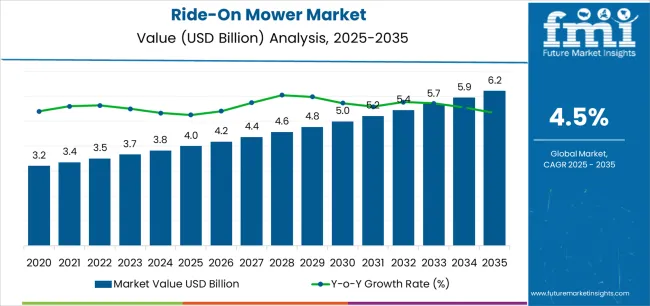
The Ride-On Mower market demonstrates distinct growth phases with varying market characteristics and competitive dynamics. Between 2025 and 2030, the market progresses through its technology adoption phase, expanding from USD 4.0 billion to USD 5.0 billion with steady annual increments averaging 4.5% growth. This period showcases the transition from conventional gasoline-powered equipment to advanced battery-electric systems with enhanced cutting capabilities and integrated telematics becoming mainstream features.
The 2025-2030 phase adds USD 1.0 billion to market value, representing 45% of total decade expansion. Market maturation factors include standardization of battery and charging protocols, declining component costs for electric ride-on mowers, and increasing industry awareness of noise reduction benefits reaching 80-85% operational efficiency in commercial landscaping applications. Competitive landscape evolution during this period features established equipment manufacturers like Deere & Company and Husqvarna expanding their electrified mower portfolios while specialty manufacturers focus on advanced telematics development and enhanced cutting system capabilities.
From 2030 to 2035, market dynamics shift toward advanced fleet integration and global landscaping expansion, with growth continuing from USD 5.0 billion to USD 6.2 billion, adding USD 1.2 billion or 55% of total expansion. This phase transition centers on fully connected fleet management systems, integration with comprehensive property maintenance networks, and deployment across diverse turf management and commercial mowing scenarios, becoming standard rather than specialized applications. The competitive environment matures with focus shifting from basic mowing capability to comprehensive landscape optimization systems and integration with predictive maintenance platforms.
| Metric | Value |
|---|---|
| Market Value (2025) | USD 4.0 billion |
| Market Forecast (2035) | USD 6.2 billion |
| Growth Rate | 4.5% CAGR |
| Leading Technology | Zero-Turn Mowers Product Type |
| Primary Fuel Type | Gasoline-Powered Segment |
The market demonstrates strong fundamentals with zero-turn mower systems capturing a dominant share through advanced maneuverability and productivity optimization capabilities. Gasoline-powered applications drive primary demand, supported by increasing large-property maintenance and commercial landscaping technology requirements. Geographic expansion remains concentrated in developed markets with established lawn care infrastructure, while emerging economies show accelerating adoption rates driven by residential property development and rising landscaping standards.
Market expansion rests on three fundamental shifts driving adoption across the landscaping, property maintenance, and turf management sectors.
The large-property ownership growth creates compelling operational advantages through ride-on mowers that provide efficient coverage for expansive lawns without manual walking limitations, enabling property owners to achieve professional-quality results while maintaining productivity and reducing physical labor requirements.
The commercial landscaping modernization accelerates as lawn care operations worldwide seek advanced zero-turn systems that replace traditional tractors, enabling maneuverability enhancement and time efficiency that align with service quality standards and contractor profitability objectives.
The municipal sustainability mandates drive adoption from government facilities and park management requiring effective low-emission solutions that minimize noise pollution while maintaining turf quality during scheduled maintenance operations and noise-sensitive urban applications. The growth faces headwinds from capital investment challenges that vary across residential users regarding the procurement of premium electric equipment and advanced zero-turn systems, which may limit adoption in price-sensitive lawn care environments. Battery technology limitations also persist regarding runtime duration and charging infrastructure that may reduce effectiveness in large-acreage applications and continuous operation requirements, which affect equipment utilization and operational continuity.
The ride-on mower market represents a specialized yet critical equipment opportunity driven by expanding residential property sizes, commercial landscaping infrastructure modernization, and the need for superior turf maintenance efficiency in diverse applications. As landscape contractors worldwide seek to achieve 80-85% equipment utilization effectiveness, reduce emissions by 50-70%, and integrate advanced fleet management systems with route optimization platforms, ride-on mowers are evolving from basic cutting machinery to sophisticated turf care solutions ensuring productivity and environmental compliance.
The market's growth trajectory from USD 4.0 billion in 2025 to USD 6.2 billion by 2035 at a 4.5% CAGR reflects fundamental shifts in landscaping sustainability requirements and operational efficiency optimization. Geographic expansion opportunities are particularly pronounced in North America and European markets, while the dominance of zero-turn mower systems (42.1% market share) and gasoline-powered applications (63.0% share) provides clear strategic focus areas.
Strengthening the dominant zero-turn mower segment (42.1% market share) through enhanced hydrostatic transmission configurations, superior turning radius capability, and automated cutting deck systems. This pathway focuses on optimizing battery technology for electric zero-turns, improving operational speed, extending equipment effectiveness to 3-4 hour operation cycles, and developing specialized models for diverse landscape applications. Market leadership consolidation through advanced hydraulic engineering and telemetry integration enables premium positioning while defending competitive advantages against conventional garden tractors. Expected revenue pool: USD 180-240 million
Large-lot residential growth and commercial contractor fleet expansion across North America creates substantial opportunities through dealer network strengthening and financing program development. Growing suburban development and lawn care service professionalization drive sustained demand for advanced ride-on systems. Regional distribution strategies enhance parts availability, enable faster service support, and position companies advantageously for seasonal demand patterns while accessing growing residential and commercial markets. Expected revenue pool: USD 160-210 million
Strategic advancement in electric mower adoption requires enhanced battery capacity capabilities and specialized charging infrastructure addressing commercial runtime requirements. This pathway addresses emission-free operations, noise ordinance compliance, and zero-emission mandates with advanced lithium-ion engineering for demanding continuous mowing conditions. Premium pricing reflects environmental leadership and operational cost savings through reduced fuel and maintenance requirements. Expected revenue pool: USD 140-180 million
Expansion within commercial landscaping segment through specialized equipment addressing professional contractor standards and fleet management requirements. This pathway encompasses telematics-enabled fleet tracking, maintenance scheduling automation, and compatibility with diverse property maintenance workflows. Premium positioning reflects superior uptime reliability and comprehensive service support enabling modern landscape contractor operations. Expected revenue pool: USD 120-160 million
Development of enhanced garden tractor capabilities (31.0% market share) for property owners requiring multi-season utility through snow removal, material hauling, and ground engagement applications. This pathway encompasses power take-off versatility, attachment ecosystem development, and year-round equipment utilization optimization. Market retention through comprehensive capability differentiation enables sustained revenue while addressing homeowner investment justification requirements. Expected revenue pool: USD 100-130 million
Expansion targeting government facilities, parks departments, and golf course operations through specialized equipment configurations for professional turf standards. This pathway encompasses precision cutting height control, turf health monitoring integration, and specialized solutions for sports field maintenance. Market development through performance validation enables differentiated positioning while accessing budget-allocated institutional procurement requiring long-term durability. Expected revenue pool: USD 80-110 million
Development of comprehensive fleet monitoring systems addressing maintenance optimization and downtime reduction requirements across ride-on mower fleets. This pathway encompasses IoT sensor integration, AI-powered diagnostics, and comprehensive service management platforms. Premium positioning reflects operational excellence and total cost of ownership optimization while enabling access to technology-focused landscape companies and dealer service partnerships. Expected revenue pool: USD 70-90 million
Primary Classification: The market segments by product type into Zero-Turn Mowers, Garden Tractors, Rear-Engine Mowers, and Out-Front/Others categories, representing the evolution from basic riding mowers to specialized machinery solutions for comprehensive turf maintenance optimization.
Secondary Classification: Fuel type segmentation divides the market into Gasoline-Powered, Electric (Battery-Powered), and Diesel-Powered categories, reflecting distinct requirements for operational duration, environmental compliance, and power output standards.
Tertiary Classification: Blade type segmentation encompasses Rotary Blades, Mulching Blades, and Cylindrical/Reel Blades, representing diverse cutting approaches for turf quality and maintenance efficiency.
Regional Classification: Geographic distribution covers North America, Europe, Asia Pacific, Latin America, Africa, and the Middle East, with developed markets leading technology adoption while emerging economies show accelerating growth patterns driven by residential property development programs.
The segmentation structure reveals technology progression from conventional gasoline-powered riding mowers toward battery-electric systems with enhanced maneuverability and fleet management capabilities, while application diversity spans from residential lawn care to specialized commercial landscaping and municipal maintenance requiring advanced turf care solutions.
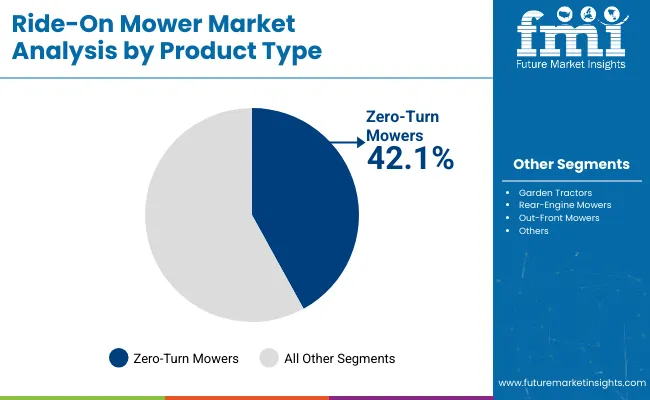
Market Position: Zero-turn mower systems command the leading position in the Ride-On Mower market with approximately 42.1% market share through advanced maneuverability features, including superior turning capability, efficient productivity performance, and operational flexibility that enable landscape contractors to achieve optimal coverage across diverse property configurations.
Value Drivers: The segment benefits from commercial operator preference for time-efficient cutting systems that provide consistent productivity performance, reduced mowing time, and service capacity optimization without requiring extensive maneuvering space. Advanced hydraulic features enable independent rear wheel control, responsive steering precision, and integration with commercial-grade cutting decks, where maneuverability and speed represent critical competitive requirements.
Competitive Advantages: Zero-turn systems differentiate through proven time savings, optimal productivity-to-operator ratios, and integration with landscape contractor workflows that enhance service capacity while maintaining equipment costs suitable for diverse commercial applications and residential premium segments.
Key market characteristics:
Garden tractor systems maintain 31.0% market share due to their essential versatility capabilities in year-round property maintenance operations. Rear-engine mowers capture 16.4% share through compact design and residential user-friendly features. Out-front and specialty configurations demonstrate 10.5% adoption in professional turf management and specialized landscape applications requiring forward visibility.
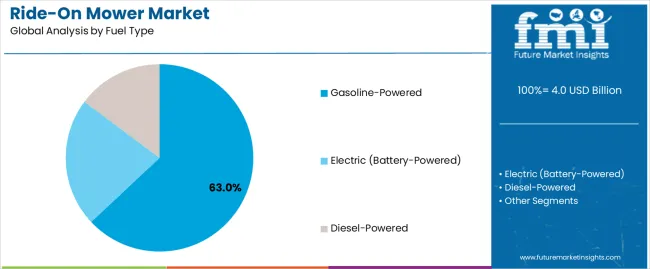
Market Context: Gasoline-powered applications dominate the Ride-On Mower market with approximately 63.0% market share due to widespread adoption of proven internal combustion technology and established focus on extended runtime, rapid refueling capability, and power output applications that maximize operational duration while maintaining cutting performance standards.
Appeal Factors: Property owners and landscape contractors prioritize equipment reliability, operational range, and integration with existing fuel infrastructure that enables uninterrupted mowing operations across large acreage. The segment benefits from substantial dealer service network coverage and equipment affordability advantages that emphasize gasoline engine familiarity and maintenance accessibility for diverse user segments.
Growth Drivers: Large-property residential expansion programs incorporate gasoline-powered ride-ons as essential equipment for multi-acre lawn maintenance, while commercial landscaping growth increases demand for proven propulsion systems that comply with service duration requirements and optimize contractor productivity.
Market Challenges: Increasing emission regulations and noise ordinances in urban municipalities may limit gasoline equipment deployment across certain residential and commercial scenarios.
Application dynamics include:
Electric battery-powered mowers maintain 22.0% market share through emission-free operations, noise reduction features, and urban compliance applications. Diesel-powered systems capture 15.0% share via heavy-duty commercial equipment, municipal fleet operations, and applications requiring maximum power output and fuel economy for large-scale maintenance.
Growth Accelerators: Residential property size expansion drives primary adoption as ride-on mowers provide efficient coverage for large lawns that enable homeowners to maintain professional-quality turf without excessive time investment or physical labor, supporting property value enhancement and curb appeal objectives that align with suburban lifestyle preferences. Commercial landscaping professionalization demand accelerates market expansion as lawn care companies seek productivity-enhancing equipment systems that maximize daily service capacity while maintaining quality standards during competitive bidding and service contract operations. Municipal sustainability spending increases worldwide, creating sustained demand for low-emission mowing equipment that complements noise ordinance compliance, air quality objectives, and environmental stewardship programs providing operational effectiveness in public space maintenance.
Growth Inhibitors: Equipment cost barriers vary across residential segments regarding the procurement of premium zero-turn systems and battery-electric models, which may limit market penetration in middle-income households or regions with smaller average property sizes. Runtime limitations persist regarding battery-powered systems and charging infrastructure that may reduce effectiveness in large-acreage commercial applications, extended service routes, or operations requiring continuous availability, affecting equipment utilization and contractor productivity. Market fragmentation across multiple equipment specifications and cutting deck configurations creates compatibility concerns between different attachment systems and existing property maintenance infrastructure.
Market Evolution Patterns: Adoption accelerates in commercial landscaping operations and premium residential segments where productivity improvements justify advanced equipment costs, with geographic concentration in North American suburban markets transitioning toward mainstream adoption in European and Asia Pacific regions driven by property development and landscaping professionalization. Technology development focuses on enhanced battery systems, improved fleet management connectivity, and integration with automated navigation platforms that optimize route efficiency and operational planning. The market could face disruption if robotic autonomous mowing systems significantly penetrate residential and commercial applications, though the industry's fundamental need for operator-controlled precision and versatile functionality continues to make ride-on mowers essential in professional turf maintenance.
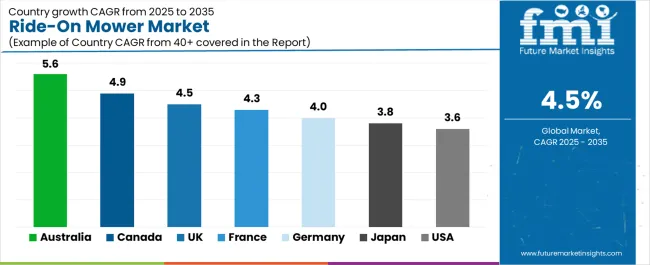
The ride-on mower market demonstrates varied regional dynamics with Growth Leaders including Australia (5.6% CAGR) and Canada (4.9% CAGR) driving expansion through suburban property development and municipal fleet modernization programs. Technology Adopters encompass the United Kingdom (4.5% CAGR), France (4.3% CAGR), and Germany (4.0% CAGR), benefiting from commercial landscaping growth and low-emission equipment adoption. Mature Markets feature Japan (3.8% CAGR) and the United States (3.6% CAGR), where established lawn care industries and gradual electrification support consistent growth patterns.
| Country | CAGR (2025-2035) |
|---|---|
| Australia | 5.6% |
| Canada | 4.9% |
| United Kingdom | 4.5% |
| France | 4.3% |
| Germany | 4.0% |
| Japan | 3.8% |
| United States | 3.6% |
Regional synthesis reveals North American markets maintaining strong demand through residential large-lot development and commercial fleet expansion, while European countries demonstrate robust growth supported by environmental regulations and municipal sustainability programs. Asia Pacific markets show specialized adoption patterns driven by premium residential segments and technology-focused landscape management.
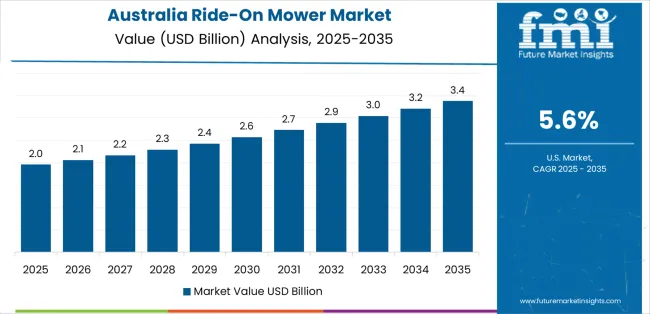
Australia leads growth momentum with a 5.6% CAGR, driven by expansive residential property sizes, municipal green-space maintenance expansion, and large-acreage rural property management across Queensland, New South Wales, Victoria, and Western Australia. Local government infrastructure programs and sports field maintenance requirements drive primary equipment demand, while growing suburban development with large residential lots supports ride-on mower adoption. Government environmental initiatives through noise ordinance enforcement and emission reduction programs support equipment modernization with battery-powered systems suitable for urban council operations.
The convergence of property ownership patterns favoring larger lots, municipal budget allocation for landscape maintenance, and contractor professionalization replacing manual labor positions Australia as a key growth market for ride-on mowers. Drought-resistant lawn species adoption and water conservation landscaping create sustained maintenance requirements, while lifestyle property development in peri-urban areas accelerates residential equipment procurement for acreage management beyond traditional suburban lawns.
Performance Metrics:
The Canadian market emphasizes substantial residential property sizes with documented adoption patterns in suburban lawn maintenance and commercial landscaping through integration with dealer networks and seasonal equipment demand. The country leverages expansive property development and municipal infrastructure investment to maintain strong market presence at 4.9% CAGR. Regions including Ontario, British Columbia, Alberta, and Quebec showcase broad installations where ride-on mowers integrate with comprehensive landscape maintenance programs and seasonal care systems to optimize property appearance and municipal green-space management. Canadian property owners prioritize durability for climate variations, operational reliability during limited mowing seasons, and dealer service accessibility that reflect regional equipment requirements. The market benefits from municipal fleet modernization programs, golf course maintenance expansion, and provincial infrastructure spending that emphasize equipment upgrades with improved fuel efficiency and emission compliance.
Large suburban developments in Greater Toronto Area, Lower Mainland Vancouver, and Calgary regions drive sustained residential demand through lot sizes exceeding half-acre requiring ride-on capability. Municipal parks departments and provincial facility maintenance contracts create institutional procurement opportunities for commercial-grade zero-turn systems with extended warranties and comprehensive service agreements supporting multi-year replacement cycles.
Market Intelligence Brief:
The UK market demonstrates sophisticated contractor adoption with documented operational effectiveness in council outsourcing and commercial landscape applications through integration with professional service networks and compliance infrastructure. The country leverages commercial landscaping professionalization and environmental regulation advancement to maintain strong equipment demand at 4.5% CAGR. Regions including South East England, Midlands, and Scotland showcase professional installations where ride-on mowers integrate with comprehensive grounds maintenance contracts and fleet management systems to optimize service delivery and client satisfaction. British landscape contractors prioritize operational efficiency, low-emission compliance, and comprehensive service support, creating demand for commercial-grade equipment with advanced features including hour meters and emission certification.
Local authority grounds maintenance outsourcing and facilities management growth drive sustained equipment demand through professional contractors managing parks, schools, and public spaces. Urban low-emission zones and noise restrictions accelerate battery-electric adoption in London boroughs and metropolitan areas, while countryside estate management maintains demand for gasoline-powered systems with extended range capability.
Strategic Market Indicators:
France demonstrates consistent market presence at 4.3% CAGR through sports turf maintenance expansion, particularly ahead of major international sporting events requiring premium field conditions and municipality facility upgrades including stadium grounds and training complex maintenance. Major cities hosting Rugby World Cup venues and Olympic facilities require professional-grade mowing equipment for natural grass pitch maintenance meeting international standards. Local government sports facility investment and private sports complex development drive substantial equipment procurement for specialized turf care, while regional landscape contractors serve commercial property management and public space maintenance. Environmental incentive programs support landscaping fleet modernization toward lower-emission equipment meeting air quality objectives in urban centers.
Sports federation facility standards and professional pitch maintenance requirements drive sustained demand for precision cutting equipment capable of achieving consistent surface quality. Municipal stadium operations and training ground maintenance create recurring equipment replacement cycles aligned with facility upgrade programs and turf renovation schedules.
Performance Metrics:
Germany maintains steady expansion at 4.0% CAGR through high residential garden ownership rates, commercial landscaping sector strength, and growing preference for battery-powered equipment under emission regulations across major states. German homeowners with substantial garden properties in suburban and rural areas drive consumer demand for quality ride-on equipment, while professional landscape companies emphasize productivity through zero-turn fleet investments meeting stringent service quality standards. Municipal environmental regulations increasingly favor battery-electric equipment in urban maintenance operations, creating incentives for emission-free mower adoption in parks, public facilities, and noise-sensitive residential areas. Domestic equipment standards emphasizing safety, durability, and emission compliance shape product specifications, while comprehensive dealer networks provide service coverage and parts availability supporting long equipment lifecycles.
Garden tradition in German suburban culture and rural property ownership patterns create sustained residential demand, while commercial landscaping professionalization drives fleet standardization toward productivity-optimized zero-turn systems. Environmental consciousness and regulatory frameworks accelerate battery-electric adoption despite higher upfront costs, supported by municipal procurement preferences and environmental subsidy programs.
Market Characteristics:
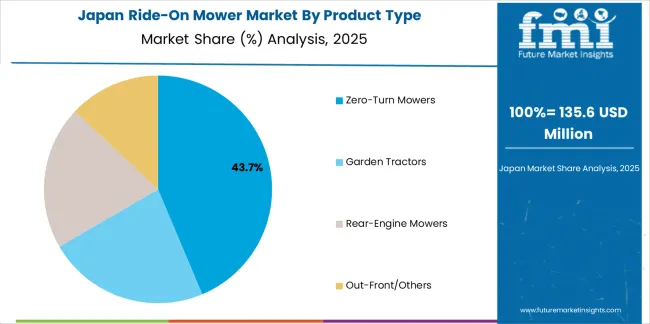
Japan demonstrates specialized market development at 3.8% CAGR characterized by compact zero-turn demand for dense landscape applications and premium segment technology preferences that emphasize hydrostatic transmission quality, telematic connectivity, and comprehensive control systems. The Japanese market focuses on space-efficient equipment suitable for smaller residential properties and specialized commercial applications requiring precision maneuvering in constrained areas including residential gardens, small parks, and facility grounds with limited access. Premium positioning reflects technology sophistication, operational refinement, and comprehensive dealer support that align with Japanese quality expectations and equipment longevity requirements. The market benefits from domestic manufacturers including Kubota and Honda maintaining strong technology development capabilities, while international premium brands appeal to discerning residential users and professional contractors requiring advanced features.
Market Development Factors:
The USA market emphasizes extensive residential large-lot development with documented adoption patterns in suburban homeowner segment and commercial landscape contractor fleets through integration with established dealer networks and seasonal demand patterns. The country demonstrates steady growth at 3.6% CAGR driven by ongoing suburban expansion, commercial landscaping industry maturity, and gradual electrification in noise-sensitive communities that support equipment upgrades. American property owners prioritize cutting performance with ride-on mowers delivering efficient coverage through proven mechanical design and comprehensive dealer service network capabilities. Equipment distribution channels include major retailers, specialty outdoor power equipment dealers, and direct manufacturer relationships that support both residential consumer and commercial contractor segments.
Suburban development patterns with average lot sizes supporting ride-on mower justification drive sustained residential demand across Sun Belt growth regions and established Northern markets. Commercial landscape contractors maintain substantial fleet investments with equipment replacement cycles driven by utilization intensity and competitive service delivery requirements.
Strategic Development Indicators:
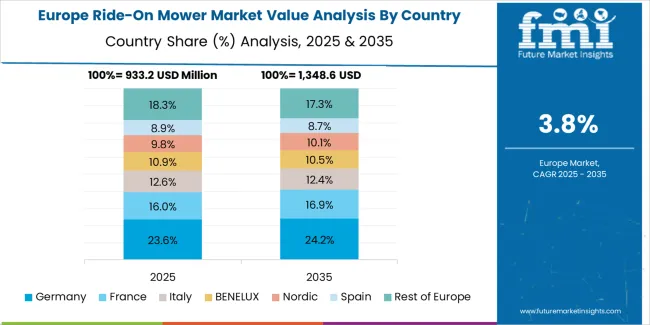
The ride-on mower market in Europe is projected to grow from USD 1.2 billion in 2025 to USD 1.9 billion by 2035, registering a CAGR of approximately 4.6% over the forecast period. Germany is expected to maintain its leadership position with a 24.0% market share in 2025, moderating slightly to 23.5% by 2035, supported by high residential garden ownership and commercial landscaping sector strength driving sustained equipment demand.
United Kingdom follows with a 18.0% share in 2025, projected to reach 17.5% by 2035, influenced by council budget dynamics yet maintaining steady contractor adoption through grounds maintenance outsourcing growth. France holds a 16.0% share in 2025, increasing to 16.5% by 2035 driven by stadium and sports turf facility upgrades ahead of international sporting events. Italy commands a 14.0% share maintaining stability through 2035 aided by villa property maintenance and commercial landscape development. Spain accounts for 10.0% in 2025, rising to 10.5% by 2035 supported by golf course expansion and resort property management. The Nordic countries collectively hold 8.0% in 2025, expanding to 8.5% by 2035 with strong municipal sustainability programs favoring battery-electric fleet adoption. Rest of Europe is anticipated to moderate from 10.0% to 9.5% by 2035, as core markets capture electrification-driven value growth and standardization benefits.
Japan demonstrates specialized market development characterized by compact zero-turn preference for dense residential landscapes and premium segment technology sophistication that emphasizes hydrostatic transmission refinement, telematic connectivity, and comprehensive quality control systems. The Japanese market focuses on space-efficient mowing equipment suitable for smaller suburban properties and facility grounds requiring precision maneuvering in constrained spaces including residential gardens and commercial facility perimeters with limited operational areas. The market benefits from domestic manufacturers including Kubota Corporation and Honda Motor Co., Ltd. maintaining strong engineering capabilities and comprehensive dealer networks, while international premium brands including Deere & Company appeal to technology-focused users requiring advanced control features and connectivity options.
Market Development Factors:
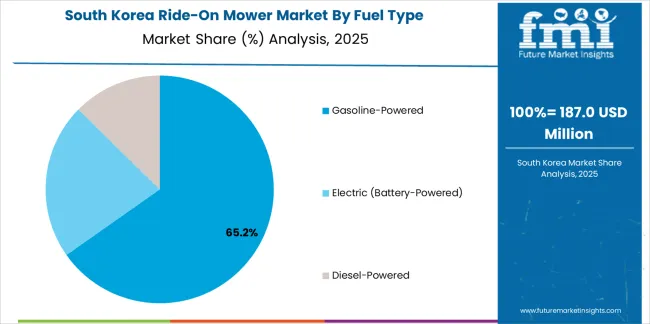
South Korea demonstrates emerging market characteristics focused on premium residential developments and technology-forward equipment preferences reflecting the country's emphasis on innovation and quality. The Korean market emphasizes advanced residential complexes and villa properties requiring professional-quality lawn maintenance with sophisticated equipment specifications including electronic controls, emission compliance, and operational efficiency. Korean property owners and landscape service providers prioritize technology integration, brand reputation, and comprehensive warranty programs that reflect consumer preferences for premium products and manufacturer support. The market benefits from growing suburban development patterns outside major metropolitan areas creating larger residential properties suitable for ride-on mower applications, while golf course operations and resort property management drive commercial segment demand.
Strategic Development Indicators:
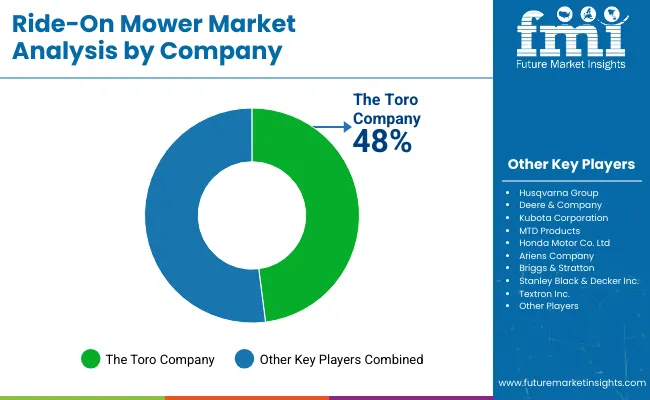
The Ride-On Mower market operates with moderate concentration, featuring approximately 30-40 meaningful participants, where leading companies control roughly 40-45% of the global market share through established dealer relationships and comprehensive equipment portfolios. Competition emphasizes advanced maneuverability capabilities, durability engineering, and dealer service network quality rather than price-based rivalry. Tier 1 companies including Deere & Company, Husqvarna Group, and The Toro Company collectively command approximately 35-40% market share through their comprehensive ride-on mower product lines and extensive global distribution presence.
Market Leaders encompass Deere & Company, Husqvarna Group, and The Toro Company, which maintain competitive advantages through extensive turf care expertise, global dealer distribution networks, and comprehensive product line breadth that create customer brand loyalty and support premium pricing. These companies leverage decades of outdoor power equipment experience and ongoing engineering investments to develop advanced zero-turn systems with hydrostatic transmission refinement and connectivity features.
Technology Innovators include Kubota Corporation, MTD Products, and Honda Motor Co., Ltd., which compete through focused battery-electric technology development and innovative transmission interfaces that appeal to commercial contractors seeking advanced productivity capabilities and environmental compliance improvements. These companies differentiate through rapid electrification cycles and specialized commercial application focus.
Regional Specialists feature companies with specific market focus and specialized applications, including battery-electric systems, professional-grade commercial mowers, and integrated fleet management solutions. Market dynamics favor participants that combine reliable mechanical designs with advanced control systems, including telematic connectivity and predictive maintenance monitoring features. Competitive pressure intensifies as traditional construction equipment manufacturers and new electric-only brands expand into ride-on mower systems.
| Item | Value |
|---|---|
| Quantitative Units | USD 4.0 billion |
| Product Type | Zero-Turn Mowers, Garden Tractors, Rear-Engine Mowers, Out-Front/Others |
| Fuel Type | Gasoline-Powered, Electric (Battery-Powered), Diesel-Powered |
| Blade Type | Rotary Blades, Mulching Blades, Cylindrical/Reel Blades |
| Regions Covered | North America, Europe, Asia Pacific, Latin America, Africa, Middle East |
| Countries Covered | United States, Canada, Australia, United Kingdom, France, Germany, Japan, and 25+ additional countries |
| Key Companies Profiled | Deere & Company, Husqvarna Group, The Toro Company, Kubota Corporation, MTD Products, Honda Motor Co., Ltd., Ariens Company, Briggs & Stratton, Stanley Black & Decker Inc., Textron Inc. |
| Additional Attributes | Dollar sales by product type, fuel type, and blade type categories, regional adoption trends across North America, Europe, and Asia Pacific, competitive landscape with equipment manufacturers and outdoor power equipment suppliers, property owner and contractor preferences for equipment maneuverability and operational efficiency, integration with fleet management platforms and telematics systems, innovations in battery-electric configurations and zero-turn capabilities, and development of low-emission solutions with enhanced productivity and turf care optimization capabilities. |
The global ride-on mower market is estimated to be valued at USD 4.0 billion in 2025.
The market size for the ride-on mower market is projected to reach USD 6.2 billion by 2035.
The ride-on mower market is expected to grow at a 4.5% CAGR between 2025 and 2035.
The key product types in ride-on mower market are zero-turn mowers, garden tractors, rear-engine mowers and out-front/others.
In terms of fuel type, gasoline-powered segment to command 63.0% share in the ride-on mower market in 2025.


Full Research Suite comprises of:
Market outlook & trends analysis
Interviews & case studies
Strategic recommendations
Vendor profiles & capabilities analysis
5-year forecasts
8 regions and 60+ country-level data splits
Market segment data splits
12 months of continuous data updates
DELIVERED AS:
PDF EXCEL ONLINE
Fairway Mowers Market
Robotic Lawn Mower Market Size and Share Forecast Outlook 2025 to 2035
Powered Lawn Mowers Market Analysis - Size, Share & Forecast 2025 to 2035
Riding Multi-Purpose Lawn Mower Market Size and Share Forecast Outlook 2025 to 2035

Thank you!
You will receive an email from our Business Development Manager. Please be sure to check your SPAM/JUNK folder too.
Chat With
MaRIA