Scarfing Inserts Market Size, Share, and Forecast Outlook 2025 to 2035

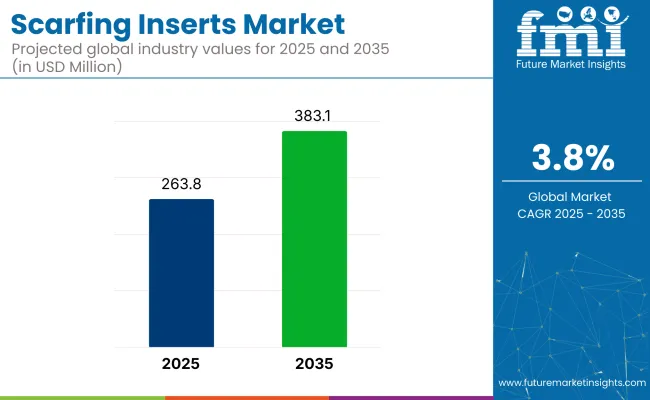
The scarfing inserts market is projected to grow from USD 263.8 million in 2025 to USD 383.1 million by 2035, registering a CAGR of 3.8% during the forecast period. This moderate growth is expected to be driven by consistent demand from the steel manufacturing and metal processing industries.
Quick Stats in Scarfing Inserts Market

  • Market Value (2025): USD 263.8 million
  • Forecast Value (2035): USD 383.1 million
  • Forecast CAGR: 3.8%
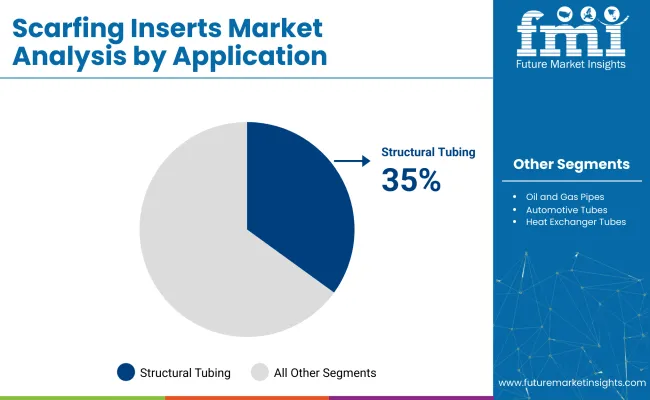
  • Top Application Segment: Structural Tubing (35% market share in 2025)
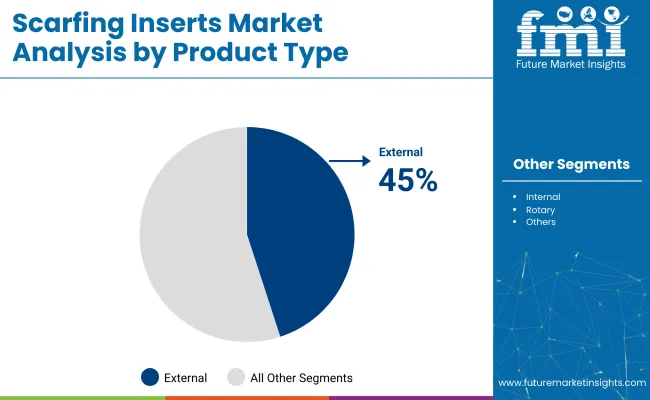
  • Leading Product Type: External (45% market share in 2025)
  • Key Growth Country: India (4.5% CAGR)

Scarfing Inserts Market

Attribute Detail
Market Size (2025) USD 263.8 million
Market Size (2035) USD 383.1 million
CAGR (2025 to 2035) 3.8%

As of 2025, the market accounts for a small but essential share across several industrial equipment sectors. Within the global metal cutting tools market, it contributes around 2-3%, as these inserts are used in specialized surface machining processes during steel production. In the steel manufacturing equipment market, the share is higher at approximately 4-6%, since scarfing is a routine part of defect removal in billets and slabs.

Within the industrial tooling market, scarfing inserts represent about 1-2%, owing to their limited use outside the metallurgical segment. In the surface preparation equipment market, the contribution is close to 2-3%, given their role in achieving defect-free finishes. In the metallurgical equipment market, scarfing inserts account for roughly 3-4%, supporting continuous casting and finishing operations.

The market is a critical segment within the steel and metal processing industry, enabling high-precision surface defect removal during hot and cold rolling operations. Demand is tightly correlated with global steel production, particularly in automotive, construction, and pipeline manufacturing. The value chain begins with carbide powder suppliers and extends through precision tooling manufacturers, OEMs, and industrial distributors.

Key growth drivers include rising investments in high-grade steel infrastructure and increased adoption of automated scarfing systems in integrated steel mills. Market dynamics are shifting as end-users demand longer tool life, higher heat resistance, and reduced downtime.

Innovation is centered around multi-edge geometries and advanced coatings, enhancing productivity and material yield. Strategic partnerships between insert manufacturers and steel producers are accelerating, with Asia Pacific emerging as both the largest production hub and fastest-growing consumption market.

Analyzing Scarfing Inserts Market by Top Investment Segments

Tungsten carbide is projected to dominate the material segment with an 80% share in 2025, driven by its superior hardness and durability. External scarfing inserts are set to lead the product type segment with a 45% share.

Tungsten Carbide to Dominate the Material Segment with 80% Market Share.

Tungsten carbide is projected to account for 80% of the material segment by 2025, thanks to its exceptional wear resistance and longevity in high-temperature environments.

  • This material has been widely used in scarfing applications where steel pipes and tubes are surface-prepared during continuous manufacturing processes.
  • Its resistance to deformation under extreme friction has made it ideal for use in heavy-duty industrial settings. Manufacturers increasingly rely on tungsten carbide inserts for consistent performance, extended tooling life, and reduced downtime, particularly in high-speed production lines.

External Scarfing Inserts to Lead Product Type Segment with 45% Market Share

External scarfing inserts are anticipated to lead the product type segment, capturing 45% of the market by 2025. These tools have been preferred for their ability to cleanly remove weld beads from the outer surface of pipes and tubes.
  • External variants are essential in manufacturing mills where outer weld removal is required to meet surface finish standards for tubing applications.
  • Strong demand from the automotive and construction industries has supported the segment’s expansion. These inserts offer fast replacement, high machining efficiency, and reduced scrap rates, enhancing overall production quality and consistency.

Scarfing Inserts Market Analysis By Product Type

Structural Tubing to Dominate Application Segment with 35% Market Share

Structural tubing applications are expected to hold 35% of the scarfing inserts market in 2025, driven by steady demand from the infrastructure and transportation sectors.
  • Scarfing inserts have been critical in preparing the surface of structural tubing to meet strength, appearance, and weld-quality standards.
  • The growing use of tubular structures in bridges, buildings, and industrial equipment has spurred the need for precision scarfing. Manufacturers rely on high-performance inserts to improve throughput and reduce finishing operations, making structural tubing a key driver of market demand.

Scarfing Inserts Market Analysis By Application

Standard Fit to Lead Category Segment with 50% Market Share

Standard fit scarfing inserts are projected to dominate the category segment, accounting for 50% of the market by 2025. These inserts are designed for compatibility with a wide range of scarfing heads and tool holders.

  • Manufacturers prefer standard fit tools for their interchangeability, reducing lead times and inventory costs across operations.
  • As automation and lean manufacturing practices increase, standardization has become crucial for operational efficiency. This segment's growth is bolstered by consistent adoption in steel mills, particularly those producing tubing for the automotive, construction, and energy sectors.

Top Scarfing Inserts Market Dynamics

The market is expanding due to rising demand in the steel and metal processing industries. These inserts are essential for surface defect removal during hot and cold rolling processes. As steelmakers aim to improve product quality and reduce scrap rates, there is growing adoption of advanced insert materials and geometries tailored for high-speed scarfing operations.

High Demand from Steel Mills and Pipe Manufacturing Units

Scarfing inserts are widely used in continuous casting lines, tube mills, and strip processing facilities to remove surface defects such as cracks, scales, and inclusions. They help ensure a clean, uniform surface finish before further rolling or welding operations. Steel producers rely on these inserts to maintain product quality and meet customer specifications.

  • Used in continuous casting and pipe production for surface defect removal.
  • Help improve surface finish and reduce rework in steel and alloy processing.
  • Essential for quality control in flat and long product manufacturing.

Increasing Use of Carbide and Ceramic-Based Insert Materials

Manufacturers are offering inserts made from tungsten carbide, ceramic composites, and coated alloys to withstand high temperatures and abrasive conditions. These materials deliver better wear resistance, longer tool life, and improved heat dissipation. Inserts with precision-ground edges and enhanced chip evacuation are being developed for cleaner cuts and faster operation.
  • Tungsten carbide and ceramics improve wear resistance and tool longevity.
  • Precision-ground inserts provide smoother cuts and better defect removal.
  • Heat-resistant materials allow stable performance at elevated temperatures.

Top Countries Manufacturing, Utilizing, Distributing, and Driving Demand for Scarfing Inserts

Country Wise Analysis Of Scarfing Inserts Market

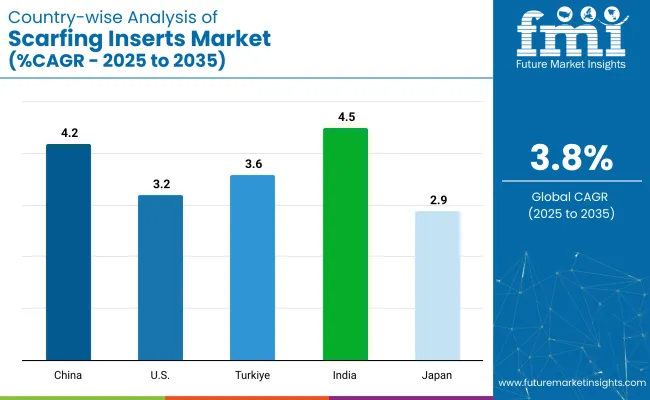
Countries CAGR (2025 to 2035)
China 4.2%
USA 3.2%
India 4.5%
Turkiye 3.6%
Japan 2.9%

India’s momentum is being driven by rising steel production, the growth of integrated steel plants, and increasing demand for billet and slab surface conditioning. China is scaling scarfing insert use through continuous casting optimization and domestic manufacturing automation. In contrast, developed economies such as the United States (3.2%), Türkiye (3.6%), and Japan (2.9%) are expanding steadily at 0.76-0.95x rates.

The USA focuses on high-durability inserts for specialty alloy production and value-added steel. Türkiye emphasizes cost efficiency and import substitution in regional mills. Japan prioritizes clean surface finish and thermal resistance in electric arc furnace operations. As global infrastructure and industrial output grow, both high-volume and high-precision markets are reshaping the scarfing inserts landscape.

The report provides insights across 40+ countries. The five below are highlighted for their strategic influence and growth trajectory.

In-depth Analysis of Scarfing Inserts Market in India

Indian market is projected to grow at a CAGR of 4.5% through 2035. Growth is fueled by the rapid expansion of long product manufacturing, including rebar, wire rod, and structural sections. Integrated steel plants are adopting scarfing systems to meet export-grade quality standards.

Surface defect control in billet and bloom production is a primary driver. Domestic toolmakers are scaling up insert manufacturing to reduce dependence on imports. Usage in thermal cutting applications across public-sector mills is also increasing. India’s position as a BRICS nation supports internal tooling demand and regional export potential.

  • Surface conditioning demand is growing in billet and bloom casting
  • Local insert manufacturing scaling under import reduction targets
  • Public-sector mills modernizing scarfing systems for defect removal

Sales Analysis of Scarfing Inserts Market in China

China is expected to grow at a CAGR of 4.2% between 2025 and 2035. Continuous casting efficiency and high-speed steel output are driving the adoption of advanced insert designs. State-owned enterprises are upgrading scarfing lines to reduce surface rejection rates.

Local tool producers are investing in hard carbide formulations with long heat resistance. Large mills in Hebei and Jiangsu provinces are leading in high-temperature billet processing. Market expansion is supported by both internal infrastructure projects and overseas billet exports.

  • Insert upgrades reducing surface rejection in steel plants
  • Domestic producers are optimizing carbide blends for longer life
  • Growth driven by infrastructure-linked billet production targets

Demand Outlook for Scarfing Inserts Market in the United States

The USA market is projected to grow at a CAGR of 3.2% through 2035. Demand is concentrated in electric arc furnace (EAF) facilities and mini-mills producing specialty alloys. Inserts are used in scarfing carbon and stainless steel slabs for automotive and aerospace applications.

USA-based suppliers are offering precision-engineered inserts with extended wear life and thermal resistance. Retrofitting of scarfing equipment in Midwest and Southeast facilities is underway. Growth is supported by the reshoring of metals production and federal infrastructure stimulus plans.

  • Inserts used in slab conditioning for automotive-grade steel
  • Retrofitted scarfing systems are increasing insert replacement volume
  • Specialty alloy segments driving demand for high-performance tools

Opportunity Analysis of Scarfing Inserts Market in Türkiye

Türkiye’s market is forecast to expand at a CAGR of 3.6% during the forecast period. Regional steel mills are adopting scarfing operations to enhance product uniformity and reduce downstream surface defects. Demand is rising in flat and long product lines, especially in export-oriented mills.

Local importers are offering cost-competitive carbide inserts sourced from East Asia. Turkish producers are focusing on entry-level surface preparation to meet international quality benchmarks. Growth is shaped by regional steel consolidation and trade-driven production goals.

  • Export-focused steel mills adopting surface conditioning tools
  • Entry-level inserts used in cost-sensitive mill operations
  • Growth is tied to trade volume and regional competitiveness

Growth Forecast for Scarfing Inserts Market in Japan

Japan is projected to grow at a CAGR of 2.9% from 2025 to 2035. High-quality output requirements from the automotive and electronics sectors are driving precision in billet surface processing. Inserts are used in slab conditioning within electric arc furnace (EAF) facilities.

Domestic toolmakers are focused on thermal stability, reduced chipping, and longer operating cycles. Usage is concentrated in coastal steel plants serving specialty downstream sectors. Japan’s market remains steady, driven by value-added applications rather than volume expansion.

  • Precision inserts used in EAF-based specialty steel plants
  • Toolmakers are prioritizing thermal resistance and cycle life
  • Demand supported by value-added slab and billet production

Leading Scarfing Inserts Manufacturers

The industry is moderately consolidated, led by a few dominant players with global manufacturing and distribution capabilities. Kent Corporation is a prominent name offering high-performance scarfing solutions for steel tube and pipe production lines. CERATIZIT Group provides premium-grade carbide scarfing inserts known for their durability and precision in hot-rolled steel applications.

Widia specializes in technologically advanced wear-resistant inserts, widely adopted in heavy industrial sectors. Hunan Estool Co., Ltd. and OMCD Group are emerging as significant contributors, focusing on cost-effective alternatives and expanding presence in Asian and European markets. Innovation in insert geometry and coatings continues to enhance cutting speed, reduce downtime, and increase overall efficiency in metalworking operations.

Recent Scarfing Inserts Industry News

In February 2025, Norton Abrasives India unveiled a new sustainable approach to abrasive tooling for scarfing operations, spotlighting diamond and CBN abrasives that enhance surface finish quality while reducing material waste and improving carbon efficiency in steel, automotive, and foundry applications.

Leading Players in Scarfing Inserts Market

  • Kent Corporation
  • CERATIZIT Group
  • Hunan Estool Co., Ltd.
  • OMCD Group
  • Widia

Report Coverage and Scope Summary

Report Attributes Details
Market Size (2025) USD 263.8 million
Projected Market Size (2035) USD 383.1 million
CAGR (2025 to 2035) 3.8%
Base Year for Estimation 2024
Historical Period 2020 to 2024
Projections Period 2025 to 2035
Quantitative Units USD million for market value
Material Types Analyzed (Segment 1) Tungsten Carbide, Ceramic, Coated Carbide, Other Specialized Materials
Product Types Analyzed (Segment 2) External, Internal, Rotary, Stationary, Chamfer, Others
Applications Analyzed (Segment 3) Oil & Gas Pipes, Automotive Tubes, Construction Tubes, Heat Exchanger Tubes, Structural Tubing, Appliance Tubes
Categories Analyzed (Segment 4) Standard Fit, Custom Fit, Universal Fit
Regions Covered North America, Latin America, Eastern Europe, Western Europe, South Asia & Pacific, East Asia, Middle East & Africa
Countries Covered United States, Canada, Germany, United Kingdom, France, Japan, China, India, South Korea, Brazil
Key Players Kent Corporation, CERATIZIT Group, Hunan Estool Co., Ltd., OMCD Group, Widia
Additional Attributes Dollar sales by product and application, rising demand in the automotive and pipe industries, shift toward coated materials, and advancements in high-durability insert design.

Key Segments

By Material Type:

The market is segmented by material type into tungsten carbide, ceramic, coated carbide, and other specialized materials.

By Product Type:

Based on product type, scarfing inserts are categorized as external, internal, rotary, stationary, chamfer, and others.

By Application:

Key applications include oil and gas pipes, automotive tubes, construction tubes, heat exchanger tubes, structural tubing and appliance tubes.

By Category:

By category, the market includes standard fit, custom fit, and universal fit scarfing inserts.

By Region:

Geographically, the market spans North America, Latin America, Eastern Europe, Western Europe, South Asia & Pacific, East Asia, and the Middle East & Africa.

Table of Content

  1. Executive Summary
    • Global Market Outlook
    • Demand-side Trends
    • Supply-side Trends
    • Technology Roadmap Analysis
    • Analysis and Recommendations
  2. Market Overview
    • Market Coverage/Taxonomy
    • Market Definition/Scope/Limitations
  3. Market Background
    • Market Dynamics
      • Drivers
      • Restraints
      • Opportunity
      • Trends
    • Scenario Forecast
      • Demand in Optimistic Scenario
      • Demand in Likely Scenario
      • Demand in Conservative Scenario
    • Opportunity Map Analysis
    • Product Life Cycle Analysis
    • Supply Chain Analysis
      • Supply Side Participants and their Roles
        • Producers
        • Mid-Level Participants (Traders/ Agents/ Brokers)
        • Wholesalers and Distributors
      • Value Added and Value Created at Node in the Supply Chain
      • List of Raw Material Suppliers
      • List of Existing and Potential Buyer’s
    • Investment Feasibility Matrix
    • Value Chain Analysis
      • Profit Margin Analysis
      • Wholesalers and Distributors
      • Retailers
    • PESTLE and Porter’s Analysis
    • Regulatory Landscape
      • By Key Regions
      • By Key Countries
    • Regional Parent Market Outlook
    • Production and Consumption Statistics
    • Import and Export Statistics
  4. Global Market Analysis 2020 to 2024 and Forecast, 2025 to 2035
    • Historical Market Size Value (USD Million) & Volume (Units) Analysis, 2020 to 2024
    • Current and Future Market Size Value (USD Million) & Volume (Units) Projections, 2025 to 2035
      • Y-o-Y Growth Trend Analysis
      • Absolute $ Opportunity Analysis
  5. Global Market Pricing Analysis 2020 to 2024 and Forecast 2025 to 2035
  6. Global Market Analysis 2020 to 2024 and Forecast 2025 to 2035, By Material Type
    • Introduction/Key Findings
    • Historical Market Size Value (USD Million) & Volume (Units) Analysis By Material Type, 2020 to 2024
    • Current and Future Market Size Value (USD Million) & Volume (Units) Analysis and Forecast By Material Type, 2025 to 2035
      • Tungsten Carbide
      • Ceramic
      • Coated Carbide
      • Others
    • Y-o-Y Growth Trend Analysis By Material Type, 2020 to 2024
    • Absolute $ Opportunity Analysis By Material Type, 2025 to 2035
  7. Global Market Analysis 2020 to 2024 and Forecast 2025 to 2035, By Product Type
    • Introduction/Key Findings
    • Historical Market Size Value (USD Million) & Volume (Units) Analysis By Product Type, 2020 to 2024
    • Current and Future Market Size Value (USD Million) & Volume (Units) Analysis and Forecast By Product Type, 2025 to 2035
      • External
      • Internal
      • Rotary
      • Stationary
      • Chamfer
      • Others
    • Y-o-Y Growth Trend Analysis By Product Type, 2020 to 2024
    • Absolute $ Opportunity Analysis By Product Type, 2025 to 2035
  8. Global Market Analysis 2020 to 2024 and Forecast 2025 to 2035, By Application
    • Introduction/Key Findings
    • Historical Market Size Value (USD Million) & Volume (Units) Analysis By Application, 2020 to 2024
    • Current and Future Market Size Value (USD Million) & Volume (Units) Analysis and Forecast By Application, 2025 to 2035
      • Oil and Gas Pipes
      • Automotive Tubes
      • Construction Tubes
      • Heat Exchanger Tubes
      • Appliance Tubes
    • Y-o-Y Growth Trend Analysis By Application, 2020 to 2024
    • Absolute $ Opportunity Analysis By Application, 2025 to 2035
  9. Global Market Analysis 2020 to 2024 and Forecast 2025 to 2035, By Category
    • Introduction/Key Findings
    • Historical Market Size Value (USD Million) & Volume (Units) Analysis By Category, 2020 to 2024
    • Current and Future Market Size Value (USD Million) & Volume (Units) Analysis and Forecast By Category, 2025 to 2035
      • Standard Fit
      • Custom Fit
      • Universal Fit
    • Y-o-Y Growth Trend Analysis By Category, 2020 to 2024
    • Absolute $ Opportunity Analysis By Category, 2025 to 2035
  10. Global Market Analysis 2020 to 2024 and Forecast 2025 to 2035, By Region
    • Introduction
    • Historical Market Size Value (USD Million) & Volume (Units) Analysis By Region, 2020 to 2024
    • Current Market Size Value (USD Million) & Volume (Units) Analysis and Forecast By Region, 2025 to 2035
      • North America
      • Latin America
      • Western Europe
      • Eastern Europe
      • East Asia
      • South Asia & Pacific
      • Middle East and Africa
    • Market Attractiveness Analysis By Region
  11. North America Market Analysis 2020 to 2024 and Forecast 2025 to 2035, By Country
    • Historical Market Size Value (USD Million) & Volume (Units) Trend Analysis By Market Taxonomy, 2020 to 2024
    • Market Size Value (USD Million) & Volume (Units) Forecast By Market Taxonomy, 2025 to 2035
      • By Country
        • USA
        • Canada
        • Mexico
      • By Material Type
      • By Product Type
      • By Application
      • By Category
    • Market Attractiveness Analysis
      • By Country
      • By Material Type
      • By Product Type
      • By Application
      • By Category
    • Key Takeaways
  12. Latin America Market Analysis 2020 to 2024 and Forecast 2025 to 2035, By Country
    • Historical Market Size Value (USD Million) & Volume (Units) Trend Analysis By Market Taxonomy, 2020 to 2024
    • Market Size Value (USD Million) & Volume (Units) Forecast By Market Taxonomy, 2025 to 2035
      • By Country
        • Brazil
        • Argentina
        • Rest of LATAM
      • By Material Type
      • By Product Type
      • By Application
      • By Category
    • Market Attractiveness Analysis
      • By Country
      • By Material Type
      • By Product Type
      • By Application
      • By Category
    • Key Takeaways
  13. Western Europe Market Analysis 2020 to 2024 and Forecast 2025 to 2035, By Country
    • Historical Market Size Value (USD Million) & Volume (Units) Trend Analysis By Market Taxonomy, 2020 to 2024
    • Market Size Value (USD Million) & Volume (Units) Forecast By Market Taxonomy, 2025 to 2035
      • By Country
        • Germany
        • Italy
        • France
        • UK
        • Spain
        • BENELUX
        • Nordic
        • Rest of W.Europe
      • By Material Type
      • By Product Type
      • By Application
      • By Category
    • Market Attractiveness Analysis
      • By Country
      • By Material Type
      • By Product Type
      • By Application
      • By Category
    • Key Takeaways
  14. Eastern Europe Market Analysis 2020 to 2024 and Forecast 2025 to 2035, By Country
    • Historical Market Size Value (USD Million) & Volume (Units) Trend Analysis By Market Taxonomy, 2020 to 2024
    • Market Size Value (USD Million) & Volume (Units) Forecast By Market Taxonomy, 2025 to 2035
      • By Country
        • Russia
        • Hungary
        • Poland
        • Balkan & Baltics
        • Rest of E. Europe
      • By Material Type
      • By Product Type
      • By Application
      • By Category
    • Market Attractiveness Analysis
      • By Country
      • By Material Type
      • By Product Type
      • By Application
      • By Category
    • Key Takeaways
  15. East Asia Market Analysis 2020 to 2024 and Forecast 2025 to 2035, By Country
    • Historical Market Size Value (USD Million) & Volume (Units) Trend Analysis By Market Taxonomy, 2020 to 2024
    • Market Size Value (USD Million) & Volume (Units) Forecast By Market Taxonomy, 2025 to 2035
      • By Country
        • China
        • Japan
        • South Korea
      • By Material Type
      • By Product Type
      • By Application
      • By Category
    • Market Attractiveness Analysis
      • By Country
      • By Material Type
      • By Product Type
      • By Application
      • By Category
    • Key Takeaways
  16. South Asia & Pacific Market Analysis 2020 to 2024 and Forecast 2025 to 2035, By Country
    • Historical Market Size Value (USD Million) & Volume (Units) Trend Analysis By Market Taxonomy, 2020 to 2024
    • Market Size Value (USD Million) & Volume (Units) Forecast By Market Taxonomy, 2025 to 2035
      • By Country
        • India
        • Australia & New Zealand
        • ASEAN
        • Rest of SAP
      • By Material Type
      • By Product Type
      • By Application
      • By Category
    • Market Attractiveness Analysis
      • By Country
      • By Material Type
      • By Product Type
      • By Application
      • By Category
    • Key Takeaways
  17. Middle East and Africa Market Analysis 2020 to 2024 and Forecast 2025 to 2035, By Country
    • Historical Market Size Value (USD Million) & Volume (Units) Trend Analysis By Market Taxonomy, 2020 to 2024
    • Market Size Value (USD Million) & Volume (Units) Forecast By Market Taxonomy, 2025 to 2035
      • By Country
        • GCC Countries
        • Northern Africa
        • South Africa
        • Turkiye
        • Rest of MEA
      • By Material Type
      • By Product Type
      • By Application
      • By Category
    • Market Attractiveness Analysis
      • By Country
      • By Material Type
      • By Product Type
      • By Application
      • By Category
    • Key Takeaways
  18. Key Countries Market Analysis
    • USA
      • Pricing Analysis
      • Market Share Analysis, 2024
        • By Material Type
        • By Product Type
        • By Application
        • By Category
    • Canada
      • Pricing Analysis
      • Market Share Analysis, 2024
        • By Material Type
        • By Product Type
        • By Application
        • By Category
    • Brazil
      • Pricing Analysis
      • Market Share Analysis, 2024
        • By Material Type
        • By Product Type
        • By Application
        • By Category
    • Mexico
      • Pricing Analysis
      • Market Share Analysis, 2024
        • By Material Type
        • By Product Type
        • By Application
        • By Category
    • Argentina
      • Pricing Analysis
      • Market Share Analysis, 2024
        • By Material Type
        • By Product Type
        • By Application
        • By Category
  19. Market Structure Analysis
    • Competition Dashboard
    • Competition Benchmarking
    • Market Share Analysis of Top Players
      • By Regional
      • By Material Type
      • By Product Type
      • By Application
      • By Category
  20. Competition Analysis
    • Competition Deep Dive
      • Kent Corporation
        • Overview
        • Product Portfolio
        • Profitability by Market Segments (Product/Age /Sales Channel/Region)
        • Sales Footprint
        • Strategy Overview
          • Marketing Strategy
          • Product Strategy
          • Channel Strategy
      • CERATIZIT Group
        • Overview
        • Product Portfolio
        • Profitability by Market Segments (Product/Age /Sales Channel/Region)
        • Sales Footprint
        • Strategy Overview
          • Marketing Strategy
          • Product Strategy
          • Channel Strategy
      • Hunan Estool Co.,Ltd.
        • Overview
        • Product Portfolio
        • Profitability by Market Segments (Product/Age /Sales Channel/Region)
        • Sales Footprint
        • Strategy Overview
          • Marketing Strategy
          • Product Strategy
          • Channel Strategy
      • OMCD Group
        • Overview
        • Product Portfolio
        • Profitability by Market Segments (Product/Age /Sales Channel/Region)
        • Sales Footprint
        • Strategy Overview
          • Marketing Strategy
          • Product Strategy
          • Channel Strategy
      • Widia
        • Overview
        • Product Portfolio
        • Profitability by Market Segments (Product/Age /Sales Channel/Region)
        • Sales Footprint
        • Strategy Overview
          • Marketing Strategy
          • Product Strategy
          • Channel Strategy
  21. Assumptions & Acronyms Used
  22. Research Methodology

List of Tables

  • Table 1: Global Market Value (USD Million) Forecast by Region, 2020-2035
  • Table 2: Global Market Volume (Units) Forecast by Region, 2020-2035
  • Table 3: Global Market Value (USD Million) Forecast by Material Type, 2020-2035
  • Table 4: Global Market Volume (Units) Forecast by Material Type, 2020-2035
  • Table 5: Global Market Value (USD Million) Forecast by Product Type, 2020-2035
  • Table 6: Global Market Volume (Units) Forecast by Product Type, 2020-2035
  • Table 7: Global Market Value (USD Million) Forecast by Application, 2020-2035
  • Table 8: Global Market Volume (Units) Forecast by Application, 2020-2035
  • Table 9: Global Market Value (USD Million) Forecast by Category, 2020-2035
  • Table 10: Global Market Volume (Units) Forecast by Category, 2020-2035
  • Table 11: North America Market Value (USD Million) Forecast by Country, 2020-2035
  • Table 12: North America Market Volume (Units) Forecast by Country, 2020-2035
  • Table 13: North America Market Value (USD Million) Forecast by Material Type, 2020-2035
  • Table 14: North America Market Volume (Units) Forecast by Material Type, 2020-2035
  • Table 15: North America Market Value (USD Million) Forecast by Product Type, 2020-2035
  • Table 16: North America Market Volume (Units) Forecast by Product Type, 2020-2035
  • Table 17: North America Market Value (USD Million) Forecast by Application, 2020-2035
  • Table 18: North America Market Volume (Units) Forecast by Application, 2020-2035
  • Table 19: North America Market Value (USD Million) Forecast by Category, 2020-2035
  • Table 20: North America Market Volume (Units) Forecast by Category, 2020-2035
  • Table 21: Latin America Market Value (USD Million) Forecast by Country, 2020-2035
  • Table 22: Latin America Market Volume (Units) Forecast by Country, 2020-2035
  • Table 23: Latin America Market Value (USD Million) Forecast by Material Type, 2020-2035
  • Table 24: Latin America Market Volume (Units) Forecast by Material Type, 2020-2035
  • Table 25: Latin America Market Value (USD Million) Forecast by Product Type, 2020-2035
  • Table 26: Latin America Market Volume (Units) Forecast by Product Type, 2020-2035
  • Table 27: Latin America Market Value (USD Million) Forecast by Application, 2020-2035
  • Table 28: Latin America Market Volume (Units) Forecast by Application, 2020-2035
  • Table 29: Latin America Market Value (USD Million) Forecast by Category, 2020-2035
  • Table 30: Latin America Market Volume (Units) Forecast by Category, 2020-2035
  • Table 31: Western Europe Market Value (USD Million) Forecast by Country, 2020-2035
  • Table 32: Western Europe Market Volume (Units) Forecast by Country, 2020-2035
  • Table 33: Western Europe Market Value (USD Million) Forecast by Material Type, 2020-2035
  • Table 34: Western Europe Market Volume (Units) Forecast by Material Type, 2020-2035
  • Table 35: Western Europe Market Value (USD Million) Forecast by Product Type, 2020-2035
  • Table 36: Western Europe Market Volume (Units) Forecast by Product Type, 2020-2035
  • Table 37: Western Europe Market Value (USD Million) Forecast by Application, 2020-2035
  • Table 38: Western Europe Market Volume (Units) Forecast by Application, 2020-2035
  • Table 39: Western Europe Market Value (USD Million) Forecast by Category, 2020-2035
  • Table 40: Western Europe Market Volume (Units) Forecast by Category, 2020-2035
  • Table 41: Eastern Europe Market Value (USD Million) Forecast by Country, 2020-2035
  • Table 42: Eastern Europe Market Volume (Units) Forecast by Country, 2020-2035
  • Table 43: Eastern Europe Market Value (USD Million) Forecast by Material Type, 2020-2035
  • Table 44: Eastern Europe Market Volume (Units) Forecast by Material Type, 2020-2035
  • Table 45: Eastern Europe Market Value (USD Million) Forecast by Product Type, 2020-2035
  • Table 46: Eastern Europe Market Volume (Units) Forecast by Product Type, 2020-2035
  • Table 47: Eastern Europe Market Value (USD Million) Forecast by Application, 2020-2035
  • Table 48: Eastern Europe Market Volume (Units) Forecast by Application, 2020-2035
  • Table 49: Eastern Europe Market Value (USD Million) Forecast by Category, 2020-2035
  • Table 50: Eastern Europe Market Volume (Units) Forecast by Category, 2020-2035
  • Table 51: East Asia Market Value (USD Million) Forecast by Country, 2020-2035
  • Table 52: East Asia Market Volume (Units) Forecast by Country, 2020-2035
  • Table 53: East Asia Market Value (USD Million) Forecast by Material Type, 2020-2035
  • Table 54: East Asia Market Volume (Units) Forecast by Material Type, 2020-2035
  • Table 55: East Asia Market Value (USD Million) Forecast by Product Type, 2020-2035
  • Table 56: East Asia Market Volume (Units) Forecast by Product Type, 2020-2035
  • Table 57: East Asia Market Value (USD Million) Forecast by Application, 2020-2035
  • Table 58: East Asia Market Volume (Units) Forecast by Application, 2020-2035
  • Table 59: East Asia Market Value (USD Million) Forecast by Category, 2020-2035
  • Table 60: East Asia Market Volume (Units) Forecast by Category, 2020-2035
  • Table 61: South Asia & Pacific Market Value (USD Million) Forecast by Country, 2020-2035
  • Table 62: South Asia & Pacific Market Volume (Units) Forecast by Country, 2020-2035
  • Table 63: South Asia & Pacific Market Value (USD Million) Forecast by Material Type, 2020-2035
  • Table 64: South Asia & Pacific Market Volume (Units) Forecast by Material Type, 2020-2035
  • Table 65: South Asia & Pacific Market Value (USD Million) Forecast by Product Type, 2020-2035
  • Table 66: South Asia & Pacific Market Volume (Units) Forecast by Product Type, 2020-2035
  • Table 67: South Asia & Pacific Market Value (USD Million) Forecast by Application, 2020-2035
  • Table 68: South Asia & Pacific Market Volume (Units) Forecast by Application, 2020-2035
  • Table 69: South Asia & Pacific Market Value (USD Million) Forecast by Category, 2020-2035
  • Table 70: South Asia & Pacific Market Volume (Units) Forecast by Category, 2020-2035
  • Table 71: Middle East and Africa Market Value (USD Million) Forecast by Country, 2020-2035
  • Table 72: Middle East and Africa Market Volume (Units) Forecast by Country, 2020-2035
  • Table 73: Middle East and Africa Market Value (USD Million) Forecast by Material Type, 2020-2035
  • Table 74: Middle East and Africa Market Volume (Units) Forecast by Material Type, 2020-2035
  • Table 75: Middle East and Africa Market Value (USD Million) Forecast by Product Type, 2020-2035
  • Table 76: Middle East and Africa Market Volume (Units) Forecast by Product Type, 2020-2035
  • Table 77: Middle East and Africa Market Value (USD Million) Forecast by Application, 2020-2035
  • Table 78: Middle East and Africa Market Volume (Units) Forecast by Application, 2020-2035
  • Table 79: Middle East and Africa Market Value (USD Million) Forecast by Category, 2020-2035
  • Table 80: Middle East and Africa Market Volume (Units) Forecast by Category, 2020-2035

List of Figures

  • Figure 1: Global Market Volume (Units) Forecast 2020-2035
  • Figure 2: Global Market Pricing Analysis
  • Figure 3: Global Market Value (USD Million) Forecast 2020-2035
  • Figure 4: Global Market Value Share and BPS Analysis by Material Type, 2025 and 2035
  • Figure 5: Global Market Y-o-Y Growth Comparison by Material Type, 2025-2035
  • Figure 6: Global Market Attractiveness Analysis by Material Type
  • Figure 7: Global Market Value Share and BPS Analysis by Product Type, 2025 and 2035
  • Figure 8: Global Market Y-o-Y Growth Comparison by Product Type, 2025-2035
  • Figure 9: Global Market Attractiveness Analysis by Product Type
  • Figure 10: Global Market Value Share and BPS Analysis by Application, 2025 and 2035
  • Figure 11: Global Market Y-o-Y Growth Comparison by Application, 2025-2035
  • Figure 12: Global Market Attractiveness Analysis by Application
  • Figure 13: Global Market Value Share and BPS Analysis by Category, 2025 and 2035
  • Figure 14: Global Market Y-o-Y Growth Comparison by Category, 2025-2035
  • Figure 15: Global Market Attractiveness Analysis by Category
  • Figure 16: Global Market Value (USD Million) Share and BPS Analysis by Region, 2025 and 2035
  • Figure 17: Global Market Y-o-Y Growth Comparison by Region, 2025-2035
  • Figure 18: Global Market Attractiveness Analysis by Region
  • Figure 19: North America Market Incremental $ Opportunity, 2025-2035
  • Figure 20: Latin America Market Incremental $ Opportunity, 2025-2035
  • Figure 21: Western Europe Market Incremental $ Opportunity, 2025-2035
  • Figure 22: Eastern Europe Market Incremental $ Opportunity, 2025-2035
  • Figure 23: East Asia Market Incremental $ Opportunity, 2025-2035
  • Figure 24: South Asia & Pacific Market Incremental $ Opportunity, 2025-2035
  • Figure 25: Middle East and Africa Market Incremental $ Opportunity, 2025-2035
  • Figure 26: North America Market Value Share and BPS Analysis by Country, 2025 and 2035
  • Figure 27: North America Market Value Share and BPS Analysis by Material Type, 2025 and 2035
  • Figure 28: North America Market Y-o-Y Growth Comparison by Material Type, 2025-2035
  • Figure 29: North America Market Attractiveness Analysis by Material Type
  • Figure 30: North America Market Value Share and BPS Analysis by Product Type, 2025 and 2035
  • Figure 31: North America Market Y-o-Y Growth Comparison by Product Type, 2025-2035
  • Figure 32: North America Market Attractiveness Analysis by Product Type
  • Figure 33: North America Market Value Share and BPS Analysis by Application, 2025 and 2035
  • Figure 34: North America Market Y-o-Y Growth Comparison by Application, 2025-2035
  • Figure 35: North America Market Attractiveness Analysis by Application
  • Figure 36: North America Market Value Share and BPS Analysis by Category, 2025 and 2035
  • Figure 37: North America Market Y-o-Y Growth Comparison by Category, 2025-2035
  • Figure 38: North America Market Attractiveness Analysis by Category
  • Figure 39: Latin America Market Value Share and BPS Analysis by Country, 2025 and 2035
  • Figure 40: Latin America Market Value Share and BPS Analysis by Material Type, 2025 and 2035
  • Figure 41: Latin America Market Y-o-Y Growth Comparison by Material Type, 2025-2035
  • Figure 42: Latin America Market Attractiveness Analysis by Material Type
  • Figure 43: Latin America Market Value Share and BPS Analysis by Product Type, 2025 and 2035
  • Figure 44: Latin America Market Y-o-Y Growth Comparison by Product Type, 2025-2035
  • Figure 45: Latin America Market Attractiveness Analysis by Product Type
  • Figure 46: Latin America Market Value Share and BPS Analysis by Application, 2025 and 2035
  • Figure 47: Latin America Market Y-o-Y Growth Comparison by Application, 2025-2035
  • Figure 48: Latin America Market Attractiveness Analysis by Application
  • Figure 49: Latin America Market Value Share and BPS Analysis by Category, 2025 and 2035
  • Figure 50: Latin America Market Y-o-Y Growth Comparison by Category, 2025-2035
  • Figure 51: Latin America Market Attractiveness Analysis by Category
  • Figure 52: Western Europe Market Value Share and BPS Analysis by Country, 2025 and 2035
  • Figure 53: Western Europe Market Value Share and BPS Analysis by Material Type, 2025 and 2035
  • Figure 54: Western Europe Market Y-o-Y Growth Comparison by Material Type, 2025-2035
  • Figure 55: Western Europe Market Attractiveness Analysis by Material Type
  • Figure 56: Western Europe Market Value Share and BPS Analysis by Product Type, 2025 and 2035
  • Figure 57: Western Europe Market Y-o-Y Growth Comparison by Product Type, 2025-2035
  • Figure 58: Western Europe Market Attractiveness Analysis by Product Type
  • Figure 59: Western Europe Market Value Share and BPS Analysis by Application, 2025 and 2035
  • Figure 60: Western Europe Market Y-o-Y Growth Comparison by Application, 2025-2035
  • Figure 61: Western Europe Market Attractiveness Analysis by Application
  • Figure 62: Western Europe Market Value Share and BPS Analysis by Category, 2025 and 2035
  • Figure 63: Western Europe Market Y-o-Y Growth Comparison by Category, 2025-2035
  • Figure 64: Western Europe Market Attractiveness Analysis by Category
  • Figure 65: Eastern Europe Market Value Share and BPS Analysis by Country, 2025 and 2035
  • Figure 66: Eastern Europe Market Value Share and BPS Analysis by Material Type, 2025 and 2035
  • Figure 67: Eastern Europe Market Y-o-Y Growth Comparison by Material Type, 2025-2035
  • Figure 68: Eastern Europe Market Attractiveness Analysis by Material Type
  • Figure 69: Eastern Europe Market Value Share and BPS Analysis by Product Type, 2025 and 2035
  • Figure 70: Eastern Europe Market Y-o-Y Growth Comparison by Product Type, 2025-2035
  • Figure 71: Eastern Europe Market Attractiveness Analysis by Product Type
  • Figure 72: Eastern Europe Market Value Share and BPS Analysis by Application, 2025 and 2035
  • Figure 73: Eastern Europe Market Y-o-Y Growth Comparison by Application, 2025-2035
  • Figure 74: Eastern Europe Market Attractiveness Analysis by Application
  • Figure 75: Eastern Europe Market Value Share and BPS Analysis by Category, 2025 and 2035
  • Figure 76: Eastern Europe Market Y-o-Y Growth Comparison by Category, 2025-2035
  • Figure 77: Eastern Europe Market Attractiveness Analysis by Category
  • Figure 78: East Asia Market Value Share and BPS Analysis by Country, 2025 and 2035
  • Figure 79: East Asia Market Value Share and BPS Analysis by Material Type, 2025 and 2035
  • Figure 80: East Asia Market Y-o-Y Growth Comparison by Material Type, 2025-2035
  • Figure 81: East Asia Market Attractiveness Analysis by Material Type
  • Figure 82: East Asia Market Value Share and BPS Analysis by Product Type, 2025 and 2035
  • Figure 83: East Asia Market Y-o-Y Growth Comparison by Product Type, 2025-2035
  • Figure 84: East Asia Market Attractiveness Analysis by Product Type
  • Figure 85: East Asia Market Value Share and BPS Analysis by Application, 2025 and 2035
  • Figure 86: East Asia Market Y-o-Y Growth Comparison by Application, 2025-2035
  • Figure 87: East Asia Market Attractiveness Analysis by Application
  • Figure 88: East Asia Market Value Share and BPS Analysis by Category, 2025 and 2035
  • Figure 89: East Asia Market Y-o-Y Growth Comparison by Category, 2025-2035
  • Figure 90: East Asia Market Attractiveness Analysis by Category
  • Figure 91: South Asia & Pacific Market Value Share and BPS Analysis by Country, 2025 and 2035
  • Figure 92: South Asia & Pacific Market Value Share and BPS Analysis by Material Type, 2025 and 2035
  • Figure 93: South Asia & Pacific Market Y-o-Y Growth Comparison by Material Type, 2025-2035
  • Figure 94: South Asia & Pacific Market Attractiveness Analysis by Material Type
  • Figure 95: South Asia & Pacific Market Value Share and BPS Analysis by Product Type, 2025 and 2035
  • Figure 96: South Asia & Pacific Market Y-o-Y Growth Comparison by Product Type, 2025-2035
  • Figure 97: South Asia & Pacific Market Attractiveness Analysis by Product Type
  • Figure 98: South Asia & Pacific Market Value Share and BPS Analysis by Application, 2025 and 2035
  • Figure 99: South Asia & Pacific Market Y-o-Y Growth Comparison by Application, 2025-2035
  • Figure 100: South Asia & Pacific Market Attractiveness Analysis by Application
  • Figure 101: South Asia & Pacific Market Value Share and BPS Analysis by Category, 2025 and 2035
  • Figure 102: South Asia & Pacific Market Y-o-Y Growth Comparison by Category, 2025-2035
  • Figure 103: South Asia & Pacific Market Attractiveness Analysis by Category
  • Figure 104: Middle East and Africa Market Value Share and BPS Analysis by Country, 2025 and 2035
  • Figure 105: Middle East and Africa Market Value Share and BPS Analysis by Material Type, 2025 and 2035
  • Figure 106: Middle East and Africa Market Y-o-Y Growth Comparison by Material Type, 2025-2035
  • Figure 107: Middle East and Africa Market Attractiveness Analysis by Material Type
  • Figure 108: Middle East and Africa Market Value Share and BPS Analysis by Product Type, 2025 and 2035
  • Figure 109: Middle East and Africa Market Y-o-Y Growth Comparison by Product Type, 2025-2035
  • Figure 110: Middle East and Africa Market Attractiveness Analysis by Product Type
  • Figure 111: Middle East and Africa Market Value Share and BPS Analysis by Application, 2025 and 2035
  • Figure 112: Middle East and Africa Market Y-o-Y Growth Comparison by Application, 2025-2035
  • Figure 113: Middle East and Africa Market Attractiveness Analysis by Application
  • Figure 114: Middle East and Africa Market Value Share and BPS Analysis by Category, 2025 and 2035
  • Figure 115: Middle East and Africa Market Y-o-Y Growth Comparison by Category, 2025-2035
  • Figure 116: Middle East and Africa Market Attractiveness Analysis by Category
  • Figure 117: Global Market - Tier Structure Analysis
  • Figure 118: Global Market - Company Share Analysis

Frequently Asked Questions

What is the estimated market size of the scarfing inserts market in 2025?

The market is valued at USD 263.8 million in 2025.

How large is the scarfing inserts market expected to be in 2035?

It is projected to reach USD 383.1 million by 2035.

What is the expected CAGR for the scarfing inserts market between 2025 and 2035?

The market is anticipated to grow at a CAGR of 3.8% during the forecast period.

Which application segment is projected to lead the scarfing inserts market?

Structural tubing applications are expected to dominate the market with a 35% share in 2025.

Which product type is projected to lead the scarfing inserts market?

External scarfing inserts are expected to command a 45% market share in 2025.

Explore Similar Insights

Future Market Insights

Scarfing Inserts Market