The valve seat inserts market is likely to expand from USD 6.6 billion in 2025 to USD 9.7 billion in 2035, reflecting a CAGR of 3.9%. Market expansion is expected to be influenced by both volume and price growth, with each contributing differently across the forecast period. Volume growth is likely to play a primary role in driving market value, supported by the rising production of engines in automotive, industrial, and heavy machinery sectors. Increasing demand for replacement parts and adoption in new engine designs will further boost unit sales, particularly in regions with growing vehicle and machinery production.
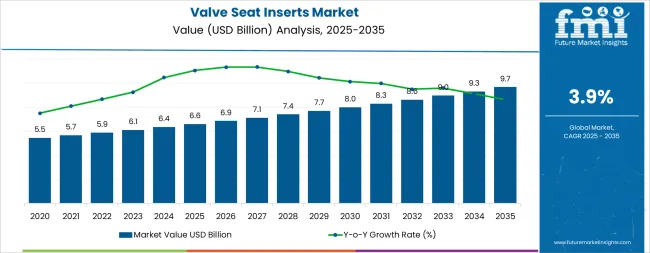
Price growth will also contribute, though to a lesser extent, as manufacturers introduce premium or performance-focused inserts with enhanced durability, thermal resistance, and material quality. Between 2025 and 2030, volume-driven growth is expected to dominate, reflecting expansion in engine manufacturing and replacement markets.
From 2030 to 2035, moderate price adjustments due to material innovation, higher-grade alloys, and advanced manufacturing processes may add incremental value. The contribution of volume versus price suggests a market largely driven by increasing demand for components, with price growth providing supplementary support. This balance indicates a stable and predictable market trajectory, where rising unit consumption combined with moderate price enhancements ensures steady value growth over the ten-year period.
The market is primarily divided between original equipment manufacturers (OEMs) and the aftermarket sector. OEMs account for approximately 68% of the market, driven by their integration of valve seat inserts in new vehicle engines and industrial machinery for durability and performance. The aftermarket segment accounts for the remaining 32%, catering to maintenance, repair, and performance upgrades for engines across automotive, industrial, and marine applications. Together, these segments shape the majority of the market, balancing new production demand with replacement and retrofitting needs.
Recent trends in the valve seat inserts market highlight a move toward advanced materials and precision engineering. Manufacturers are increasingly using high-strength alloys and coatings to enhance wear resistance and thermal stability. There is growing adoption of CNC machining and laser cutting for accurate insert placement, improving engine efficiency and longevity. The market is also witnessing demand for inserts tailored for high-performance and fuel-efficient engines, as well as for hybrid and electric vehicles. Innovations in materials and manufacturing processes are enabling lighter, more durable, and performance-oriented valve seat solutions across diverse engine types.
| Metric | Value |
|---|---|
| Market Value (2025) | USD 6.6 billion |
| Market Forecast (2035) | USD 9.8 billion |
| Growth Rate | 3.9% CAGR |
The valve seat inserts market is expanding primarily due to tightening global emissions regulations. Standards in North America, Europe, China, and India are pushing automakers and engine manufacturers to adopt inserts that provide tighter sealing and greater stability under rising thermal and pressure loads. These regulations are not only reshaping design priorities but also elevating the importance of advanced materials that extend service life while reducing harmful emissions.
Another key driver is the increasing fitment of inserts in hybrid, CNG, LPG, ethanol, and hydrogen-ready engines. Compared with traditional gasoline or diesel platforms, these engines operate at significantly higher exhaust temperatures. Inserts must therefore retain hardness and durability under more demanding conditions, creating opportunities for specialized high-performance solutions. This diversification of engine types has widened the addressable market, particularly as OEMs transition toward cleaner and alternative fuels.
Technological advancements also support market growth. Powder metallurgy, laser cladding, and engineered composite alloys are enabling enhanced wear resistance, improved machinability, and superior heat transfer properties. These improvements extend engine life, reduce valve recession, and lower lifecycle costs. At the same time, predictive maintenance tools and organized service chains are stimulating steady aftermarket replacement demand, with traceability enhancing reliability. Rapid industrialization in the Asia-Pacific is driving demand for valve seat inserts in non-automotive sectors, including agriculture, construction, railways, marine engines, and distributed power equipment.
The valve seat inserts market is set for steady growth and transformation. As automotive, industrial, and aerospace engines demand greater durability, emissions compliance, and efficiency, valve seat inserts are gaining importance not just as routine components but as critical enablers of extended service life, low emissions, and reduced maintenance cycles.
Pathways such as premium alloys, surface engineering, circularity, and localized supply will allow margin uplift, especially in developed markets. Geographic expansion and aftermarket-focused strategies will drive volume, particularly in regions with large installed bases and cost-sensitive fleets. Regulatory pressures around emission control, sustainability, and supply resilience provide structural support.
Pathway A - Compliance-Driven Upgrades & Emission Norms. Tighter Euro 7, EPA, China 6b, and BS-VI norms demand high-performance inserts that ensure better sealing, higher temperature stability, and reduced wear. OEM adoption of compliant designs drives steady growth. Expected revenue pool: USD 0.8–1.2 billion
Pathway B - Advanced Alloys & Coatings. Nickel-based, cobalt-based, powder-metal, and ceramic-coated inserts reduce valve seat recession and wear. These technologies allow premium positioning with longer lifecycle benefits. Opportunity: USD 0.6–1.0 billion
Pathway C - Manufacturing Process Innovation. Freeze-spray powder metallurgy, laser cladding, and additive manufacturing deliver precision, weight reduction, and superior heat transfer. Adoption improves throughput, reduces scrap, and lowers lifetime cost per engine. Revenue lift: USD 0.4–0.7 billion
Pathway D - Expanding End-Uses & Applications. Beyond passenger cars, inserts are increasingly critical in heavy commercial, agricultural machinery, marine engines, rail, aerospace, and power generation. Wider application pools create stable demand. Pool: USD 0.9–1.4 billion
Pathway E - Geographic Expansion & Localization. APAC, LATAM, and MEA regions are expanding automotive and industrial output. Local production and regional supply chains reduce lead times, costs, and currency exposure, thereby enhancing overall efficiency. Expected upside: USD 0.7–1.1 billion
Pathway F - Supply Chain Resilience & Circularity. Recycling, remanufacturing, and alloy recovery reduce raw-material dependency and address post-service waste. Organized aftermarket chains can monetize sustainability benefits. Opportunity: USD 0.4–0.6 billion
Pathway G - Sustainability & ESG Differentiation. Lower energy processes, waste valorization, and renewable-powered foundries allow differentiation. Alignment with OEMs’ ESG mandates and fleet procurement standards drives the adoption of premium solutions. Pool: USD 0.3–0.5 billion
The valve seat inserts market is segmented by material type, engine type, end use, and sales channel. Alloy-based inserts dominate, with iron alloys widely applied in mass-market engines. Growth is strongest in nickel- and cobalt-based alloys, used in hybrid, CNG, LPG, and hydrogen-ready platforms requiring superior wear and heat resistance. Titanium and copper alloys cater to lightweight or high-conductivity needs, while advanced composites such as ceramics, powder-metal blends, and reinforced polymers are emerging for extreme-duty applications. By engine type, gasoline and diesel lead today, though gas engines are forecast to expand the fastest to 2035. Automotive end use, passenger cars, LCVs, and HCVs remain the largest, complemented by industrial, aerospace, marine, and power sectors. OEMs dominate sales, but the aftermarket is accelerating with predictive maintenance and organized service chains.
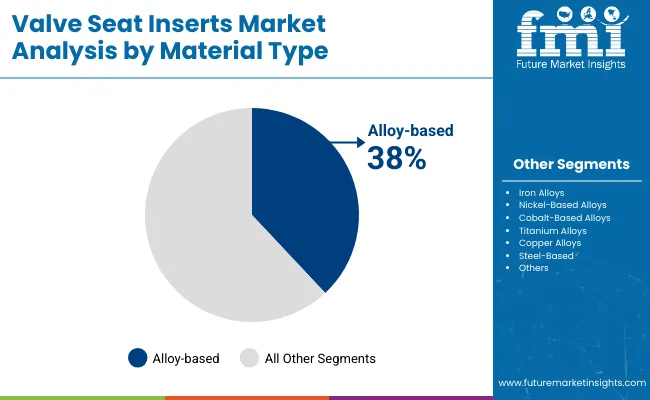
The alloy-based segment holds the largest share of the valve seat inserts market, accounting for about 38%, and continues to strengthen its position due to its superior performance characteristics compared with conventional materials. Alloys are engineered to provide enhanced durability, resistance to wear, heat, and corrosion qualities that are critical for engines operating under demanding conditions. This makes them particularly suitable for heavy-duty vehicles, hybrid engines, and high-performance machinery, where valve seats are subjected to extreme pressure cycles and elevated combustion temperatures.
Alloy-based inserts are also valued for their ability to maintain a tight seal between the valve and the cylinder head, minimizing valve seat recession and ensuring optimal engine compression. This results in improved fuel efficiency, reduced emissions, and extended engine life, which are increasingly important factors in meeting global emission standards. The use of advanced alloys also reduces the frequency of maintenance, lowering the total cost of ownership for end users. Beyond automotive applications, the superior thermal and mechanical performance of alloy-based inserts makes them indispensable in industrial engines, aerospace turbines, and marine propulsion systems, where reliability and long service intervals are essential. These factors collectively position alloy-based inserts as the dominant choice in the global market.
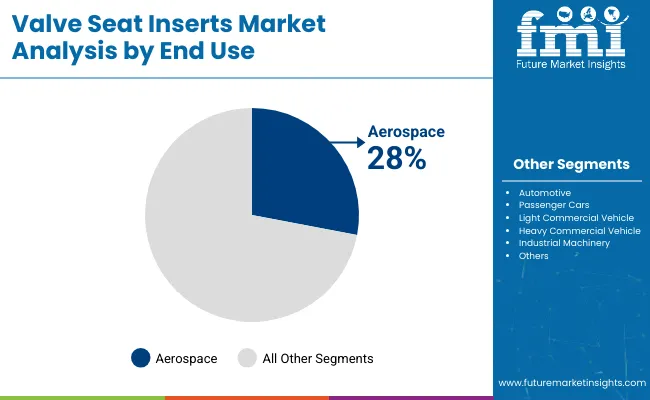
The aerospace sector leads by end use, accounting for nearly 28% of the valve seat inserts market, underscoring the critical role these components play in aviation engines. Aerospace engines operate in some of the harshest conditions imaginable, facing extreme temperatures, constant mechanical stress, and high-pressure cycles during takeoff, cruising, and landing. In such environments, valve seat inserts must maintain a perfect seal to ensure proper combustion, prevent leaks, and support consistent engine performance.
The durability and thermal stability of valve seat inserts directly contribute to greater fuel efficiency and enhanced safety, two of the most important considerations in aerospace operations. Any failure in valve performance could compromise engine reliability, making inserts indispensable for reducing risk and extending service life. The aerospace applications demand materials that resist wear and corrosion even after thousands of hours of continuous operation. Inserts that combine hardness, toughness, and resistance to thermal fatigue provide the level of performance required in modern jet engines and auxiliary power units.
As airlines and defense organizations strive for engines with lower emissions, higher efficiency, and extended maintenance intervals, demand for advanced valve seat inserts in the aerospace industry continues to rise. Their ability to deliver precision, reliability, and cost savings under extreme conditions makes aerospace one of the most lucrative and innovation-driven end-use segments.
The valve seat inserts market is being propelled by regulatory and application-driven demand. Emission standards in the USA, Europe, China, and India are growing increasingly strict, requiring more durable, heat- and wear-resistant materials that can perform consistently across multiple fuel types, including gasoline, diesel, CNG, LPG, ethanol, and hydrogen. The supply chain for nickel and cobalt remains volatile, exposing producers to sharp swings in alloy costs. Energy-intensive heat treatment and machining processes are particularly vulnerable in Europe, where industrial energy prices are structurally high. Skilled labor shortages in advanced machining also limit capacity. Finally, strict compliance and durability testing requirements lengthen qualification cycles for new alloys and coatings, increasing development cost and slowing adoption.
Material innovation is one of the clearest trends shaping the future of valve seat inserts. Advanced alloys such as nickel-, cobalt-, and chromium-based blends are increasingly supplemented with powder-metal composites, ceramic-matrix designs, and laser-applied overlays. These engineered materials allow inserts to sustain higher operating temperatures without losing hardness, minimizing valve seat recession, galling, or deformation. Trials have demonstrated double-digit lifespan improvements under equivalent stress cycles compared with conventional iron- or steel-based inserts. At the same time, manufacturing methods are advancing. Indexable cutting tools, precision milling systems, and tighter process controls deliver smoother surface finishes while lowering unit costs. Laser cladding and thermal spray technologies further enhance coating adhesion and wear resistance. The combined effect is improved durability and reduced lifetime cost per engine, which appeals to both OEM programs and aftermarket rebuilders. These engineering innovations are reinforcing the role of inserts as a cost-effective and technically indispensable component in modern engines.
A trend is the digital transformation of the aftermarket. Where replacement supply was once fragmented, organized rebuild networks and e-commerce platforms now deliver premium inserts with verified alloy grades, heat treatment documentation, and process histories. Predictive maintenance systems embedded in fleet and industrial engines are synchronizing insert replacement with measured wear, significantly improving uptime and reducing the cost of unplanned service events. Certified remanufacturing standards, particularly in Europe, now mandate traceability, ensuring consistent performance and cutting defect rates across the supply chain. In addition, regional coating hubs in Asia-Pacific and Europe are helping reduce lead times, while cross-border supply agreements mitigate disruptions caused by raw material volatility. These changes are transforming the aftermarket into a more structured, transparent, and reliable ecosystem. For suppliers, it unlocks new value through premium positioning; for operators, it offers assurance of quality, service predictability, and reduced downtime. This trend will increasingly complement OEM demand over the next decade.
The valve seat inserts market is expected to grow globally at a CAGR of 3.9% between 2025 and 2035. India leads among major countries with a projected CAGR of 4.0%, driven by rising passenger vehicle and commercial vehicle production. With over 6.4 million vehicles produced in 2024, growing domestic demand and expanding aftermarket services contribute to this higher-than-global growth. China follows closely at 3.8%, supported by annual production of around 28 million vehicles and strong industrial activity. Among BRICS nations, Brazil and Russia are expected to grow at 3.6% and 3.2%, respectively, reflecting gradual recovery in automotive manufacturing. OECD countries such as the United States, Germany, and the United Kingdom are projected at 3.4%, 3.0%, and 3.1%, showing moderate growth due to mature markets. ASEAN markets, including Thailand and Indonesia, are likely to mirror emerging market trends, benefiting from rising vehicle production and aftermarket demand. Countries with expanding automotive output exceed the global CAGR, while mature markets remain at or below 3.9%.
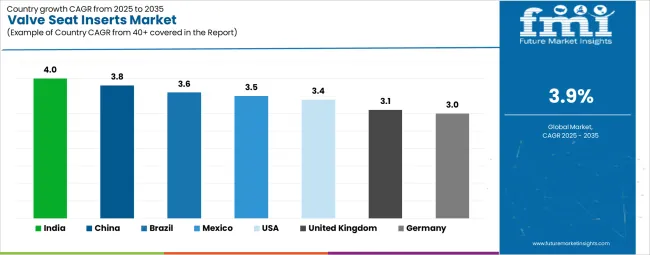
| Country | CAGR (2025–2035) |
|---|---|
| India | 4.0% |
| China | 3.8% |
| United States | 3.4% |
| Brazil | 3.6% |
| Mexico | 3.5% |
| Germany | 3.0% |
| United Kingdom | 3.1% |
India is projected to show the highest growth rate at 4.0% CAGR through 2035. BS-VI compliance and engine program updates in Tamil Nadu, Maharashtra, and Gujarat are increasing use of advanced alloys. Organized service chains account for a rising share of replacements and show faster growth than OEM fitment. Production-linked incentives encourage investment in coating and heat-treatment lines, raising domestic capacity and improving traceability through e-invoicing. Pilot programs on cobalt-reinforced inserts for biodiesel support broader adoption in commercial fleets and agricultural machinery. Exports to Middle Eastern OEMs add a small but growing niche.
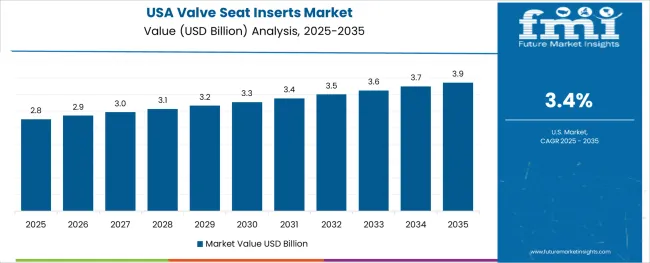
The United States valve seat inserts market is projected to grow at a steady CAGR of around 3.4% between 2025 and 2035, supported by regulatory mandates, technological advancements, and diversified demand. Stringent EPA Tier 3 standards and the upcoming Tier 4 framework are compelling OEMs to integrate inserts that deliver superior sealing, heat resistance, and long-term durability, particularly in hybrid and high-performance powertrains. Pilot programs for ceramic-coated inserts in Michigan and Ohio demonstrate up to 15% reductions in friction losses, translating into measurable improvements in fuel efficiency and reduced emissions.
On the aftermarket side, the adoption of telemetry-enabled predictive maintenance is ensuring replacements align more closely with actual wear cycles, reducing unplanned downtime and boosting insert demand. Federal incentives for natural gas and hydrogen pilots are broadening applications for high-temperature alloy grades, while capacity limitations at USA foundries have encouraged alliances with Canadian and regional suppliers to secure feedstock. Together, these factors underpin resilient mid-single-digit growth.
The valve seat inserts market in China is projected to expand at a strong 3.8% CAGR from 2025 to 2035, supported by domestic industrial policy and rapid adoption of advanced alloys. The government’s “Made in China 2025” initiative has accelerated local production of nickel-alloy and coated inserts, ensuring a stable supply base and reducing dependence on imports. At the same time, OEMs are implementing standardized insert specifications to comply with China 6b emission norms, cutting particulate emissions by nearly 10% and creating opportunities for ceramic-matrix composite adoption in high-performance engines.
Aftermarket growth is also robust, with digital B2B platforms handling close to half of replacement volume, offering traceability and cost efficiency for repair networks. Export opportunities to Southeast Asia are adding incremental demand, growing above 4% annually. Meanwhile, national R&D grants are funding titanium-alloy trials with 25% weight-reduction potential, with pilot production expected by 2026. Collectively, these trends position China as a global leader in material innovation and mid-single-digit market growth.
The valve seat inserts market in China is forecast to expand at roughly 3.0% CAGR through 2035, with growth anchored in stringent Euro 7 regulations and the country’s strong automotive manufacturing base. Compliance with emission standards is driving sustained demand for premium nickel- and cobalt-alloy inserts, particularly in hybrid and plug-in platforms where durability under cyclic thermal loads is critical. The aftermarket is also evolving, with remanufacturing practices governed by VDI certification ensuring up to 95% traceability and improving replacement quality across passenger car and commercial vehicle fleets.
Despite these positives, the sector faces structural challenges. Energy costs remain 20–25% above the EU average, while skilled-labor shortages constrain precision machining capacity and hold utilization near 82%. To offset these pressures, German OEMs and suppliers are accelerating Industrie 4.0 initiatives. Automated inspection systems and digital twin integration are reducing reject rates by 20% and shortening lead times. Ongoing Fraunhofer-led research into ceramic coatings could further extend insert lifespans in high-load conditions, supporting stable, low-single-digit growth.
the valve seat inserts market In Brazil is projected to expand at about 3.6% CAGR between 2025 and 2035, underpinned by the country’s established flex-fuel engine base and tightening Proconve L7 emission standards. OEMs in São Paulo and Paraná are specifying corrosion-resistant nickel- and cobalt-alloy inserts capable of withstanding ethanol-rich fuel blends, adding significant incremental value by 2035. The aftermarket is also maturing, with remanufacturers offering coated inserts backed by performance guarantees capturing nearly half of replacement demand and growing faster than OEM channels.
Agricultural machinery represents a critical end-use, accounting for over one-third of demand. Seasonal peak usage in harvesting and planting has heightened the need for heavy-duty grades that minimize downtime, supporting a niche growth rate of 4.5%. Challenges persist in the form of currency volatility, which fluctuates ±10% against the USA dollar, and import duties of up to 12% on specialty alloys, both pressuring cost competitiveness. The joint-venture coating plants under Brazil’s “Inova Agro” program and feasibility studies for a new foundry in Minas Gerais aim to expand capacity and stabilize supply, helping to sustain mid-single-digit growth.
The valve seat inserts market in Mexico is expected to grow at around 3.5% CAGR through 2035, benefiting from regional trade dynamics and domestic industrial expansion. The USMCA framework has encouraged near-shoring, attracting major OEM assembly plants to hubs in Nuevo León, Puebla, and Guanajuato. This has lifted demand for locally manufactured alloy- and steel-based inserts while emission norms such as NOM-044 are driving upgrades that cut engine rework rates by nearly 18%.
The aftermarket is also expanding rapidly, with distributors capturing close to half of replacement volumes by offering competitively priced, remanufactured nickel-coated inserts that cost roughly 15% less than virgin parts. Additional growth is supported by rising rail investments and heavy-truck exports to the USA and Canada, which add incremental value at a 4% CAGR. Meanwhile, pilot programs in additive manufacturing are reducing cycle times by up to 30% while improving quality. Partnerships with Tier-1 suppliers are raising process standards, lowering defect rates, and positioning Mexico as a resilient mid-single-digit growth hub.
The United Kingdom valve seat inserts market is forecast to grow at about 3.1% CAGR through 2035, driven by regulatory compliance, aftermarket maturity, and emerging innovation. Certification frameworks under the Vehicle Certification Agency (VCA) and stringent Real Driving Emissions (RDE) testing are prompting OEMs to adopt advanced alloy-based inserts with improved sealing, heat resistance, and wear properties. This ensures compliance while supporting longer service intervals. On the aftermarket side, independent rebuilders are gaining share by offering steel- and cobalt-based inserts with extended warranties, now accounting for over a third of replacement volumes.x
Urban low-emission zones in London, Birmingham, and Glasgow are pushing upgrades in gasoline engines, further stimulating demand. Yet, rising energy costs and logistics realignments post-Brexit continue to add pressure to input prices, with increases of up to 10% reported. On the innovation front, Innovate UK grants are supporting Coventry’s pilot programs in 3D-printed titanium inserts, which demonstrate 25% lighter weight and improved service life. These advances underpin a stable mid-single-digit growth outlook.
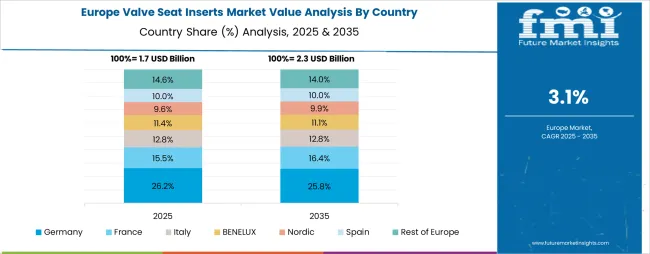
The European valve seat inserts market is projected to grow from USD 1.45 billion in 2025 to USD 2.0 billion by 2035, registering a CAGR of 3.3% over the forecast period. Germany is expected to remain the largest market, holding a 27.0% share in 2025 (USD 392 million), declining slightly to 26.0% by 2035 (USD 520 million), supported by strong OEM programs, hybrid adoption, and certified remanufacturing practices.
France follows with a 15.0% share in 2025 (USD 218 million), projected to rise to 15.5% by 2035 (USD 310 million), backed by passenger car and LCV demand. The United Kingdom holds 14.0% in 2025 (USD 203 million), expected to ease to 13.5% by 2035 (USD 270 million), influenced by post-Brexit supply chain adjustments despite strong aftermarket activity. Italy accounts for 13.0% in 2025 (USD 189 million), increasing slightly to 13.3% by 2035 (USD 266 million), while Spain represents 12.0% in 2025 (USD 174 million), reaching 12.5% by 2035 (USD 250 million).
The Netherlands and Benelux collectively hold a 3.5% share in 2025 (USD 51 million), expected to grow to 3.7% by 2035 (USD 74 million), reflecting strong quality and traceability standards. The Rest of Europe, including Nordic, Central, and Eastern European markets, expands from 15.5% in 2025 (USD 225 million) to 16.0% by 2035 (USD 320 million), supported by modernization of industrial and rail fleets.
 FN
FN
The competitive landscape features global component manufacturers, regional coating and rebuilding specialists, and material producers with differentiated alloy portfolios. Capabilities range across powder metallurgy, hot isostatic pressing, laser cladding, and precision machining. Companies invest in coating chemistry, composite matrices, and toolpath optimization to deliver longer service life, consistent recession control, and better machinability. Partnerships align alloy supply with coating and finishing capacity, and geographic expansion supports service to engine programs across North America, Europe, and East Asia.
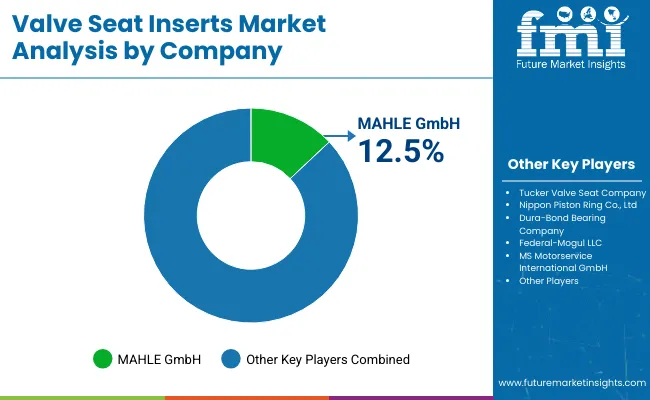
MAHLE leads with depth in OEM relationships, material science, and vertically integrated processes that meet emission-driven durability targets. Federal-Mogul leverages broad OEM and aftermarket reach and expertise in powder metallurgy across gasoline and diesel platforms with growing options for gas engines. Nippon Piston Ring emphasizes precision engineering and lightweight approaches for Asian and global powertrain builders. Dura-Bond Bearing Company has a strong North American footprint in OEM and remanufacturing. MS Motorservice International GmbH benefits from European distribution and surface treatment innovations. Tucker Valve Seat Company, Indian Seats & Guides Company, Microfinish, and Perfect Alloy Components expand regional supply and tailored grades. Across the field, firms are aligning to standardized durability benchmarks, improving traceability, and building local coating capacity to reduce lead times.
| Item | Value |
|---|---|
| Quantitative Units | USD 6.6 billion |
| Material Type | Alloy-Based, Iron Alloys, Nickel-Based Alloys, Cobalt-Based Alloys, Titanium Alloys |
| Additional Materials | Copper Alloys, Steel-Based, Others including ceramic matrix composites, graphite-based compounds, powder metallurgy composites, chromium-based alloys, reinforced polymers |
| Engine Type | Gasoline Engine, Diesel Engine, Gas Engine |
| End Use | Automotive, Passenger Cars, Light Commercial Vehicle, Heavy Commercial Vehicle, Industrial Machinery, Aerospace, Marine, Others including power generation, agricultural machinery, construction equipment, railway engines |
| Sales Channel | OEM, Aftermarket |
| Regions Covered | North America, Latin America, Western Europe, Eastern Europe, East Asia, South Asia & Pacific, Middle East, Africa |
| Countries Covered | United States, Japan, Germany, India, United Kingdom, France, Italy, Brazil, Canada, South Korea, Australia, Spain, Netherlands, Saudi Arabia, Switzerland |
| Key Companies Profiled | MAHLE GmbH, Federal-Mogul LLC, Nippon Piston Ring Co., Ltd., Dura-Bond Bearing Company, MS Motorservice International GmbH, Tucker Valve Seat Company, Indian Seats & Guides Company, Microfinish, Perfect Alloy Components |
| Additional Attributes | Technological innovations, regulatory compliance, sustainability initiatives, and industry dynamics |
The global valve seat inserts market is estimated to be valued at USD 6.6 billion in 2025.
The market size for the valve seat inserts market is projected to reach USD 9.7 billion by 2035.
The valve seat inserts market is expected to grow at a 3.9% CAGR between 2025 and 2035.
The key product types in valve seat inserts market are alloy-based, iron alloys, nickel-based alloys, cobalt-based alloys, titanium alloys, copper alloys and steel-based.
In terms of end use, automotive segment to command 28.0% share in the valve seat inserts market in 2025.


Full Research Suite comprises of:
Market outlook & trends analysis
Interviews & case studies
Strategic recommendations
Vendor profiles & capabilities analysis
5-year forecasts
8 regions and 60+ country-level data splits
Market segment data splits
12 months of continuous data updates
DELIVERED AS:
PDF EXCEL ONLINE
Japan Valve Seat Inserts Market Trend Analysis Based on Sales Channel, Material, Engine, End-Use and Provinces 2025 to 2035
Valve Grinder Market Size and Share Forecast Outlook 2025 to 2035
Valve Driver Market Size and Share Forecast Outlook 2025 to 2035
Valve Remote Control Systems Market Analysis by Type, Application and Region - Forecast for 2025 to 2035
Valve Positioner Market Growth – Trends & Forecast (2024-2034)
Valve Cover Gasket Market
Valve Sack Market
ESD Valve Market Size and Share Forecast Outlook 2025 to 2035
EGR Valve Market
HVAC Valve Market Size and Share Forecast Outlook 2025 to 2035
Flat Valve Caps And Closures Market Size and Share Forecast Outlook 2025 to 2035
Gate Valve Market Growth – Trends & Forecast 2023-2033
Lined Valve Market Growth – Trends & Forecast 2024-2034
Korea Valve Seat Insert Market Trend Analysis Based on Sales, Material, Engine, End-Use, and Provinces 2025 to 2035
Remote Valve Tissue Expanders Market Size and Share Forecast Outlook 2025 to 2035
Bag On Valve Product Market Size and Share Forecast Outlook 2025 to 2035
Engine Valve Market Size and Share Forecast Outlook 2025 to 2035
Pasted Valve Bags Market Size and Share Forecast Outlook 2025 to 2035
Slurry Valves Market Analysis - Size, Share, and Forecast 2025 to 2035
Safety Valve Market Size, Growth, and Forecast 2025 to 2035

Thank you!
You will receive an email from our Business Development Manager. Please be sure to check your SPAM/JUNK folder too.
Chat With
MaRIA