The ESD valve market is demonstrating robust growth driven by increasing focus on process safety, automation, and operational reliability across high-risk industrial environments. Rising adoption of emergency shutdown systems in oil and gas, chemical, and power generation sectors is propelling market expansion. Current market trends highlight the integration of advanced control systems and the shift toward intelligent valve actuation to ensure faster response times and enhanced safety compliance.
Manufacturers are prioritizing innovations in materials, design efficiency, and corrosion resistance to support long-term durability under extreme conditions. The future outlook remains positive with the rising implementation of Industry 4.0 technologies, which enable predictive maintenance and remote monitoring of critical systems.
Growth rationale is anchored on stringent regulatory mandates for plant safety, increasing capital investments in energy infrastructure, and the expansion of automation in industrial operations These factors collectively reinforce the steady demand trajectory and long-term potential of the ESD valve market.
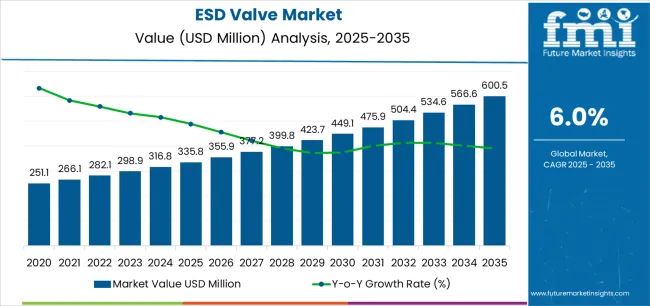
| Metric | Value |
|---|---|
| ESD Valve Market Estimated Value in (2025 E) | USD 335.8 million |
| ESD Valve Market Forecast Value in (2035 F) | USD 600.5 million |
| Forecast CAGR (2025 to 2035) | 6.0% |
The market is segmented by Type, Actuation Method, Application, and End User and region. By Type, the market is divided into Ball Valves, Gate Valves, Butterfly Valves, and Globe Valves. In terms of Actuation Method, the market is classified into Electric, Pneumatic, and Hydraulic. Based on Application, the market is segmented into Oil & Gas, Chemical Processing, Power Generation, and Water & Wastewater. By End User, the market is divided into Downstream, Upstream, and Midstream. Regionally, the market is classified into North America, Latin America, Western Europe, Eastern Europe, Balkan & Baltic Countries, Russia & Belarus, Central Asia, East Asia, South Asia & Pacific, and the Middle East & Africa.
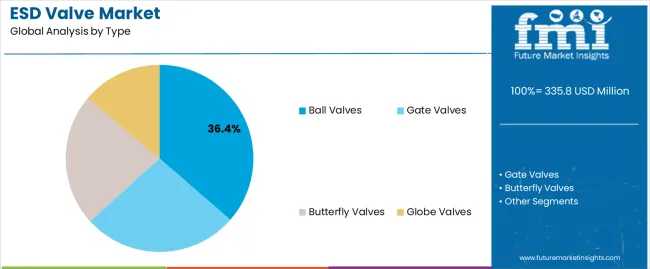
The ball valves segment, accounting for 36.40% of the type category, is leading the market due to its superior sealing capability, reliability, and ease of maintenance in high-pressure applications. The segment’s dominance has been reinforced by extensive use in emergency shutdown systems where quick and leak-proof closure is essential.
The robust design of ball valves, coupled with low torque requirements, has enhanced their suitability across a wide range of operating environments. Manufacturers are focusing on developing advanced materials to improve resistance against corrosion and extreme temperatures.
The adoption of automation-compatible ball valves has further strengthened their market position Growing demand from the oil and gas, petrochemical, and energy sectors is expected to sustain this segment’s lead, ensuring continued growth and technological advancement in product offerings.
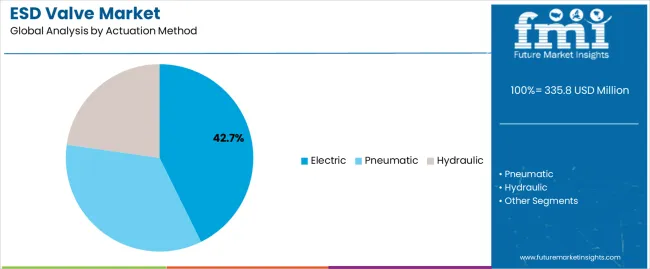
The electric actuation method segment, representing 42.70% of the actuation category, has emerged as the leading method owing to its precision control, energy efficiency, and compatibility with automated systems. Electric actuators provide superior operational reliability and facilitate integration into digital monitoring frameworks, enabling enhanced control over valve performance.
The segment’s growth is supported by the rising preference for clean and maintenance-friendly actuation systems that eliminate the need for pressurized air or hydraulic fluids. Manufacturers are investing in smart actuator technologies with remote diagnostics and feedback capabilities to improve safety and reduce downtime.
The expansion of smart industrial plants and focus on environmental sustainability are further driving demand for electric actuators, ensuring their continued dominance in the ESD valve market.
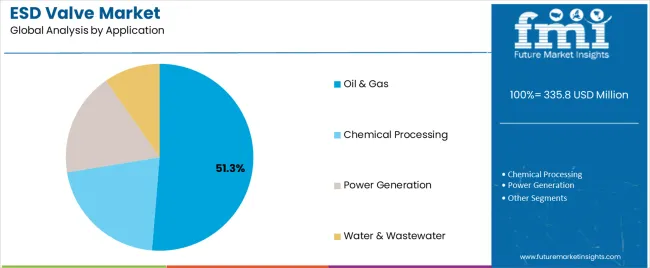
The oil and gas segment, holding 51.30% of the application category, is leading the market due to the critical role of ESD valves in maintaining safety and preventing hazardous incidents in upstream, midstream, and downstream operations. Rising investments in offshore exploration, refining, and pipeline infrastructure have sustained high demand for reliable shutdown systems.
Stringent safety regulations and industry standards have mandated the deployment of ESD valves to mitigate operational risks and environmental hazards. The integration of smart monitoring and control systems in oil and gas facilities has further enhanced the functional reliability of these valves.
Continuous modernization of existing plants and the expansion of LNG and petrochemical projects are expected to reinforce the segment’s dominance, ensuring its continued contribution to overall market growth.
Market to Expand Nearly 1.8X through 2035
The global ESD valve industry is set to expand over 1.8X through 2035 amid a 2.6% spike in predicted CAGR compared to the historical one. This can be attributed to rising usage of ESD valves in the booming industrial sector for improving safety.
Emergency shutdown (ESD) valves are crucial components within the industrial safety sector. Their demand is rising rapidly due to the imperative need to ensure operational safety across various industries such as oil and gas, chemical, power generation, and more.
ESD valves are designed to provide rapid and reliable shutdown in industrial processes. Thus, they help to prevent accidents and protect both personnel and assets. They are widely used in the oil and gas sector, known for its high-risk environments and stringent regulatory requirements.
Global sales of ESD valves are expected to also rise due to increasing global emphasis on industrial safety and the expansion of energy and chemical sectors. Innovations aimed at enhancing valve performance, reliability, and smart functionality are set to offer new growth opportunities.
The global push towards cleaner energy sources and more stringent environmental regulations will continue to influence the adoption of ESD valves. By 2035, the total market revenue is set to reach USD 581.9 million.
As per the latest analysis, North America, spearheaded by the United States, is expected to remain the most lucrative market for ESD valve manufacturers during the forecast period. It is set to hold around 28.7% of the global ESD valve market share in 2025. This is attributed to the following factors:
Industrial Growth and Expanding Energy Sector: North America, particularly the United States, is home to one of the leading oil and gas industries globally. This will continue to present growth opportunities to ESD valve companies. The vast shale gas formations and the ongoing investments in exploration and extraction activities further drive the demand for ESD valves in the region. Similarly, rising emphasis of oil and gas companies to improve safety will likely foster growth.
The exploration, production, and processing of oil and gas are inherently high-risk operations, necessitating stringent safety measures. ESD valves play a vital role in ensuring these operations' safety by providing rapid shutdown capabilities in emergencies. Thus, they help in preventing potential accidents and minimizing environmental impact.
Technological Leadership: North America is at the forefront of technological innovation in the field of industrial equipment, including safety systems like ESD valves. The region boasts a strong ecosystem of manufacturers, researchers, and technology firms that continuously work on developing advanced ESD valve solutions.
The constant innovations not only enhance safety but also improve operational efficiency and reliability. The availability of cutting-edge ESD valves and a focus on digital transformation and IoT integration for predictive maintenance and remote monitoring further solidifies North America’s leadership position in the market.
Investment in Infrastructure and Renewable Energy: North America's investments in infrastructure development and renewable energy sources also contribute to the rising ESD valve demand.
The region's commitment to reducing carbon emissions and transitioning to cleaner energy sources involves upgrading existing facilities and constructing new ones, many of which require advanced safety systems, including ESD valves. This diversification in energy and industrial projects broadens the application scope for ESD valves beyond traditional sectors.
Global sales of ESD valves increased at a CAGR of 3.7% between 2020 and 2025. Total market revenue reached about USD 335.8 million in 2025. Over the forecast period, the worldwide ESD valve industry is set to progress at a CAGR of 6.3%.
| Historical CAGR (2020 to 2025) | 3.7% |
|---|---|
| Forecast CAGR (2025 to 2035) | 6.3% |
Future ESD Valve Market Forecast
In the assessment period, the global ESD valve industry is forecast to grow rapidly, totaling a valuation of USD 600.5 million by 2035. This growth is underpinned by several key drivers and trends.
Stringent Safety Regulations and Compliance
Multiple factors are expected to drive growth of the ESD valve market. These include tightening safety regulations and the need for compliance across industries, particularly in sectors like oil and gas, chemicals, and power generation.
Regulatory bodies across the world are enforcing stricter safety standards to prevent industrial accidents and protect the environment from hazardous substances. These regulations mandate the installation of reliable safety systems, including ESD valves, to ensure rapid shutdown in emergency situations.
As industries strive to adhere to stringent regulations, the demand for ESD valves is set to rise significantly. These valves are known for their capability to provide immediate isolation of facilities or sections of a plant.
The compliance-driven need ensures a consistent demand for ESD valves. This is due to the fact that industrial operations must not only meet current safety standards but also prepare for future regulatory enhancements.
Growth in Energy and Industrial Sectors
The expansion of the energy sector, including both traditional oil & gas exploration and renewable energy projects, serves as a significant driver for the ESD valve market. As new facilities are constructed and existing ones are upgraded or expanded, the requirement for safety systems, including ESD valves, grows proportionally.
The ongoing exploration for new oil and gas reserves, particularly in challenging environments, necessitate robust safety mechanisms to manage the high-risk processes involved. This will likely propel demand for ESD valves through 2035.
Global surge in renewable energy projects and industrial growth are expected to fuel sales of ESD valves. To gain maximum benefits, key players are focusing on enhancing valve performance and reliability in diverse operational conditions.
Technological Advancements and IoT Integration
Advancements in technology and the integration of the Internet of Things (IoT) with industrial safety systems are expected to foster growth of the ESD valve market. Modern ESD valves equipped with smart technologies offer enhanced functionalities, such as remote monitoring, predictive maintenance, and improved diagnostics. This is making them an integral part of sophisticated safety and control systems.
The ability to predict failures before they occur and to perform maintenance proactively can significantly reduce downtime and operational costs while ensuring safety. This technological evolution is driving the replacement of older, less efficient systems with new, technology-enhanced ESD valves.
Industries globally are moving towards smarter, more connected operations to improve their efficiency and safety. This will likely create growth prospects for ESD valve manufacturers during the forecast period.
Increased Focus on Environmental Protection and Sustainability
The growing global focus on environmental protection and sustainability is a crucial driver for the emergency shutdown valve market. Industries are increasingly required to implement measures that minimize their environmental impact, including preventing accidental releases of hazardous substances.
ESD valves are essential components of environmental safety systems, providing a fail-safe mechanism to stop processes that could lead to spills or leaks. This increased environmental awareness, coupled with the potential financial and reputational damage of such incidents, compels companies to invest in reliable ESD valves.
As companies seek to align their operations with sustainability goals, the demand for advanced ESD valves that offer both safety and environmental benefits is set to rise. This reinforces their importance in modern industrial applications.
High Initial Investment and Maintenance Costs
Multiple factors are expected to restrain growth of the emergency shutdown valve market. These include the high initial investment required for the procurement and installation of these systems.
ESD valves, being critical components of safety systems in various industrial processes, are designed to meet stringent standards, which often come with a high cost. The complexity of these valves, coupled with the need for compatibility with existing systems and compliance with global safety standards, further escalates the initial outlay.
The ongoing maintenance and potential upgrading of ESD valves represent recurrent expenses. This can deter smaller operations or industries in developing regions from investing in state-of-the-art ESD systems.
The cost factor is particularly challenging in markets where budget constraints are tight, and there is a temptation to opt for lower-cost, potentially less reliable alternatives. This financial barrier can slow down the adoption rate of advanced ESD valve technologies, especially among entities that are less regulated or are prioritizing immediate cost savings over long-term safety and reliability.
Market Saturation and Competition from Alternative Technologies
Market saturation in developed regions serves as an additional restraint on the growth of the ESD valve market. Similarly, competition from alternative technologies can limit the expansion of the global market during the forecast period.
In highly regulated and technologically advanced markets, the penetration rate of ESD valves is already high. This leaves limited room for new entrants or for significant growth within the existing customer base.
The development of alternative safety technologies and systems could divert investment away from traditional ESD valves. Innovations in process control & monitoring and advancements in materials science could provide industries with alternative methods to achieve emergency shutdown capabilities without the need for conventional ESD valve systems.
The table below highlights key countries’ ESD valve market revenues. The United States, India, and China are predicted to remain the top three consumers of ESD valves, with expected valuations of USD 600.5 million, USD 82.4 million, and USD 58.4 million, respectively, in 2035.
| Countries | Projected ESD Valve Market Revenue (2035) |
|---|---|
| China | USD 58.4 million |
| United States | USD 600.5 million |
| Japan | USD 41.5 million |
| Germany | USD 46.4 million |
| India | USD 82.4 million |
The table below shows the estimated growth rates of the leading countries. India, Brazil, and ASEAN are set to record higher CAGRs of 5.7%, 5.2%, and 5.1%, respectively, through 2035.
| Countries | Expected Emergency Shutdown Valve Market CAGR (2025 to 2035) |
|---|---|
| India | 5.7% |
| Brazil | 5.2% |
| ASEAN | 5.1% |
| Japan | 4.8% |
| KSA | 4.5% |
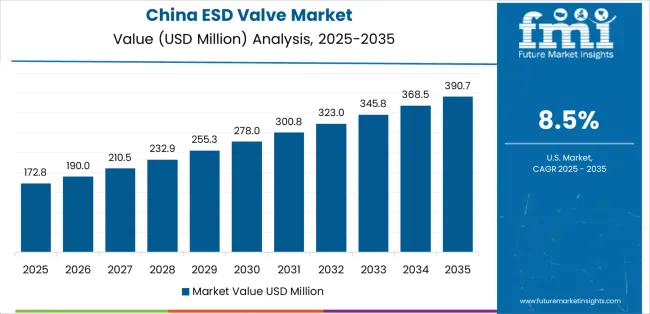
China's ESD valve market size is projected to reach USD 58.4 million by 2035. Overall demand for ESD valves in China will likely rise at 4.2% CAGR during the forecast period. This can be attributed to increasing industrial activities, infrastructure development, and stringent safety regulations.
Sales of ESD valves in the United States are projected to soar at a CAGR of around 4.1% during the assessment period. Total valuation in the nation is anticipated to reach USD 600.5 million by 2035.
The ESD valve market value in India is anticipated to total USD 82.4 million by 2035. It will likely exhibit steady growth, with overall ESD valve demand increasing at a CAGR of 5.7% during the forecast period.
The section below shows the oil and gas segment dominating the global ESD valve industry. It will likely register a CAGR of 5.4% between 2025 and 2035. Based on type, the ball valves segment is anticipated to grow at a 4.8% CAGR during the forecast period.
| Top Segment (Application) | Oil and Gas |
|---|---|
| Predicted CAGR (2025 to 2035) | 5.4% |
As per the latest analysis, usage of ESD valves is anticipated to remain high in the oil and gas segment. This is due to growing focus on improving safety in the oil and gas industry. The target segment will likely record a CAGR of 5.4% throughout the forecast period.
| Top Segment (By Type) | Ball Valves |
|---|---|
| Projected CAGR (2025 to 2035) | 4.8% |
The latest ESD valve market analysis predicts ball valve sales to grow at a CAGR of 4.8% during the forecast period. Accordingly, the ball valves segment is set to generate revenue worth USD 600.5 million by 2035.
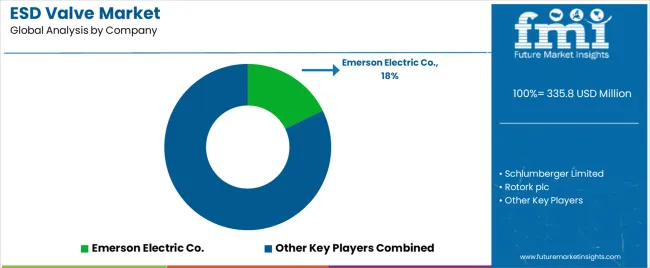
The global ESD valve market is moderately consolidated, with top players accounting for about 30% to 35% of the share. Emerson Electric Co., Schlumberger Limited, Rotork plc, Flowserve Corporation, Cameron International Corporation, IMI plc, General Electric Company, Pentair plc, Honeywell International Inc., ABB Ltd, Metso Corporation (Part of Neles), Weir Group PLC, Velan Inc., SAMSON AG, and Neway Valve are leading manufacturers of ESD valves listed in the report.
As industries worldwide continue to prioritize safety and compliance, the ESD valve market is expected to grow rapidly. To gain maximum benefits, key players are focusing on developing new ESD valves with improved features and functionalities.
Several players are incorporating automation and digital technologies into ESD valves to make them compatible with evolving industrial systems. They are also tapping into emerging markets, especially in the Asia-Pacific region, where industrialization and energy sector development are rising.
Recent Emergency Shutoff Valve Market Developments
| Attribute | Details |
|---|---|
| Estimated Market Size (2025) | USD 315.9 million |
| Projected Market Size (2035) | USD 581.9 million |
| Anticipated Growth Rate (2025 to 2035) | 6.3% |
| Historical Data | 2020 to 2025 |
| Forecast Period | 2025 to 2035 |
| Quantitative Units | Value (USD million) and Volume (Units) |
| Report Coverage | Revenue Forecast, Volume Forecast, Company Ranking, Competitive Landscape, Growth Factors, Trends, and Pricing Analysis |
| Market Segments Covered | By Type, By Actuation Method, By Application, By End-user, Region |
| Regions Covered | North America; Latin America; Western Europe; Eastern Europe; East Asia; South Asia & Pacific; Middle East & Africa |
| Key Countries Covered | United States, Canada, Mexico, Brazil, Germany, Italy, France, United Kingdom, Spain, BENELUX, NORDICS, Poland, Hungary, Balkan and Baltics, Russia, India, Association of Southeast Asian Nations, Australia and New Zealand, China, Japan, Germany, Kingdom of Saudi Arabia, Other GCC Countries, Türkiye, Other African Union, South Africa |
| Key Companies Profiled | Emerson Electric Co.; Schlumberger Limited; Rotork plc; Flowserve Corporation; Cameron International Corporation; IMI plc; General Electric Company; Pentair plc; Honeywell International Inc.; ABB Ltd; Metso Corporation (Part of Neles); Weir Group PLC; Velan Inc.; SAMSON AG; Neway Valve; KITZ Corporation; Tyco International plc (Now part of Johnson Controls); Spirax-Sarco Engineering plc; Watts Water Technologies, Inc.; Leser GmbH & Co. KG |
The global ESD valve market is estimated to be valued at USD 335.8 million in 2025.
The market size for the ESD valve market is projected to reach USD 600.5 million by 2035.
The ESD valve market is expected to grow at a 6.0% CAGR between 2025 and 2035.
The key product types in ESD valve market are ball valves, gate valves, butterfly valves and globe valves.
In terms of actuation method, electric segment to command 42.7% share in the ESD valve market in 2025.


Full Research Suite comprises of:
Market outlook & trends analysis
Interviews & case studies
Strategic recommendations
Vendor profiles & capabilities analysis
5-year forecasts
8 regions and 60+ country-level data splits
Market segment data splits
12 months of continuous data updates
DELIVERED AS:
PDF EXCEL ONLINE
ESD Safe Matting Market Size and Share Forecast Outlook 2025 to 2035
ESD Clamshell Market Size and Share Forecast Outlook 2025 to 2035
ESD Trays Market Size and Share Forecast Outlook 2025 to 2035
ESD Protective Signage Labels Market Size and Share Forecast Outlook 2025 to 2035
ESD Totes Market Size and Share Forecast Outlook 2025 to 2035
ESD Foldable Container Market Size and Share Forecast Outlook 2025 to 2035
ESD Tapes and Labels Market from 2025 to 2035
ESD Divider Market Demand & Industry Outlook 2024-2034
ESD Stackable Box Market Trends & Industry Analysis 2024-2034
ESD Protection Devices Market Insights – Trends & Demand 2023-2033
ESD workstations Market
ESD Suppressors Market
Electrostatic Discharge (ESD) Packaging Market Growth - Forecast 2025 to 2035
Valve Grinder Market Size and Share Forecast Outlook 2025 to 2035
Valve Seat Inserts Market Size and Share Forecast Outlook 2025 to 2035
Valve Driver Market Size and Share Forecast Outlook 2025 to 2035
Valve Remote Control Systems Market Analysis by Type, Application and Region - Forecast for 2025 to 2035
Valve Positioner Market Growth – Trends & Forecast (2024-2034)
Valve Cover Gasket Market
Valve Sack Market

Thank you!
You will receive an email from our Business Development Manager. Please be sure to check your SPAM/JUNK folder too.
Chat With
MaRIA