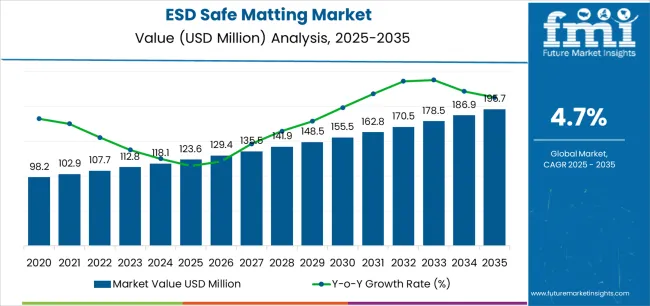
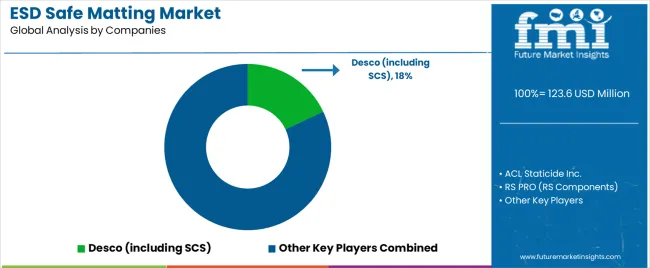
The ESD safe matting market stands at the threshold of a decade-long expansion trajectory that promises to reshape electronics manufacturing safety and static control solutions. The market's journey from USD 123.6 million in 2025 to USD 195.6 million by 2035 represents substantial growth, demonstrating the accelerating adoption of advanced static dissipative materials and electrostatic discharge protection across electronics manufacturing facilities, laboratory operations, and data center environments.
The first half of the decade (2025-2030) will witness the market climbing from USD 123.6 million to approximately USD 156.8 million, adding USD 33.2 million in value, which constitutes 46% of the total forecast growth period. This phase will be characterized by the rapid adoption of multi-layer static-dissipative matting systems, driven by increasing electronics production volumes and the growing need for comprehensive ESD protection solutions worldwide. Enhanced static control capabilities and ergonomic design features will become standard expectations rather than premium options.
The latter half (2030-2035) will witness continued growth from USD 156.8 million to USD 195.6 million, representing an addition of USD 38.8 million or 54% of the decade's expansion. This period will be defined by mass market penetration of advanced surface construction technologies, integration with comprehensive facility management platforms, and seamless compatibility with existing manufacturing infrastructure. The market trajectory signals fundamental shifts in how electronics facilities approach static control and worker safety, with participants positioned to benefit from growing demand across multiple material types and product segments.
Aerospace manufacturing facilities encounter stringent ESD control requirements that compete with operational efficiency and cost management objectives. Systems engineering managers need ESD matting that ensures spacecraft component protection while meeting aerospace industry reliability standards, but production teams focus on matting systems that accommodate complex assembly procedures without compromising electrostatic protection. Quality assurance departments require ESD matting with traceable electrical properties for aerospace component handling, while manufacturing operations prefer matting solutions that integrate with existing production tooling without extensive modifications. Engineering departments coordinate ESD matting specifications with aerospace customer standards, but assembly teams resist matting changes that could affect production schedules or require additional operator training.
Research and development laboratories encounter ESD protection requirements that conflict with experimental flexibility and equipment accessibility needs. Laboratory managers need ESD matting that protects sensitive measurement equipment while accommodating diverse research activities and prototype development procedures, but research teams prefer flexible matting configurations that support changing experimental setups without extensive reinstallation. Safety coordinators require ESD matting installations that ensure personnel protection during high-voltage testing procedures, while facilities management focuses on matting systems that accommodate laboratory equipment mobility and reconfiguration requirements. Engineering departments coordinate ESD matting specifications with research equipment grounding, but laboratory operations resist matting restrictions that limit experimental flexibility or equipment positioning options.
| Period | Primary Revenue Buckets | Share | Notes |
|---|---|---|---|
| Today | Standard matting products (tabletop, floor, workbench) | 52% | Volume-driven, replacement cycles |
| Premium multi-layer systems | 24% | Advanced static control, certified performance | |
| Anti-fatigue ESD solutions | 14% | Ergonomic benefits, worker comfort | |
| Specialty applications (runners, custom) | 10% | Niche requirements, specific dimensions | |
| Future (3-5 yrs) | Advanced 3-layer static-dissipative systems | 45-48% | Enhanced performance, compliance certification |
| Ergonomic anti-fatigue ESD mats | 18-22% | Worker safety integration, productivity focus | |
| Smart matting with monitoring | 8-12% | Real-time ESD monitoring, IoT integration | |
| Standard 2-layer solutions | 12-15% | Cost-effective compliance, volume segments | |
| Specialty & custom configurations | 8-10% | Application-specific, cleanroom certified | |
| Maintenance & testing services | 4-6% | Compliance verification, periodic testing |
At-a-Glance Metrics
| Metric | Value |
|---|---|
| Market Value (2025) | USD 123.6 million |
| Market Forecast (2035) | USD 195.6 million |
| Growth Rate | 4.7% CAGR |
| Leading Material Technology | Vinyl |
| Primary Application | Electronics Manufacturing Segment |
The market demonstrates strong fundamentals with vinyl-based ESD matting capturing dominant share through advanced static dissipative capabilities and electronics manufacturing optimization. Electronics manufacturing applications drive primary demand, supported by increasing semiconductor production and cleanroom facility requirements. Geographic expansion remains concentrated in developed markets with established electronics infrastructure, while emerging economies show accelerating adoption rates driven by electronics manufacturing initiatives and rising quality standards.
Design for compliance, not just conductivity
Primary Classification: The market segments by material into vinyl, rubber, PVC, and other materials, representing the evolution from basic static control products to sophisticated ESD protection solutions for comprehensive electronics manufacturing optimization.
Secondary Classification: Product type segmentation divides the market into tabletop mats, floor mats, workbench mats, runners, and other configurations, reflecting distinct requirements for workspace protection, operational efficiency, and facility coverage standards.
Tertiary Classification: End-use segmentation covers electronics manufacturing, laboratories, medical and healthcare facilities, data centers and IT operations, and other industrial and educational applications, while surface construction spans 3-layer static-dissipative, 2-layer static-dissipative, homogeneous rubber, and foam/anti-fatigue ESD systems.
Regional Classification: Geographic distribution covers North America, Latin America, Western Europe, Eastern Europe, East Asia, South Asia Pacific, and Middle East & Africa, with developed markets leading adoption while emerging economies show accelerating growth patterns driven by electronics manufacturing expansion programs.
The segmentation structure reveals technology progression from standard static control equipment toward sophisticated multi-layer systems with enhanced dissipative and ergonomic capabilities, while application diversity spans from electronics facilities to laboratory operations requiring comprehensive electrostatic discharge protection solutions.
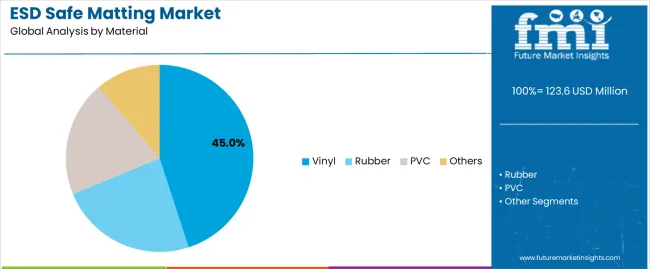
Market Position: Vinyl material commands the leading position in the ESD safe matting market with 45% market share through advanced static dissipative features, including superior conductivity control, operational durability, and electronics manufacturing optimization that enable production facilities to achieve optimal electrostatic protection across diverse electronics assembly and cleanroom environments.
Value Drivers: The segment benefits from electronics facility preference for reliable matting systems that provide consistent ESD performance, reduced static discharge risk, and operational longevity without requiring significant infrastructure modifications. Advanced material features enable multi-layer construction capabilities, resistance consistency, and integration with existing grounding systems, where static control performance and regulatory compliance represent critical facility requirements.
Competitive Advantages: Vinyl ESD matting systems differentiate through proven operational reliability, consistent dissipative characteristics, and integration with comprehensive static control systems that enhance facility effectiveness while maintaining optimal safety standards suitable for diverse electronics manufacturing and laboratory applications.
Key market characteristics:
Rubber material maintains a 30.0% market position in the ESD safe matting market due to its balanced durability properties and ergonomic advantages. These materials appeal to facilities requiring heavy-duty static protection with comfortable standing surfaces for industrial electronics applications. Market growth is driven by manufacturing expansion, emphasizing reliable ESD solutions and worker comfort through optimized material designs.
PVC material captures 18% market share through cost-effective static control requirements in standard assembly operations, moderate-traffic areas, and budget-conscious applications. These facilities demand effective ESD protection capable of meeting basic compliance standards while providing economical procurement and operational simplicity.
Other materials including specialty compounds and hybrid formulations account for 7.0% market share through specialized ESD requirements in unique applications and custom configurations.
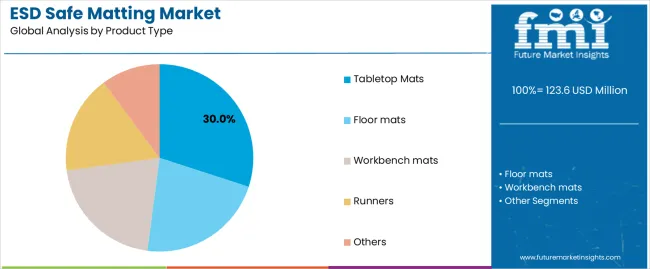
Market Context: Tabletop mats demonstrate the leading market position in the ESD safe matting market with 30% market share due to widespread adoption of workstation protection systems and increasing focus on electronics assembly optimization, component handling safety, and precision work applications that maximize static control while maintaining workspace efficiency.
Appeal Factors: Tabletop mat operators prioritize surface versatility, static control precision, and integration with existing workstation infrastructure that enables coordinated protection operations across multiple assembly tasks. The segment benefits from substantial electronics manufacturing investment and workstation standardization programs that emphasize the acquisition of certified tabletop systems for component protection and assembly quality applications.
Growth Drivers: Electronics expansion programs incorporate tabletop mats as standard equipment for workstation operations, while semiconductor assembly growth increases demand for high-performance static protection capabilities that comply with industry standards and minimize component damage risks.
Market Challenges: Varying workstation dimensions and customization requirements may limit product standardization across different facilities or application scenarios.
Application dynamics include:
Floor mats capture 26.0% market share through facility-wide static control requirements in production areas, cleanrooms, and high-traffic zones. These facilities demand comprehensive ESD protection systems capable of operating across large surface areas while providing effective static dissipation and operational durability capabilities.
Workbench mats account for 22.0% market share, including specialized work area protection, repair stations, and quality control operations requiring dedicated static control capabilities for equipment protection and operational reliability.
Runners maintain 15.0% market share for pathway protection and transition zones, while other products including specialty configurations account for 7.0% of the market through custom application requirements.
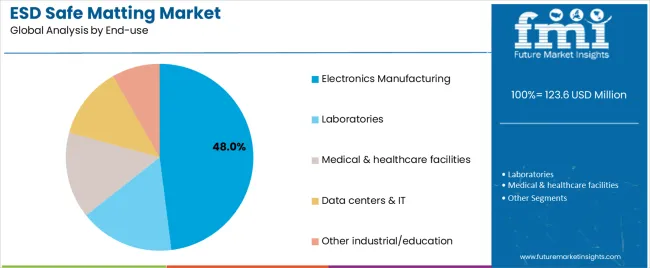
Market Position: Electronics Manufacturing dominates the market with 48% market share through primary demand for ESD protection in semiconductor assembly, circuit board production, and component handling operations.
Value Drivers: This end-use segment provides the fundamental requirement for static control in electronics production, meeting needs for component protection, yield optimization, and quality assurance without operational complexity.
Growth Characteristics: The segment benefits from broad applicability across electronics sectors, standardized compliance specifications, and established procurement programs that support widespread adoption and operational efficiency.
Laboratories capture 14.0% market share through precision instrument protection and sensitive equipment handling requirements. Medical and Healthcare Facilities hold 12.0% share, Data Centers and IT operations account for 10.0%, while Other Industrial and Educational applications represent 16.0% of the market.
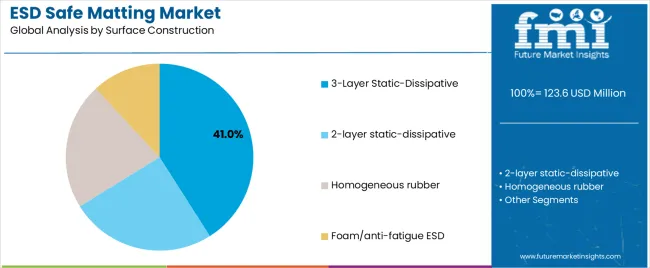
Market Context: 3-layer static-dissipative construction commands market leadership with 41% market share, reflecting the preferred surface technology for advanced ESD control and performance reliability.
Business Model Advantages: 3-layer construction provides superior static dissipation characteristics, enhanced durability, and consistent performance over extended operational periods while maintaining compliance certification requirements.
Operational Benefits: This construction type includes top dissipative layer, conductive middle layer, and bottom insulative layer that create optimal static control while providing grounding integration and long-term performance stability.
2-layer static-dissipative construction maintains 34.0% market share through cost-effective compliance solutions. Homogeneous Rubber construction holds 18.0% share, while Foam/Anti-fatigue ESD systems account for 7.0% of the market through ergonomic optimization requirements.
| Category | Factor | Impact | Why It Matters |
|---|---|---|---|
| Driver | Electronics manufacturing expansion & semiconductor capacity (fab construction, EMS growth, PLI schemes) | ★★★★★ | New production lines require comprehensive ESD protection; manufacturing scale increases demand for certified matting solutions across facility operations. |
| Driver | ANSI/ESD S20.20 compliance & industry standards (certification requirements, audit protocols) | ★★★★★ | Transforms ESD matting from "recommended" to "mandatory"; vendors providing certified products and testing support gain competitive advantage. |
| Driver | Cleanroom & controlled environment expansion (pharma labs, biotech, precision assembly) | ★★★★☆ | Controlled environments need specialized static protection; demand for cleanroom-compatible matting expanding addressable market beyond electronics. |
| Restraint | Price competition & commodity pressure (standard products, import alternatives) | ★★★☆☆ | Basic matting products face pricing pressure; differentiation through certification and performance verification becoming critical for margin protection. |
| Restraint | Maintenance & verification requirements (periodic testing, compliance documentation) | ★★★☆☆ | Ongoing testing obligations increase total ownership costs; facilities may delay upgrades or extend replacement cycles to manage expenses. |
| Trend | Smart matting & IoT integration (real-time monitoring, compliance dashboards, automated alerts) | ★★★★★ | Connected matting systems provide continuous verification; IoT integration transforms static control from periodic testing to real-time assurance. |
| Trend | Ergonomic & anti-fatigue integration (worker comfort, productivity optimization, safety enhancement) | ★★★★☆ | Dual-purpose matting combining ESD protection with ergonomic benefits; facilities seeking solutions addressing both static control and worker wellbeing. |
The ESD safe matting market demonstrates varied regional dynamics with Growth Leaders including Saudi Arabia (6.3% growth rate) and India (6.2% growth rate) driving expansion through electronics manufacturing initiatives and infrastructure development. Steady Performers encompass China (5.6% growth rate), South Korea (5.3% growth rate), and United States (4.9% growth rate), benefiting from established electronics industries and advanced manufacturing adoption. Developed Markets feature Germany (4.4% growth rate) and Japan (4.1% growth rate), where electronics applications and quality integration trends support consistent growth patterns.
Regional synthesis reveals South Asian markets leading adoption through electronics manufacturing expansion and facility development, while East Asian countries maintain strong expansion supported by semiconductor technology advancement and regulatory standardization requirements. Middle Eastern markets show accelerating growth driven by diversification initiatives and electronics cluster development.
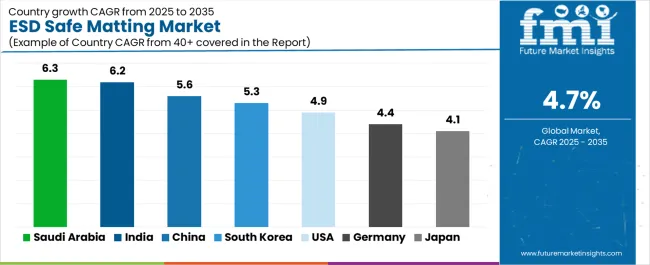
| Region/Country | 2025-2035 Growth | How to win | What to watch out |
|---|---|---|---|
| Saudi Arabia | 6.3% | Focus on electronics clusters | Project execution delays; specification changes |
| India | 6.2% | Lead with PLI alignment | Infrastructure gaps; import duties |
| China | 5.6% | Offer scale pricing | Local competition; certification complexity |
| South Korea | 5.3% | Premium fab-grade products | Technology cycles; export dependency |
| United States | 4.9% | Push ANSI/ESD compliance | Skilled labor shortage; retrofit complexity |
| Germany | 4.4% | Automotive electronics focus | Over-specification; lengthy approvals |
| Japan | 4.1% | Precision quality systems | Deflation pressures; conservative adoption |
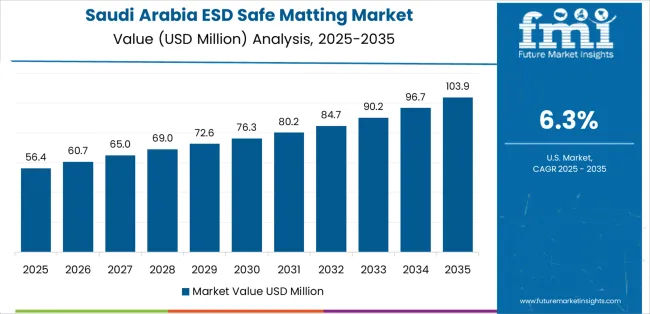
Saudi Arabia establishes fastest market growth through aggressive economic diversification programs and comprehensive electronics manufacturing development, integrating advanced ESD safe matting as standard components in new facility construction and technology cluster installations.
The country's 6.3% growth rate reflects Vision 2030 initiatives promoting electronics manufacturing and domestic technology capabilities that mandate the use of advanced static control systems in manufacturing and healthcare facilities. Growth concentrates in major development zones, including NEOM, King Abdullah Economic City, and Riyadh technology clusters, where electronics infrastructure development showcases integrated ESD protection that appeals to facility operators seeking advanced static control capabilities and compliance management applications.
Saudi manufacturers and facility developers are implementing international-standard ESD solutions that combine certified performance with comprehensive installation support, including grounding system integration and compliance verification capabilities. Distribution channels through industrial equipment suppliers and facility management distributors expand market access, while government support for electronics manufacturing supports adoption across diverse industrial and healthcare segments.
Strategic Market Indicators:
In Bangalore, Hyderabad, and Chennai, electronics manufacturing facilities and semiconductor plants are implementing advanced ESD safe matting as standard equipment for production optimization and quality compliance applications, driven by increasing government PLI scheme investment and manufacturing capacity development programs that emphasize the importance of static control capabilities.
The market holds a 6.2% growth rate, supported by government electronics manufacturing initiatives and infrastructure development programs that promote advanced ESD systems for semiconductor and EMS facilities. Indian operators are adopting matting systems that provide consistent operational performance and compliance features, particularly appealing in technology clusters where production quality and component protection represent critical operational requirements.
Market expansion benefits from growing electronics manufacturing scale and domestic production capabilities that enable cost-effective ESD solutions for manufacturing and assembly applications. Technology adoption follows patterns established in electronics equipment, where certification and performance drive procurement decisions and operational deployment.
Market Intelligence Brief:
In Shenzhen, Shanghai, and Suzhou, electronics manufacturing facilities and cleanroom operations are implementing advanced ESD safe matting as standard equipment for static control and quality management applications, driven by increasing manufacturing scale and facility modernization programs that emphasize the importance of electrostatic protection. The market holds a 5.6% growth rate, supported by continued electronics manufacturing expansion and cleanroom infrastructure development programs that promote advanced ESD systems for production and assembly facilities. Chinese operators are adopting matting systems that provide reliable operational performance and cost-effective compliance features, particularly appealing in high-volume manufacturing regions where production efficiency and quality standards represent critical operational requirements.
Market expansion benefits from massive electronics manufacturing capacity and supply chain integration that enable scaled ESD solutions for diverse manufacturing applications. Technology adoption follows patterns established in facility equipment, where performance and value drive procurement decisions and facility-wide deployment.
Market Intelligence Brief:
Advanced semiconductor technology market in South Korea demonstrates sophisticated ESD safe matting deployment with documented operational effectiveness in fab environments and display manufacturing through integration with existing cleanroom systems and production infrastructure. The country leverages engineering expertise in semiconductor technology and static control integration to maintain a 5.3% growth rate. Manufacturing centers, including Samsung Electronics facilities, SK Hynix operations, and display production lines, showcase premium installations where ESD matting integrates with comprehensive contamination control platforms and facility management systems to optimize production quality and component protection.
Korean manufacturers prioritize fab-grade performance and international compliance in ESD equipment procurement, creating demand for premium systems with advanced features, including ultra-low particle generation and comprehensive grounding integration. The market benefits from established semiconductor technology infrastructure and willingness to invest in advanced static control technologies that provide long-term production benefits and compliance with international manufacturing standards.
Market Intelligence Brief:
United States establishes market leadership through comprehensive ANSI/ESD S20.20 adoption programs and advanced electronics infrastructure development, integrating ESD safe matting across manufacturing and laboratory applications. The country's 4.9% growth rate reflects established electronics industry relationships and mature static control technology adoption that supports widespread use of certified ESD systems in manufacturing and data center facilities. Growth concentrates in major technology centers, including Silicon Valley, Austin technology corridor, and Northeast manufacturing regions, where electronics technology showcases mature ESD deployment that appeals to facility operators seeking proven static control capabilities and compliance verification applications.
American equipment providers leverage established distribution networks and comprehensive certification capabilities, including ANSI/ESD S20.20 validation programs and testing support that create customer relationships and operational advantages. The market benefits from mature industry standards and electronics requirements that mandate ESD matting use while supporting technology advancement and performance optimization.
Market Intelligence Brief:
Advanced automotive technology market in Germany demonstrates sophisticated ESD safe matting deployment with documented operational effectiveness in automotive electronics production and precision assembly through integration with existing quality systems and manufacturing infrastructure. The country leverages engineering expertise in automotive technology and static control integration to maintain a 4.4% growth rate. Industrial centers, including Baden-Württemberg, Bavaria, and Lower Saxony, showcase premium installations where ESD matting integrates with comprehensive manufacturing platforms and facility management systems to optimize production operations and component protection.
German manufacturers prioritize quality certification and compliance in ESD equipment development, creating demand for premium systems with advanced features, including comprehensive testing documentation and facility integration capabilities. The market benefits from established automotive technology infrastructure and willingness to invest in advanced static control technologies that provide long-term operational benefits and compliance with international automotive standards.
Market Intelligence Brief:
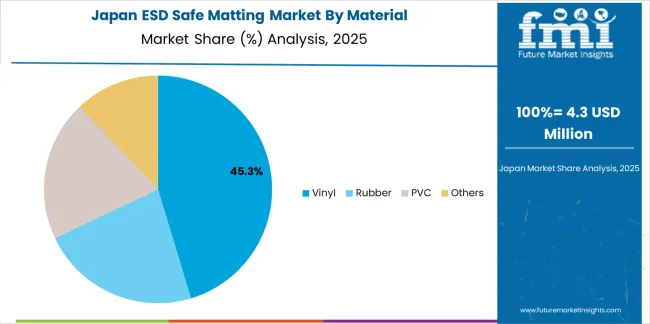
ESD safe matting market in Japan demonstrates sophisticated ESD safe matting deployment with documented operational effectiveness in semiconductor assembly and precision instrument manufacturing through integration with 5S methodology and quality systems. The country maintains a 4.1% growth rate, driven by continued electronics manufacturing excellence and comprehensive static control programs.
Market dynamics focus on premium quality ESD solutions that meet rigorous performance standards and integrate with established manufacturing methodologies. Precision assembly operations create consistent demand for certified matting systems in electronics and instrument manufacturing facilities.
Strategic Market Considerations:
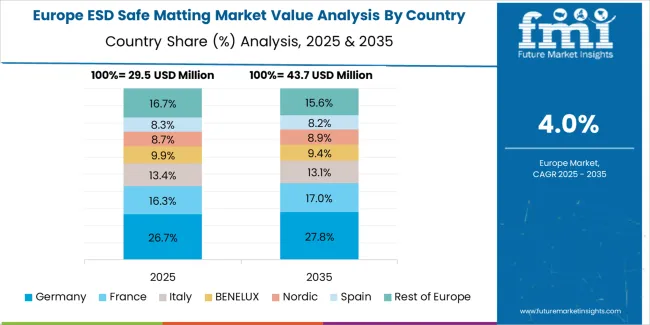
The European ESD safe matting market is projected to grow from USD 40.8 million in 2025 to USD 61.2 million by 2035, registering a CAGR of approximately 4.1% over the forecast period. Germany is expected to lead with a 22.0% market share in 2025, edging to 22.2% by 2035 on automotive electronics and cleanroom upgrades.
United Kingdom holds an 18.0% share in 2025, rising to 18.3% by 2035 with pharma/biotech labs and contract electronics growth. France accounts for a 15.0% share in 2025, reaching 15.2% by 2035 on medical devices and datacenter builds. Italy represents a 12.0% share in 2025, advancing to 12.1% by 2035 via appliance and EMS clusters. Spain stands at a 9.0% share in 2025, reaching 9.1% by 2035 with semiconductor packaging and aerospace labs. Nordics and Benelux together represent a 14.0% share in 2025, advancing to 14.1% by 2035 driven by fabs and battery value chains. Rest of Europe accounts for 10.0% in 2025, adjusting to 9.0% by 2035 amid steady Central and Eastern Europe assembly footprint.
| Stakeholder | What they actually control | Typical strengths | Typical blind spots |
|---|---|---|---|
| Global platforms | Distribution reach, deep product catalogs, testing infrastructure | Broad availability, proven compliance, multi-region support | Innovation speed; customization complexity |
| Material innovators | R&D capabilities; advanced multi-layer systems; ergonomic solutions | Latest technology first; attractive performance differentiation | Distribution density outside core regions; price competition |
| Regional specialists | Local compliance, fast delivery, nearby support | "Close to customer" service; pragmatic pricing; local standards | Technology gaps; certification limitations |
| Certification-focused ecosystems | Testing services, compliance verification, audit support | Lowest compliance friction; comprehensive documentation | Product range limitations; margin pressure |
| Ergonomic specialists | Anti-fatigue technology, worker comfort, safety integration | Differentiated value proposition; expanding addressable market | ESD performance validation; certification complexity |
| Item | Value |
|---|---|
| Quantitative Units | USD 123.6 million |
| Material | Vinyl, Rubber, PVC, Others |
| Product Type | Tabletop mats, Floor mats, Workbench mats, Runners, Others |
| End-use | Electronics manufacturing, Laboratories, Medical & healthcare facilities, Data centers & IT, Other industrial/education |
| Surface Construction | 3-layer static-dissipative, 2-layer static-dissipative, Homogeneous rubber, Foam/anti-fatigue ESD |
| Regions Covered | North America, Latin America, Western Europe, Eastern Europe, East Asia, South Asia Pacific, Middle East & Africa |
| Countries Covered | United States, China, Germany, India, United Kingdom, Japan, South Korea, Saudi Arabia, Canada, Brazil, France, Australia, and 25+ additional countries |
| Key Companies Profiled | Desco (including SCS), ACL Staticide Inc., RS PRO (RS Components), Bertech, COBA Europe, Static Solutions Inc., Transforming Technologies LLC, Botron Company Inc., Wearwell LLC, and Electriduct, Inc. |
| Additional Attributes | Dollar sales by material and product type categories, regional adoption trends across South Asia Pacific, East Asia, and Middle East & Africa, competitive landscape with industrial safety equipment manufacturers and electronics manufacturing suppliers, facility operator preferences for static control performance and system reliability, integration with grounding systems and compliance monitoring platforms, innovations in material technology and conductivity enhancement, and development of ergonomic ESD solutions with enhanced performance and worker comfort optimization capabilities. |
The global esd safe matting market is estimated to be valued at USD 123.6 million in 2025.
The market size for the esd safe matting market is projected to reach USD 195.7 million by 2035.
The esd safe matting market is expected to grow at a 4.7% CAGR between 2025 and 2035.
The key product types in esd safe matting market are vinyl, rubber, pvc and others.
In terms of product type, tabletop mats segment to command 30.0% share in the esd safe matting market in 2025.


Our Research Products

The "Full Research Suite" delivers actionable market intel, deep dives on markets or technologies, so clients act faster, cut risk, and unlock growth.

The Leaderboard benchmarks and ranks top vendors, classifying them as Established Leaders, Leading Challengers, or Disruptors & Challengers.

Locates where complements amplify value and substitutes erode it, forecasting net impact by horizon

We deliver granular, decision-grade intel: market sizing, 5-year forecasts, pricing, adoption, usage, revenue, and operational KPIs—plus competitor tracking, regulation, and value chains—across 60 countries broadly.

Spot the shifts before they hit your P&L. We track inflection points, adoption curves, pricing moves, and ecosystem plays to show where demand is heading, why it is changing, and what to do next across high-growth markets and disruptive tech

Real-time reads of user behavior. We track shifting priorities, perceptions of today’s and next-gen services, and provider experience, then pace how fast tech moves from trial to adoption, blending buyer, consumer, and channel inputs with social signals (#WhySwitch, #UX).

Partner with our analyst team to build a custom report designed around your business priorities. From analysing market trends to assessing competitors or crafting bespoke datasets, we tailor insights to your needs.
Supplier Intelligence
Discovery & Profiling
Capacity & Footprint
Performance & Risk
Compliance & Governance
Commercial Readiness
Who Supplies Whom
Scorecards & Shortlists
Playbooks & Docs
Category Intelligence
Definition & Scope
Demand & Use Cases
Cost Drivers
Market Structure
Supply Chain Map
Trade & Policy
Operating Norms
Deliverables
Buyer Intelligence
Account Basics
Spend & Scope
Procurement Model
Vendor Requirements
Terms & Policies
Entry Strategy
Pain Points & Triggers
Outputs
Pricing Analysis
Benchmarks
Trends
Should-Cost
Indexation
Landed Cost
Commercial Terms
Deliverables
Brand Analysis
Positioning & Value Prop
Share & Presence
Customer Evidence
Go-to-Market
Digital & Reputation
Compliance & Trust
KPIs & Gaps
Outputs
Full Research Suite comprises of:
Market outlook & trends analysis
Interviews & case studies
Strategic recommendations
Vendor profiles & capabilities analysis
5-year forecasts
8 regions and 60+ country-level data splits
Market segment data splits
12 months of continuous data updates
DELIVERED AS:
PDF EXCEL ONLINE
ESD Divider Market Size and Share Forecast Outlook 2025 to 2035
ESD Valve Market Forecast and Outlook 2025 to 2035
ESD Clamshell Market Size and Share Forecast Outlook 2025 to 2035
ESD Trays Market Size and Share Forecast Outlook 2025 to 2035
ESD Protective Signage Labels Market Size and Share Forecast Outlook 2025 to 2035
ESD Totes Market Size and Share Forecast Outlook 2025 to 2035
ESD Foldable Container Market Size and Share Forecast Outlook 2025 to 2035
ESD Tapes and Labels Market from 2025 to 2035
ESD Stackable Box Market Trends & Industry Analysis 2024-2034
ESD Protection Devices Market Insights – Trends & Demand 2023-2033
ESD workstations Market
ESD Suppressors Market
Unidirectional ESD Diode Market Size and Share Forecast Outlook 2025 to 2035
Electrostatic Discharge (ESD) Packaging Market Growth - Forecast 2025 to 2035
Demand for Unidirectional ESD Diode in USA Size and Share Forecast Outlook 2025 to 2035
Safety Label Market Size and Share Forecast Outlook 2025 to 2035
Safety Bottle Tote Carriers Packaging Market Size and Share Forecast Outlook 2025 to 2035
Safeguards for Passenger Transfer Area Market Size and Share Forecast Outlook 2025 to 2035
Safety Towing System Market Size and Share Forecast Outlook 2025 to 2035
Safety Syringe Market Size and Share Forecast Outlook 2025 to 2035

Thank you!
You will receive an email from our Business Development Manager. Please be sure to check your SPAM/JUNK folder too.
Chat With
MaRIA