
- Market Size (2026)
- USD 3.1 Bn
- Forecast (2036)
- USD 4.7 Bn
- CAGR (2026 to 2036)
- 4.1%
How big is the Shisha Tobacco Market in 2026?
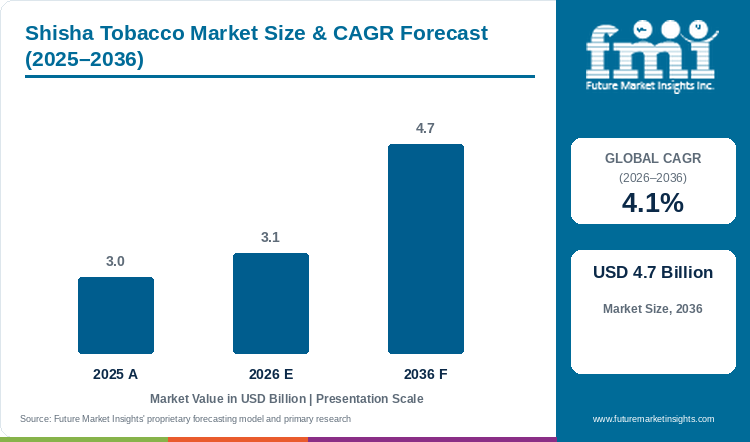
Demand is projected to expand at 4.1% CAGR from 2026 to 2036. Market value rises from USD 3 billion in 2025 to USD 3.1 billion in 2026 and USD 4.7 billion by 2036.
FMI values the shisha tobacco market at USD 3.1 billion in 2026, compared with USD 3 billion in 2025, and projects USD 4.7 billion by 2036 at a 4.1% CAGR. Strong shisha tobacco accounts for 55.0% by product type and fruit flavors represent 45.0% by flavor in 2026, leading their respective commercial classifications. Blend, pack size and distribution arrangements define the product that retailers and venue operators purchase for replenishment, while venues also supply a separate hospitality service. WHO FCTC's October 2025 guide addresses regulation of waterpipes and waterpipe tobacco, placing the category within tobacco-control requirements relevant to product supply and distribution. [2]
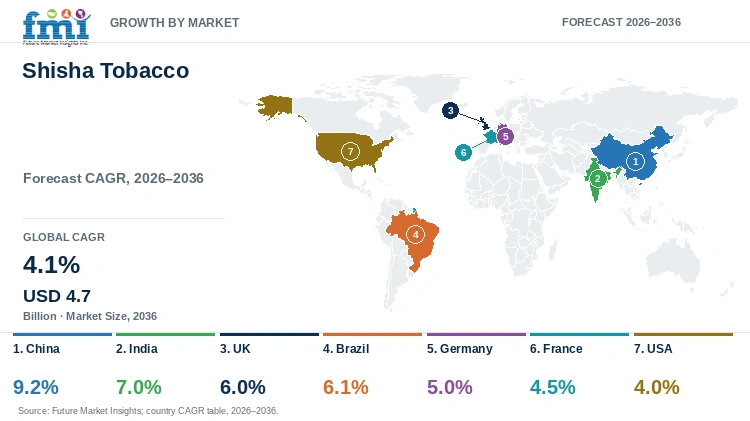
Strength labels describe a commercial category and do not establish uniform nicotine exposure or health outcomes, while flavor descriptions also provide no basis for a lower-risk claim. FDA regulates hookah tobacco in the USA, with applicable requirements shaping product availability and making the actual supplied product relevant to assessment beyond the familiarity of its brand. [3] HMRC guidance includes relevant herbal smoking products within excise treatment, so composition and tax classification need assessment even when a mixture is described as non-tobacco. [4] China has the fastest profiled growth rate at 9.2% CAGR from 2026 to 2036, within a forecast covering several retail and direct sales channels. Suppliers can make their commercial offers clearer through accurate mixture descriptions and destination-specific records, connecting the product purchased with the requirements applying to its distribution.
Key Market Trends and Insights
- Strong shisha tobacco carries 55.0% of the 2026 forecast mix.
- Fruit flavors carry 45.0%. Flavor does not establish a lower-risk product.[2]
- Manufacturers and venues serve different roles.
Regional Highlights
- Fastest-growing profiled market: China at 9.2% CAGR from 2026 to 2036.
- Destination rules affect tobacco-product distribution and excise treatment. The wider tobacco market provides the commercial setting for shisha mixtures; UK duty rules can also cover herbal smoking products. [4]
Market Size and Forecast
Table 1: Market size and forecast for the shisha tobacco market in USD billion and percentage
| Metric | Value |
|---|---|
| 2025 market size | USD 3 billion |
| Estimated market size in 2026 | USD 3.1 billion |
| Projected market size by 2036 | USD 4.7 billion |
| CAGR 2026 to 2036 | 4.1% |
| Added revenue 2026 to 2036 | USD 1.5 billion |
| Market expansion multiple | 1.5x |
Blend and pack changes involve composition records and destination requirements. Tobacco heating sticks follow a different product format, while both categories rely on clear identification of the product being supplied.
Waterpipe Regulation and Product-Classification Evidence
Waterpipe regulation concerns product composition, distribution and tobacco-control requirements. Non-tobacco smoking mixtures have their own product and tax classification, including relevant UK excise treatment. [2][4]
Table 2: Evidence and adoption indicators for the shisha tobacco market
| Indicator | Data point or finding | Commercial relevance | Source |
|---|---|---|---|
| WHO FCTC guide | Published 16 October 2025 | Addresses waterpipe-specific regulation | [2] |
| US product status | FDA regulates hookah tobacco | Creates a defined product obligation | [3] |
| UK excise | Herbal smoking products can be liable to duty | Separates composition from tax treatment | [4] |
Analyst Perspective
"Shisha tobacco purchasing depends on the actual blend, pack and destination requirements, with manufacturers supplying mixtures and venues delivering a separate hospitality offer. Strength and flavor labels help describe a range, but they cannot establish a uniform health-risk profile. Cigar and cigarillos occupy a different tobacco format with their own product conditions. A useful commercial assessment therefore follows the specific mixture through composition records, tax classification and the applicable distribution requirements in the market where it is supplied."
- Rahul Pandita, Principal Consultant, FMI
How is the Shisha Tobacco Market segmented?
The market covers 3 commercial axes and region: product type; flavor; sales channel.
By product type: Strong; Mild; Light.
By flavor: Fruit; Chocolate; Caramel; Mint; Blended; Other flavors.
By sales channel: Direct; Supermarkets; Specialty stores; Convenience stores; Independent stores; Online; Other outlets.
Why does strong shisha tobacco lead demand within the product type category?
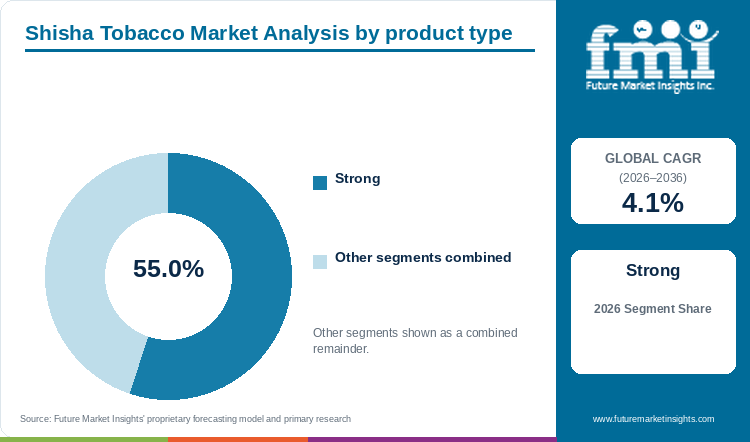
The strong shisha tobacco segment accounts for 55.0% of product type demand in 2026.
Strong shisha tobacco occupies a leading commercial strength category, with retailers and venue operators purchasing defined mixtures and pack formats for their replenishment needs. Accurate composition records help describe what is being supplied and connect the offer with destination-specific tobacco-control requirements. The strength name alone does not establish uniform nicotine exposure or health outcomes, making the actual blend relevant to product assessment. Dissolvable tobacco products represent a separate format within tobacco portfolios, while shisha purchasing remains tied to the mixture and pack intended for waterpipe use. [2]
- Strong shisha tobacco accounts for 55.0% of product type demand in 2026, leading the strength classification that also includes mild and light categories for the supplied tobacco mixtures.
- Retailers and venue operators need composition and destination records for the actual blend and pack, because a commercial strength label does not establish uniform nicotine exposure, health outcomes or lawful availability. [2]
Table 3: Leading product type share for the shisha tobacco market
| Product type | Share in 2026 |
|---|---|
| Strong shisha tobacco | 55.0% |
| Other segments combined | 45.0% |
| Total | 100.0% |
Table 4: Segment leadership and market growth for the shisha tobacco market
| Metric | Value |
|---|---|
| Global CAGR 2026 to 2036 | 4.1% |
| Leading segment | Strong shisha tobacco |
Why do fruit flavors lead demand within the flavor category?
The fruit flavors segment accounts for 45.0% of flavor demand in 2026.
Fruit flavors describe the sensory profile of a mixture and give buyers a way to distinguish offers within a supplier's tobacco range. The commercial choice still involves the actual blend, pack and sales channel, with destination rules determining the conditions under which the product can be supplied. WHO's framework places waterpipe tobacco within tobacco control, so flavor needs to be understood alongside the composition and distribution records of the mixture. A fruit description provides no basis for treating the product as lower risk than other tobacco categories. [2]
- Fruit flavors account for 45.0% of flavor demand in 2026, leading a classification that also includes chocolate, caramel, mint, blended and other flavors within the shisha tobacco product offer.
- A flavor range needs accurate composition records and assessment against destination rules for the supplied mixture, while flavor descriptions remain separate from health-risk assessment and the applicable tobacco-control requirements. [2]
What are the drivers restraints and opportunities in the shisha tobacco market?
- Driver: Retailers and venue operators replenish specified tobacco mixtures, supporting demand for products whose blend and pack formats match the purchase setting while the associated venue activity remains a separate hospitality transaction within the wider offer.
- Restraint: Product-specific tobacco regulation and destination requirements shape the conditions for supply, requiring manufacturers and distributors to assess the actual mixture and pack alongside the WHO waterpipe framework and relevant national rules for hookah tobacco. [2][3]
- Opportunity: Suppliers can improve product clarity through accurate composition and tax records, including assessment of relevant herbal smoking mixtures, because a non-tobacco description does not automatically remove the excise treatment applying to the supplied product. [4]
Defined product replenishment supports the receipt base
Retail and venue operators replenish specified mixtures whose blend choices and pack formats define the commercial offer, connecting the tobacco product purchased with the quantities and product descriptions needed for restocking through the relevant distribution channel.
Tobacco control and excise affect distribution
WHO's waterpipe guide addresses product-specific regulation, while FDA regulates hookah tobacco in the USA, with those applicable frameworks shaping the requirements that suppliers need to assess for the actual mixture and its distribution arrangement. [2][3]
Accurate records can reduce qualification uncertainty
Composition and tax classification need to remain clear for the supplied mixture, with HMRC guidance including relevant herbal smoking products within duty treatment and making the actual classification material even when a product carries a non-tobacco description. [4]
Which country CAGRs are profiled in the Shisha Tobacco Market?
Table 5: Country CAGR comparison for the shisha tobacco market
| Country | CAGR 2026 to 2036 |
|---|---|
| China | 9.2% |
| India | 7.0% |
| UK | 6.0% |
| Brazil | 6.1% |
| Germany | 5.0% |
| France | 4.5% |
| USA | 4.0% |
Country-wise Analysis
China
A distributor introducing a shisha range in China has to connect the commercial description of each blend with its actual composition and pack, because a brand name alone does not define the product supplied to a retailer. China’s outlook records 9.2% CAGR from 2026 to 2036, the highest rate among the profiled markets, as distributors assess the practical supply requirements of a defined range. That expansion gives suppliers a reason to organize product information consistently across flavors and sizes, making repeat orders easier to identify and trace. A venue buying a mixture for its service also needs dependable supply of the selected product, while a shop needs a clear account of the packaged item offered to customers. The WHO FCTC guide treats waterpipe tobacco as a specific subject for regulation, reinforcing the importance of assessing the destination and product together rather than transferring assumptions from another smoking format. [2]
India
Retail distribution and venue purchasing create different demand patterns in India, since a packaged tobacco sale and a lounge’s wider hospitality service involve different inventories and customer transactions. Suppliers need to identify the blend and pack that a repeat order will deliver, allowing the buyer to compare the tobacco product independently of the setting in which it may be used. Within the country outlook, FMI projects 7.0% CAGR from 2026 to 2036, with separate retail and venue needs shaping the product offer. A retailer can assess stock continuity across the selected range, whereas a venue also needs replenishment to fit its operating schedule. Accurate composition records remain relevant to both channels, with the WHO FCTC guide examining regulation specifically for waterpipes and their tobacco. [2] Distribution opportunities therefore depend on a clearly defined product and destination requirements alongside the commercial demand for a particular flavor.
UK
HMRC classifies shisha, including herbal shisha, as other smoking tobacco in its Tobacco Products Duty guidance, making the actual product and mixture important to the UK supply arrangement. [4] A non-tobacco description does not by itself remove the need to assess duty treatment, so importers and distributors need records that identify what the pack contains and how it is supplied. The UK outlook projects 6.0% CAGR from 2026 to 2036, within a supply arrangement that depends on accurate product classification. For buyers, the commercial comparison includes the available blend, pack quantity and a dependable replenishment route, with retailers and venues using the product in different purchasing settings. Suppliers can reduce ambiguity by keeping those descriptions consistent through invoices and product records. That clarity supports an informed distribution decision, particularly when a brand offers tobacco and non-tobacco mixtures under related names.
Brazil
Flavor availability in Brazil depends on the range a distributor can actually supply, making a complete description of the mixture more useful to a buyer than a broad account of social smoking. A retailer needs to identify the packaged product and maintain a consistent assortment, while a venue may place repeat orders around the blend used in its existing service. FMI projects 6.1% CAGR for Brazil from 2026 to 2036, where assortment planning needs to reflect the mixtures available for supply. The WHO FCTC guide addresses waterpipe products and their regulation, giving suppliers a reason to examine the relevant destination requirements for the actual offer. [2] Records covering composition and pack identity can help separate similar-looking products within a brand’s range, allowing a buyer to understand what will arrive with the next order and whether a substituted product changes the commercial arrangement.
Germany
In Germany, the buyer’s assessment of a shisha range starts with the supplied tobacco category, mixture and pack rather than with rules or product descriptions taken from another smoking format. The WHO FCTC’s waterpipe guide provides a specific regulatory context for that distinction, while the commercial offer still needs the product records relevant to its destination. [2] Germany’s outlook records 5.0% CAGR from 2026 to 2036, alongside purchasing decisions that require a clear account of the supplied product. A distributor serving both shops and venues can organize replenishment around the blend and quantity each buyer uses, with accurate identifiers helping avoid confusion between flavors or pack sizes. Maintaining a defined assortment also makes changes easier to explain when a supplier replaces an item. The opportunity rests on consistent product supply and clear documentation, allowing the buyer to evaluate the mixture and purchasing terms together.
France
A French venue purchasing shisha tobacco is buying a mixture that forms one part of a wider service, whereas a retailer offers a packaged product as the customer’s direct purchase. Keeping those roles distinct helps suppliers understand how ordering frequency, pack quantity and assortment requirements can differ between channels. FMI forecasts 4.5% CAGR for France from 2026 to 2036, with the tobacco purchase forming a distinct part of the wider venue offer. For a distributor, the practical task is to maintain clear composition and product identity across the selected range, particularly when flavors have similar names but different mixtures. Waterpipe-specific regulatory assessment also remains relevant, as described in the WHO FCTC guide. [2] Buyers can then compare the product available for repeat supply with the terms of the transaction, rather than infer availability or suitability from the prominence of a brand or a general account of lounge demand.
USA
FDA’s hookah-tobacco guidance identifies requirements affecting manufacturers and retailers in the USA, making the status of the particular product important when a distributor considers a brand’s range. [3] A broad brand portfolio does not establish the same position for every blend, so the supplied item and the supporting records need to be considered together. The USA outlook projects 4.0% CAGR from 2026 to 2036, within purchasing decisions that depend on the product and its supporting records. Buyers also need a clear description of pack quantity and composition, with a venue’s repeat supply requirements differing from a shop’s packaged assortment. Maintaining accurate product identifiers helps a distributor trace orders and explain changes within the range. The commercial opportunity therefore involves dependable supply of a defined product alongside the applicable requirements, allowing customers to assess the actual offer without relying on a general claim about the brand’s presence.
Who are the notable companies in the Shisha Tobacco Market?
Al Fakher; Fumari; Starbuzz; Haze Tobacco; Social Smoke
Competitive Benchmarking
Table 6: Competitive positioning for the shisha tobacco market
| Company or institution | Positioning | Evidence or purchasing distinction |
|---|---|---|
| Al Fakher | Shisha-tobacco manufacturer | Product records determine the distribution boundary |
| Fumari | Shisha-tobacco products | Composition and destination qualification |
| Starbuzz | Shisha-tobacco products | Shisha-tobacco product range |
| Haze Tobacco | Shisha-tobacco range | Official shop documents tobacco flavor products. [5] |
| Social Smoke | Hookah-tobacco range | Official tobacco category lists products under the Social Smoke brand. [6] |
Key Developments in the Shisha Tobacco Market
- WHO FCTC published its waterpipe-regulation guide in October 2025, providing a product-specific framework for drafting tobacco-control rules relevant to waterpipes, waterpipe tobacco and the supply arrangements under which these products reach their intended markets. [2]
- HMRC's tobacco-products duty guidance includes relevant herbal smoking products within excise treatment, making the actual composition and classification of a mixture material to its supply even when the product is described as non-tobacco. [4]
Key Players in the Shisha Tobacco Market
Al Fakher; Fumari; Haze Tobacco; Social Smoke; Starbuzz; Mazaya; Nakhla; Al Waha.
Shisha Tobacco Market Report Scope
The market covers strong, mild and light shisha tobacco by flavor and sales channel. Strength names are commercial descriptions; tobacco mixtures, non-tobacco mixtures and venue services have different product and transaction boundaries.
Table 7: Report coverage for the shisha tobacco market
| Coverage field | Report scope |
|---|---|
| Market breakdown | Product type; Flavor; Sales channel; region |
| Quantitative units | USD billion |
| Market definition | Shisha tobacco mixtures by commercial type and flavor. Hardware and venue services are excluded. Non-tobacco products are identified separately. |
| Regions covered | North America; Latin America; Western Europe; Eastern Europe; East Asia; South Asia and Pacific; Middle East and Africa |
| Countries profiled | China; India; UK; Brazil; Germany; France; USA |
| Key companies profiled | Al Fakher; Fumari; Haze Tobacco; Social Smoke; Starbuzz; Mazaya; Nakhla; Al Waha |
| Forecast period | 2026 to 2036 |
Shisha Tobacco Market Research Methodology
Table 8: Research methods for the shisha tobacco market
| Method | Approach |
|---|---|
| Market definition | The study examines the shisha tobacco market through product type, flavor and sales channel, identifying the products or services and purchasing transactions covered. |
| Public documentary research | FMI market research, WHO FCTC guidance, FDA information, HMRC excise guidance and official company product pages inform the analysis of product characteristics, operating conditions and market context. |
| Company portfolio research | Official product pages and company disclosures describe relevant offerings, intended customers and participation within wider business portfolios. |
| Segment assessment | The product type, flavor and sales channel categories are examined through product or service characteristics, practical use and purchase conditions. |
| Country research | Local distribution, purchasing arrangements and applicable public requirements inform country analysis alongside the reported market outlook. |
| Regulatory and technical assessment | Tobacco composition, pack formats and destination requirements are examined together, with commercial strength and flavor descriptions kept separate from health-risk attributes. |
| Forecast coverage | The forecast considers the demand drivers, purchasing constraints and supplier opportunities affecting the market across the study period. |
Shisha Tobacco Market by Segments
By product type
- Strong
- Mild
- Light
By flavor
- Fruit
- Chocolate
- Caramel
- Mint
- Blended
- Other flavors
By sales channel
- Direct
- Supermarkets
- Specialty stores
- Convenience stores
- Independent stores
- Online
- Other outlets
Shisha Tobacco Market by Region
- North America
- USA
- Canada
- Latin America
- Brazil
- Mexico
- Argentina
- Chile
- Western Europe
- Germany
- France
- UK
- Italy
- Spain
- Benelux
- Nordics
- Eastern Europe
- Poland
- Czech Republic
- Romania
- Hungary
- East Asia
- China
- Japan
- South Korea
- South Asia and Pacific
- India
- ASEAN
- Australia and New Zealand
- Middle East and Africa
- GCC countries
- South Africa
- Türkiye
- Israel
Research Sources and Bibliography
- [1] WHO Framework Convention on Tobacco Control Secretariat. 16 October 2025. Waterpipes waterpipe tobacco and waterpipe tobacco smoking: guide to drafting regulation.
- [2] US Food and Drug Administration. Accessed October 2026. Hookah Tobacco Shisha or Waterpipe Tobacco.
- [3] HM Revenue and Customs. Accessed October 2026. Excise Notice 476 Tobacco Products Duty.
- [4] Haze Tobacco. Accessed October 2026. Tobacco Flavours.
- [5] Social Smoke. Accessed October 2026. Social Smoke Tobacco.
This Report Answers
- How big is the shisha tobacco market in 2026?
- What market value is projected by 2036?
- Which product type segment leads demand?
- Which other commercial categories shape the market?
- Which countries have the fastest profiled growth?
- Which companies and institutions participate in the market?
Table of Content
Table of Content
- Key Takeaways
- Market Size and CAGR
- Top Growth Driver
- Fastest Growing Segment
- Leading Region
- Key Companies
- Emerging Opportunities
- Executive Summary
- Global Market Outlook
- Demand-side Trends
- Supply-side Trends
- Technology Roadmap Analysis
- Analysis and Recommendations
- Analyst Perspective (What is happening? Why now? What should investors know?)
- Key Questions Answered
- How large is the market?
- What is the CAGR?
- What are key trends?
- Which region dominates?
- Who are the leaders?
Read More...
- Market Overview
- Market Coverage / Taxonomy
- Market Definition / Scope / Limitations
- Research Methodology
- Chapter Orientation
- Analytical Lens and Working Hypotheses
- Market Structure, Signals, and Trend Drivers
- Benchmarking and Cross-market Comparability
- Market Sizing, Forecasting, and Opportunity Mapping
- Research Design and Evidence Framework
- Desk Research Programme (Secondary Evidence)
- Expert Input and Fieldwork (Primary Evidence)
- Tooling, Models, and Reference Databases
- Data Engineering and Model Build
- Quality Assurance and Audit Trail
- Market Background
- Market Dynamics (Drivers, Restraints, Opportunity, Trends)
- Scenario Forecast (Optimistic, Likely, Conservative)
- Impact Analysis
- AI Impact
- Sustainability Impact
- Regulatory Impact
- Technology Impact
- Consumer / Buyer Analysis
- Purchase Drivers
- Adoption Barriers
- Buyer Journey
- Opportunity Map Analysis
- Product Life Cycle Analysis
- Supply Chain Analysis
- Investment Feasibility Matrix
- Value Chain Analysis
- PESTLE and Porter's Analysis
- Regulatory Landscape
- Regional Parent Market Outlook
- Production and Consumption Statistics
- Import and Export Statistics
- Global Market Analysis and Forecast, 2021 to 2036
- Historical Market Size Value (USD Billion) Analysis, 2021 to 2025
- Current and Future Market Size Value (USD Billion) Projections, 2026 to 2036
- Y-o-Y Growth Trend Analysis
- Absolute $ Opportunity Analysis
- Global Market Pricing Analysis, 2021 to 2036
- Global Market Analysis and Forecast, By product type, 2021 to 2036
- Introduction / Key Findings
- Historical Market Size Value (USD Billion) Analysis By product type, 2021 to 2025
- Current and Future Market Size Value (USD Billion) Analysis and Forecast By product type, 2026 to 2036
- Strong
- Mild
- Light
- Y-o-Y Growth Trend Analysis By product type, 2021 to 2025
- Absolute $ Opportunity Analysis By product type, 2026 to 2036
- Global Market Analysis and Forecast, By flavor, 2021 to 2036
- Introduction / Key Findings
- Historical Market Size Value (USD Billion) Analysis By flavor, 2021 to 2025
- Current and Future Market Size Value (USD Billion) Analysis and Forecast By flavor, 2026 to 2036
- Fruit
- Chocolate
- Caramel
- Mint
- Blended
- Other flavors
- Y-o-Y Growth Trend Analysis By flavor, 2021 to 2025
- Absolute $ Opportunity Analysis By flavor, 2026 to 2036
- Global Market Analysis and Forecast, By sales channel, 2021 to 2036
- Introduction / Key Findings
- Historical Market Size Value (USD Billion) Analysis By sales channel, 2021 to 2025
- Current and Future Market Size Value (USD Billion) Analysis and Forecast By sales channel, 2026 to 2036
- Direct
- Supermarkets
- Specialty stores
- Convenience stores
- Independent stores
- Online
- Other outlets
- Y-o-Y Growth Trend Analysis By sales channel, 2021 to 2025
- Absolute $ Opportunity Analysis By sales channel, 2026 to 2036
- Global Market Analysis and Forecast, By Region, 2021 to 2036
- Introduction
- Historical Market Size Value (USD Billion) Analysis By Region, 2021 to 2025
- Current Market Size Value (USD Billion) Analysis and Forecast By Region, 2026 to 2036
- North America
- Latin America
- Western Europe
- Eastern Europe
- East Asia
- South Asia and Pacific
- Middle East and Africa
- Market Attractiveness Analysis By Region
- North America Market Analysis and Forecast, By Country, 2021 to 2036
- Historical Market Size Value (USD Billion) Trend Analysis By Market Taxonomy, 2021 to 2025
- Market Size Value (USD Billion) Forecast By Market Taxonomy, 2026 to 2036
- By Country
- USA
- Canada
- By product type
- By flavor
- By sales channel
- By Country
- Market Attractiveness Analysis
- By Country
- By product type
- By flavor
- By sales channel
- Key Takeaways
- Latin America Market Analysis and Forecast, By Country
- Historical Market Size Value (USD Billion) Trend Analysis By Market Taxonomy, 2021 to 2025
- Market Size Value (USD Billion) Forecast By Market Taxonomy, 2026 to 2036
- By Country
- Brazil
- Mexico
- Argentina
- Chile
- By product type
- By flavor
- By sales channel
- By Country
- Market Attractiveness Analysis
- By Country
- By product type
- By flavor
- By sales channel
- Key Takeaways
- Western Europe Market Analysis and Forecast, By Country
- Historical Market Size Value (USD Billion) Trend Analysis By Market Taxonomy, 2021 to 2025
- Market Size Value (USD Billion) Forecast By Market Taxonomy, 2026 to 2036
- By Country
- Germany
- France
- UK
- Italy
- Spain
- Benelux
- Nordics
- By product type
- By flavor
- By sales channel
- By Country
- Market Attractiveness Analysis
- By Country
- By product type
- By flavor
- By sales channel
- Key Takeaways
- Eastern Europe Market Analysis and Forecast, By Country
- Historical Market Size Value (USD Billion) Trend Analysis By Market Taxonomy, 2021 to 2025
- Market Size Value (USD Billion) Forecast By Market Taxonomy, 2026 to 2036
- By Country
- Poland
- Czech Republic
- Romania
- Hungary
- By product type
- By flavor
- By sales channel
- By Country
- Market Attractiveness Analysis
- By Country
- By product type
- By flavor
- By sales channel
- Key Takeaways
- East Asia Market Analysis and Forecast, By Country
- Historical Market Size Value (USD Billion) Trend Analysis By Market Taxonomy, 2021 to 2025
- Market Size Value (USD Billion) Forecast By Market Taxonomy, 2026 to 2036
- By Country
- China
- Japan
- South Korea
- By product type
- By flavor
- By sales channel
- By Country
- Market Attractiveness Analysis
- By Country
- By product type
- By flavor
- By sales channel
- Key Takeaways
- South Asia and Pacific Market Analysis and Forecast, By Country
- Historical Market Size Value (USD Billion) Trend Analysis By Market Taxonomy, 2021 to 2025
- Market Size Value (USD Billion) Forecast By Market Taxonomy, 2026 to 2036
- By Country
- India
- ASEAN
- Australia and New Zealand
- By product type
- By flavor
- By sales channel
- By Country
- Market Attractiveness Analysis
- By Country
- By product type
- By flavor
- By sales channel
- Key Takeaways
- Middle East and Africa Market Analysis and Forecast, By Country
- Historical Market Size Value (USD Billion) Trend Analysis By Market Taxonomy, 2021 to 2025
- Market Size Value (USD Billion) Forecast By Market Taxonomy, 2026 to 2036
- By Country
- GCC countries
- South Africa
- Türkiye
- Israel
- By product type
- By flavor
- By sales channel
- By Country
- Market Attractiveness Analysis
- By Country
- By product type
- By flavor
- By sales channel
- Key Takeaways
- Key Countries Market Analysis
- USA
- Pricing Analysis
- Market Share Analysis, 2025
- By product type
- By flavor
- By sales channel
- Canada
- Pricing Analysis
- Market Share Analysis, 2025
- By product type
- By flavor
- By sales channel
- Mexico
- Pricing Analysis
- Market Share Analysis, 2025
- By product type
- By flavor
- By sales channel
- Brazil
- Pricing Analysis
- Market Share Analysis, 2025
- By product type
- By flavor
- By sales channel
- Chile
- Pricing Analysis
- Market Share Analysis, 2025
- By product type
- By flavor
- By sales channel
- Germany
- Pricing Analysis
- Market Share Analysis, 2025
- By product type
- By flavor
- By sales channel
- UK
- Pricing Analysis
- Market Share Analysis, 2025
- By product type
- By flavor
- By sales channel
- Italy
- Pricing Analysis
- Market Share Analysis, 2025
- By product type
- By flavor
- By sales channel
- Spain
- Pricing Analysis
- Market Share Analysis, 2025
- By product type
- By flavor
- By sales channel
- France
- Pricing Analysis
- Market Share Analysis, 2025
- By product type
- By flavor
- By sales channel
- India
- Pricing Analysis
- Market Share Analysis, 2025
- By product type
- By flavor
- By sales channel
- ASEAN
- Pricing Analysis
- Market Share Analysis, 2025
- By product type
- By flavor
- By sales channel
- Australia and New Zealand
- Pricing Analysis
- Market Share Analysis, 2025
- By product type
- By flavor
- By sales channel
- China
- Pricing Analysis
- Market Share Analysis, 2025
- By product type
- By flavor
- By sales channel
- Japan
- Pricing Analysis
- Market Share Analysis, 2025
- By product type
- By flavor
- By sales channel
- South Korea
- Pricing Analysis
- Market Share Analysis, 2025
- By product type
- By flavor
- By sales channel
- Poland
- Pricing Analysis
- Market Share Analysis, 2025
- By product type
- By flavor
- By sales channel
- Hungary
- Pricing Analysis
- Market Share Analysis, 2025
- By product type
- By flavor
- By sales channel
- Türkiye
- Pricing Analysis
- Market Share Analysis, 2025
- By product type
- By flavor
- By sales channel
- South Africa
- Pricing Analysis
- Market Share Analysis, 2025
- By product type
- By flavor
- By sales channel
- USA
- Market Structure Analysis
- Competition Dashboard
- Competition Benchmarking
- Market Share Analysis of Top Players
- By Regional
- By product type
- By flavor
- By sales channel
- Emerging Startups
- Innovation Benchmarking
- Competition Analysis
- Competition Deep Dive
- Al Fakher
- Overview
- Product Portfolio
- Profitability by Market Segments
- Sales Footprint
- Strategy Overview
- Marketing Strategy
- Product Strategy
- Channel Strategy
- Fumari
- Starbuzz
- Haze Tobacco
- Social Smoke
- Al Fakher
- Case Studies
- Success Stories
- Recent Developments
- Competition Deep Dive
- Assumptions & Acronyms Used
List of Tables
- Table 1: Global Market Value (USD Billion) Forecast by Region, 2021 to 2036
- Table 2: Global Market Value (USD Billion) Forecast by product type, 2021 to 2036
- Table 3: Global Market Value (USD Billion) Forecast by flavor, 2021 to 2036
- Table 4: Global Market Value (USD Billion) Forecast by sales channel, 2021 to 2036
- Table 5: North America Market Value (USD Billion) Forecast by Country, 2021 to 2036
- Table 6: North America Market Value (USD Billion) Forecast by product type, 2021 to 2036
- Table 7: North America Market Value (USD Billion) Forecast by flavor, 2021 to 2036
- Table 8: North America Market Value (USD Billion) Forecast by sales channel, 2021 to 2036
- Table 9: Latin America Market Value (USD Billion) Forecast by Country, 2021 to 2036
- Table 10: Latin America Market Value (USD Billion) Forecast by product type, 2021 to 2036
- Table 11: Latin America Market Value (USD Billion) Forecast by flavor, 2021 to 2036
- Table 12: Latin America Market Value (USD Billion) Forecast by sales channel, 2021 to 2036
- Table 13: Western Europe Market Value (USD Billion) Forecast by Country, 2021 to 2036
- Table 14: Western Europe Market Value (USD Billion) Forecast by product type, 2021 to 2036
- Table 15: Western Europe Market Value (USD Billion) Forecast by flavor, 2021 to 2036
- Table 16: Western Europe Market Value (USD Billion) Forecast by sales channel, 2021 to 2036
- Table 17: Eastern Europe Market Value (USD Billion) Forecast by Country, 2021 to 2036
- Table 18: Eastern Europe Market Value (USD Billion) Forecast by product type, 2021 to 2036
- Table 19: Eastern Europe Market Value (USD Billion) Forecast by flavor, 2021 to 2036
- Table 20: Eastern Europe Market Value (USD Billion) Forecast by sales channel, 2021 to 2036
- Table 21: East Asia Market Value (USD Billion) Forecast by Country, 2021 to 2036
- Table 22: East Asia Market Value (USD Billion) Forecast by product type, 2021 to 2036
- Table 23: East Asia Market Value (USD Billion) Forecast by flavor, 2021 to 2036
- Table 24: East Asia Market Value (USD Billion) Forecast by sales channel, 2021 to 2036
- Table 25: South Asia and Pacific Market Value (USD Billion) Forecast by Country, 2021 to 2036
- Table 26: South Asia and Pacific Market Value (USD Billion) Forecast by product type, 2021 to 2036
- Table 27: South Asia and Pacific Market Value (USD Billion) Forecast by flavor, 2021 to 2036
- Table 28: South Asia and Pacific Market Value (USD Billion) Forecast by sales channel, 2021 to 2036
- Table 29: Middle East and Africa Market Value (USD Billion) Forecast by Country, 2021 to 2036
- Table 30: Middle East and Africa Market Value (USD Billion) Forecast by product type, 2021 to 2036
- Table 31: Middle East and Africa Market Value (USD Billion) Forecast by flavor, 2021 to 2036
- Table 32: Middle East and Africa Market Value (USD Billion) Forecast by sales channel, 2021 to 2036
List of Figures
- Figure 1: Global Market Pricing Analysis
- Figure 2: Global Market Value (USD Billion) Forecast 2021-2036
- Figure 3: Global Market Value Share and BPS Analysis by product type, 2026 and 2036
- Figure 4: Global Market Y-o-Y Growth Comparison by product type, 2026-2036
- Figure 5: Global Market Attractiveness Analysis by product type
- Figure 6: Global Market Value Share and BPS Analysis by flavor, 2026 and 2036
- Figure 7: Global Market Y-o-Y Growth Comparison by flavor, 2026-2036
- Figure 8: Global Market Attractiveness Analysis by flavor
- Figure 9: Global Market Value Share and BPS Analysis by sales channel, 2026 and 2036
- Figure 10: Global Market Y-o-Y Growth Comparison by sales channel, 2026-2036
- Figure 11: Global Market Attractiveness Analysis by sales channel
- Figure 12: Global Market Value (USD Billion) Share and BPS Analysis by Region, 2026 and 2036
- Figure 13: Global Market Y-o-Y Growth Comparison by Region, 2026-2036
- Figure 14: Global Market Attractiveness Analysis by Region
- Figure 15: North America Market Incremental Dollar Opportunity, 2026-2036
- Figure 16: Latin America Market Incremental Dollar Opportunity, 2026-2036
- Figure 17: Western Europe Market Incremental Dollar Opportunity, 2026-2036
- Figure 18: Eastern Europe Market Incremental Dollar Opportunity, 2026-2036
- Figure 19: East Asia Market Incremental Dollar Opportunity, 2026-2036
- Figure 20: South Asia and Pacific Market Incremental Dollar Opportunity, 2026-2036
- Figure 21: Middle East and Africa Market Incremental Dollar Opportunity, 2026-2036
- Figure 22: North America Market Value Share and BPS Analysis by Country, 2026 and 2036
- Figure 23: North America Market Value Share and BPS Analysis by product type, 2026 and 2036
- Figure 24: North America Market Y-o-Y Growth Comparison by product type, 2026-2036
- Figure 25: North America Market Attractiveness Analysis by product type
- Figure 26: North America Market Value Share and BPS Analysis by flavor, 2026 and 2036
- Figure 27: North America Market Y-o-Y Growth Comparison by flavor, 2026-2036
- Figure 28: North America Market Attractiveness Analysis by flavor
- Figure 29: North America Market Value Share and BPS Analysis by sales channel, 2026 and 2036
- Figure 30: North America Market Y-o-Y Growth Comparison by sales channel, 2026-2036
- Figure 31: North America Market Attractiveness Analysis by sales channel
- Figure 32: Latin America Market Value Share and BPS Analysis by Country, 2026 and 2036
- Figure 33: Latin America Market Value Share and BPS Analysis by product type, 2026 and 2036
- Figure 34: Latin America Market Y-o-Y Growth Comparison by product type, 2026-2036
- Figure 35: Latin America Market Attractiveness Analysis by product type
- Figure 36: Latin America Market Value Share and BPS Analysis by flavor, 2026 and 2036
- Figure 37: Latin America Market Y-o-Y Growth Comparison by flavor, 2026-2036
- Figure 38: Latin America Market Attractiveness Analysis by flavor
- Figure 39: Latin America Market Value Share and BPS Analysis by sales channel, 2026 and 2036
- Figure 40: Latin America Market Y-o-Y Growth Comparison by sales channel, 2026-2036
- Figure 41: Latin America Market Attractiveness Analysis by sales channel
- Figure 42: Western Europe Market Value Share and BPS Analysis by Country, 2026 and 2036
- Figure 43: Western Europe Market Value Share and BPS Analysis by product type, 2026 and 2036
- Figure 44: Western Europe Market Y-o-Y Growth Comparison by product type, 2026-2036
- Figure 45: Western Europe Market Attractiveness Analysis by product type
- Figure 46: Western Europe Market Value Share and BPS Analysis by flavor, 2026 and 2036
- Figure 47: Western Europe Market Y-o-Y Growth Comparison by flavor, 2026-2036
- Figure 48: Western Europe Market Attractiveness Analysis by flavor
- Figure 49: Western Europe Market Value Share and BPS Analysis by sales channel, 2026 and 2036
- Figure 50: Western Europe Market Y-o-Y Growth Comparison by sales channel, 2026-2036
- Figure 51: Western Europe Market Attractiveness Analysis by sales channel
- Figure 52: Eastern Europe Market Value Share and BPS Analysis by Country, 2026 and 2036
- Figure 53: Eastern Europe Market Value Share and BPS Analysis by product type, 2026 and 2036
- Figure 54: Eastern Europe Market Y-o-Y Growth Comparison by product type, 2026-2036
- Figure 55: Eastern Europe Market Attractiveness Analysis by product type
- Figure 56: Eastern Europe Market Value Share and BPS Analysis by flavor, 2026 and 2036
- Figure 57: Eastern Europe Market Y-o-Y Growth Comparison by flavor, 2026-2036
- Figure 58: Eastern Europe Market Attractiveness Analysis by flavor
- Figure 59: Eastern Europe Market Value Share and BPS Analysis by sales channel, 2026 and 2036
- Figure 60: Eastern Europe Market Y-o-Y Growth Comparison by sales channel, 2026-2036
- Figure 61: Eastern Europe Market Attractiveness Analysis by sales channel
- Figure 62: East Asia Market Value Share and BPS Analysis by Country, 2026 and 2036
- Figure 63: East Asia Market Value Share and BPS Analysis by product type, 2026 and 2036
- Figure 64: East Asia Market Y-o-Y Growth Comparison by product type, 2026-2036
- Figure 65: East Asia Market Attractiveness Analysis by product type
- Figure 66: East Asia Market Value Share and BPS Analysis by flavor, 2026 and 2036
- Figure 67: East Asia Market Y-o-Y Growth Comparison by flavor, 2026-2036
- Figure 68: East Asia Market Attractiveness Analysis by flavor
- Figure 69: East Asia Market Value Share and BPS Analysis by sales channel, 2026 and 2036
- Figure 70: East Asia Market Y-o-Y Growth Comparison by sales channel, 2026-2036
- Figure 71: East Asia Market Attractiveness Analysis by sales channel
- Figure 72: South Asia and Pacific Market Value Share and BPS Analysis by Country, 2026 and 2036
- Figure 73: South Asia and Pacific Market Value Share and BPS Analysis by product type, 2026 and 2036
- Figure 74: South Asia and Pacific Market Y-o-Y Growth Comparison by product type, 2026-2036
- Figure 75: South Asia and Pacific Market Attractiveness Analysis by product type
- Figure 76: South Asia and Pacific Market Value Share and BPS Analysis by flavor, 2026 and 2036
- Figure 77: South Asia and Pacific Market Y-o-Y Growth Comparison by flavor, 2026-2036
- Figure 78: South Asia and Pacific Market Attractiveness Analysis by flavor
- Figure 79: South Asia and Pacific Market Value Share and BPS Analysis by sales channel, 2026 and 2036
- Figure 80: South Asia and Pacific Market Y-o-Y Growth Comparison by sales channel, 2026-2036
- Figure 81: South Asia and Pacific Market Attractiveness Analysis by sales channel
- Figure 82: Middle East and Africa Market Value Share and BPS Analysis by Country, 2026 and 2036
- Figure 83: Middle East and Africa Market Value Share and BPS Analysis by product type, 2026 and 2036
- Figure 84: Middle East and Africa Market Y-o-Y Growth Comparison by product type, 2026-2036
- Figure 85: Middle East and Africa Market Attractiveness Analysis by product type
- Figure 86: Middle East and Africa Market Value Share and BPS Analysis by flavor, 2026 and 2036
- Figure 87: Middle East and Africa Market Y-o-Y Growth Comparison by flavor, 2026-2036
- Figure 88: Middle East and Africa Market Attractiveness Analysis by flavor
- Figure 89: Middle East and Africa Market Value Share and BPS Analysis by sales channel, 2026 and 2036
- Figure 90: Middle East and Africa Market Y-o-Y Growth Comparison by sales channel, 2026-2036
- Figure 91: Middle East and Africa Market Attractiveness Analysis by sales channel
- Figure 92: Global Market - Tier Structure Analysis
- Figure 93: Global Market - Company Share Analysis
Frequently Asked Questions
How large is the Shisha Tobacco Market in 2026?
FMI estimates market value at USD 3.1 billion in 2026. The estimated 2025 value is USD 3 billion.
What value and CAGR are projected through 2036?
Market value is projected to reach USD 4.7 billion by 2036 at a 4.1% CAGR from 2026 to 2036.
Which product type segment leads in 2026?
Strong shisha tobacco accounts for 55.0% of this category.
What is the report segmentation?
Product type; Flavor; Sales channel, and region.
Which profiled market records the highest CAGR?
China has the highest profiled rate at 9.2% from 2026 to 2036.
Who are the key participants?
Al Fakher; Fumari; Haze Tobacco; Social Smoke; Starbuzz; Mazaya; Nakhla; Al Waha.
Preview the report firsthand - request a free sample
Get SampleGet the brochure for pricing and purchase details.
Get PDF
