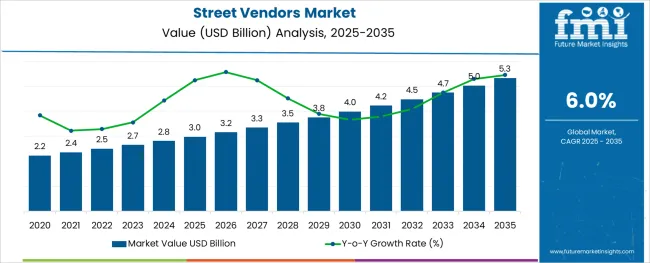
The Street Vendors Market is estimated to be valued at USD 3.0 billion in 2025 and is projected to reach USD 5.3 billion by 2035, registering a compound annual growth rate (CAGR) of 6.0% over the forecast period.

The webbing cutting machine market is witnessing notable growth as industries including automotive, apparel, military, and packaging increasingly depend on precision fabric cutting technologies to improve productivity and reduce material waste. Automation has become central to the evolution of these machines, as manufacturers seek to enhance output consistency, minimize human error, and meet diverse order specifications with minimal downtime.
The demand for faster changeovers, smart control systems, and digitally calibrated feed mechanisms is accelerating, particularly in high-mix production environments. Additionally, integration with vision systems and programmable logic controls is enabling manufacturers to achieve tighter tolerances across various textile and synthetic materials.
Emerging application areas such as wearable technology and smart textiles are also encouraging investment in highly adaptable cutting equipment. As global supply chains become more reliant on efficiency and precision, future growth will be shaped by machines that offer high throughput, minimal material degradation, and compatibility with sustainable production practices.
The market is segmented by Vendor Type, Area, and Commodity and region. By Vendor Type, the market is divided into Stationary, Peripatetic, and Mobile. In terms of Area, the market is classified into Urban, Suburban, and Rural. Based on Commodity, the market is segmented into Food, Cosmetics, Clothing, Daily necessities, and Others.
Regionally, the market is classified into North America, Latin America, Western Europe, Eastern Europe, Balkan & Baltic Countries, Russia & Belarus, Central Asia, East Asia, South Asia & Pacific, and the Middle East & Africa.
The automatic segment is projected to command 63.50% of the total market revenue in 2025, establishing it as the dominant category within the automation segment. This leadership is driven by increasing demand for machines that offer continuous operation with minimal manual intervention.
Automatic webbing cutting machines are equipped with features such as digital length setting, heat sealing, and tension control, which enhance cutting accuracy and reduce edge fraying. These machines are particularly valued for their role in streamlining operations in mass production environments, where high repeatability and reduced setup time are critical.
With rising labor costs and the need for lean manufacturing, adoption of automatic systems has accelerated across both established and emerging economies. Furthermore, their ability to integrate into larger production lines and support smart factory initiatives has reinforced their position as the preferred automation type in the webbing cutting machine market.
The 50 to 100 meter per minute capacity range is anticipated to hold 42.70% of market revenue in 2025, making it the leading segment by capacity. This range has emerged as the optimal balance between operational speed and control, particularly in industries requiring mid-volume production with high dimensional accuracy.
Machines in this capacity bracket are favored for their versatility, enabling manufacturers to process a wide variety of webbings such as nylon, polyester, and cotton with consistent quality. Their compatibility with both manual and automated feeding systems has further expanded their utility across small and medium-sized enterprises.
Additionally, lower energy consumption and compact machine footprints make them suitable for space-constrained production floors. These characteristics have led to widespread adoption, particularly in textile and accessories manufacturing, positioning this capacity range as the most commercially viable in the segment.
In the application segment, tapes are expected to account for 24.60% of total market revenue in 2025, making it the leading application area for webbing cutting machines. This growth is being propelled by the expanding use of woven and non-woven tapes in sectors such as automotive interiors, safety equipment, apparel reinforcement, and packaging. Precision and clean-edge cutting are critical in tape production, especially when dealing with specialty adhesives, heat-sensitive fabrics, and reflective materials.
Webbing cutting machines designed for tape applications often feature hot knife or ultrasonic options to meet these requirements. The increasing demand for customized widths, batch production flexibility, and high-speed order fulfillment has driven adoption in this segment.
Moreover, advancements in coating and lamination techniques have created new performance expectations, which these machines are being designed to meet. As tape usage diversifies across industries, its status as a core application for webbing cutters is expected to remain strong.
The ability to easily access a wide variety of goods and services in public areas is made possible by street vendors, who play an essential role in urban economies all over the world. Street sellers are crucial to the nation's economy even though they are regarded as unofficial.
Street vending is very important for generating cash, producing goods, and creating jobs. Their strong marketing strategy frequently aids in their market penetration. Many market analysts have questioned their existence and labeled them as a danger to the city. These encroachers frequently endure administrative tyranny.
They have a strong community that provides millions of people with jobs and contributes significantly to municipal revenues through road fees, fines from civic authorities, etc. There are a ton of street sellers on the streets of Latin American, Asian, and African nations. Street sellers are prevalent in several of these regions' tier-two cities. The street-selling industry supports a sizable portion of the urban non-farming population.
In addition to giving a significant portion of the urban population economic empowerment, street vendors provide jobs for women all over the world. Since many street sellers produce their own goods, this entire street-selling process gives small-scale and cottage industries dispersed across all regions of the world a boost.
Partnerships between vendors of street food and occasions like fairs, pubs, and concerts are growing more prevalent. Street food vendors benefit from increased foot traffic, and the events draw more attendees, thus this partnership is profitable for both sides.
Bars are becoming a part of this trend, functioning at a closer level with particular street food vendors to trade outside their areas and attract additional consumers. Products that are made from plant-based meat are gaining the interest of foodies and are now available in the servings of major fast-food franchises.
As the demand for meatless protein sources rises, the street food business can anticipate that this trend will spread to street food stalls. Moreover, omnivores are in search of options that are healthier and are made by a pant-meat combination. Burgers that include veg alternatives are being considered by food trucks.
Street vendors often belong to the socially and economically backward segments. Hence, they are not well educated. However, street vendors possess good marketing skills as they are engaged in street vending or other forms of business to financially contribute to the families from a very early age.
Street vendors mostly depend on mouth-to-mouth publicity to attract their customers. While some of the better types of street vendors such as food trucks have upgraded their marketing styles by utilizing social media as a primary source. This helps them reach a huge amount of the population as the internet is the basic form of connectivity and social media are trending amongst users from every generation. This has helped them to gain a large number of customers and boost their business.
Some of the characteristics that attract people to the profession of street sellers are low start-up costs, low entrance barriers, and flexible hours. Because they are unable to obtain employment in the formal sector, many people turn to street vending. However, it takes a certain level of expertise to make it a street vendor. In many cities, there is fierce competition among sellers for access to clients and space on the streets. Vendors also need to be skilled negotiators when dealing with clients and distributors.
Street vending can provide a liveable life, but for many vendors, particularly those who sell fresh vegetables and fruits, profits are low and hazards are considerable. A major issue for those who work on the streets is having an unsafe workplace. Theft, inadequate storage, and stock damage are frequent problems. Many street sellers are exposed to confiscation, harassment, and evictions since licensing requirements and bylaws governing street trade can be difficult to understand.

Street Vending regulated by England
The Local Government Act of 1982's was issued to regulate street trading. This law has been approved by the Council. In the District of Stratford on Avon, all streets have the designation of consent streets. This means that street trading consent is required for anyone who wants to conduct business on a street, highway, or other public property. Additionally, a street trade permit is required for anyone conducting business on adjacent property that is 7 metres or less from a highway. The selling, exposing, or offering for sale of any article on a street is how the Act defines street dealing.

Selling newspapers and journals exempted from general vendor license
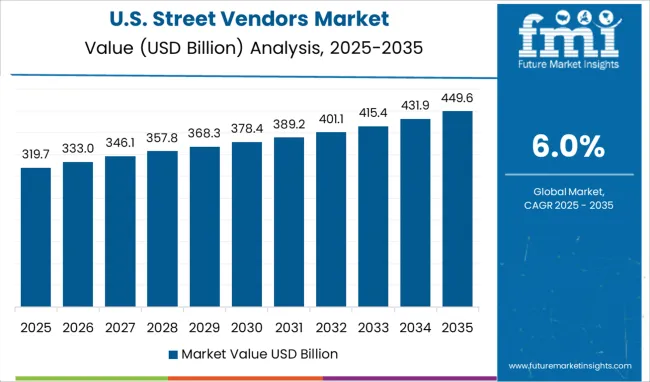
In the USA anyone who intends to sell, lease, offer to sell, or lease goods or services in a public area that is not a store must have a general vendor licence. The Department of Consumer and Worker Protection (DCWP) of New York City is only permitted to provide a total of 853 General Vendor Licenses to non-veterans. Selling newspapers, journals, books, and pamphlets are examples of activities for which a general vendor licence is not necessary.
Indian government launches scheme exclusively for the street vendors
In order to empower street vendors, the Ministry of Housing & Urban Affairs created the PM Street Vendor's AtmaNirbhar Nidhi (PM SVANidhi) programme. This programme provides loans to street vendors, but it also focuses on their overall growth and economic advancement. About 50 lakh street vendors would be eligible for collateral-free working capital loans with a one-year term through the programme to enable them to restart their enterprises in urban regions, including nearby urban and rural areas.
The PM SVANidhi scheme provides incentives in the form of interest subsidies at 7% per annum on timely loan repayment, cashback of up to INR 1200 per annum on carrying out specified digital transactions, and eligibility for a loan tranche that is boosted in the following tranche. This programme has received about 2 million applications, of which 752191 have been approved and 218751 loans have already been disbursed.
Food trucks are trending throughout the world
Most street vendors are involved in selling fruits and vegetables throughout the world. Food trucks are also one of the fastest-growing street vending options. They provide food at a cheaper cost and at a rapid pace.
Street vendors are the backbone of rural markets
The largest number are street vendors are found in rural areas. The population in rural areas is not very fond of brands compared to the urban population. In general, they tend to spend less for any product or service which is fulfilled by the street vendors. The street vendors don’t have to pay rent for their places or other extra taxes by virtue of which they are able to provide their products and services at cheaper rates.

The street vendors implement various attractive strategies to gain the consumer's attention. While the better versions of street vendors use social media as a platform for reaching more people. The food trucks provide a number of offers that please the customers and also give discounts on the non-prime times of the day to facilitate their business.
| Attribute | Details |
|---|---|
| Forecast Period | 2025 to 2035 |
| Historical Data Available for | 2020 to 2024 |
| Market Analysis | USD billion for Value |
| Key Regions Covered | North America, Latin America, Europe, East Asia, South Asia, Oceania & MEA |
| Key Countries Covered | United States of America, Canada, Brazil, Mexico, Argentina, Colombia Germany, UK, France, Italy, Russia, South Africa, Turkey, UAE, Egypt, Jordan China, Japan, South Korea, India, Thailand, Malaysia, Indonesia, Philippines, Cambodia, Vietnam Australia & New Zealand. |
| Key Segments Covered | Vendor type, Area, Commodity, and Region. |
| Report Coverage | Market Forecast, Company Share Analysis, Competition Intelligence, Drivers, Restraints, Opportunities and Threats Analysis, Market Dynamics and Challenges, and Strategic Growth Initiatives |
| Customization & Pricing | Available upon Request |
The global street vendors market is estimated to be valued at USD 3.0 USD billion in 2025.
It is projected to reach USD 5.3 USD billion by 2035.
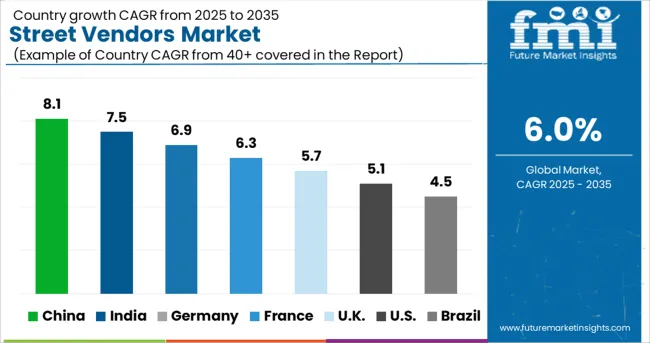
The market is expected to grow at a 6.0% CAGR between 2025 and 2035.
The key product types are stationary, peripatetic and mobile.
urban segment is expected to dominate with a 52.0% industry share in 2025.


Full Research Suite comprises of:
Market outlook & trends analysis
Interviews & case studies
Strategic recommendations
Vendor profiles & capabilities analysis
5-year forecasts
8 regions and 60+ country-level data splits
Market segment data splits
12 months of continuous data updates
DELIVERED AS:
PDF EXCEL ONLINE
Street and Roadway Lighting Market Trend Analysis Based on Wattage, End-Use, and Region 2025 to 2035
On Street Vehicle Parking Meter Market Growth - Trends & Forecast 2024 to 2034
Solar Street Lighting Market Size and Share Forecast Outlook 2025 to 2035

Thank you!
You will receive an email from our Business Development Manager. Please be sure to check your SPAM/JUNK folder too.
Chat With
MaRIA