Global Substrate-like PCB Market Size and Share Forecast Outlook From 2023 to 2033

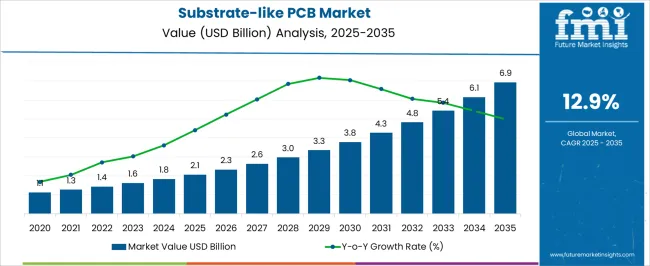
By 2033, it is expected that the total sales of substrate-like PCBs might be USD 5.7 billion growing from USD 1.6 billion in 2023. Accordingly, the forecasted ten-year term is predicted to see a compound annual growth rate of 13.5% in sales of substrate-like PCBs.

Specialized circuit boards called substrate-like PCBs have improved electrical and thermal performance over conventional printed circuit boards. They are now employed in several sectors, including consumer electronics, telecommunications, and automotive, as well as the aerospace sector. As many industries are going to need such cutting-edge circuit boards, it suggests the demand for substrate-like PCBs is expected to rise over the coming years.

There could be a huge potential demand for substrate-like PCBs during the forecast years as sophisticated electronics are increasingly used by various sectors. Emerging technologies and applications like IoT devices, driverless cars, 5G technology, and AI systems are also estimated to drive the market growth possibilities for substrate-like PCBs.

The need for PCBs with enhanced electrical and thermal performance is rising as a result of technological developments and the rapid progression of industries. Moreover, substrate-like PCBs are compact and lightweight compared to rigid PCBs enabling effective use of available space in applications where compactness is critical. In addition to this, substrate-like PCBs' small size and weight also increase systems performance as a whole.

Attributes Details
Global Substrate-like PCB Market Valuation in 2022 USD 1.4 billion
Estimated Global Market Share in 2023 USD 1.6 billion
Forecasted Global Market Size by 2033 USD 5.7 billion
Projected Global Market Growth Rate from 2023 to 2033 13.5% CAGR
Historical Market Growth Rate from 2018 to 2022 15.9% CAGR

Comparison of Historical vs Future Outlook on Changing Consumer Trends for Substrate-like PCB Industry

By the end of the year 2018, the net valuation of the market was figured out by FMI to be around USD 0.8 billion. The 15.9% CAGR displayed that the market's average annual growth rate over the specified time frame from 2018 to 2022 was at its peak.

Key Drivers for the Global Substrate-like PCB Market

Stiff-flex PCBs can be expensive which can limit their sales for some years, as they require complicated manufacturing processes as compared to typical rigid PCBs. Beyond IoT and automotive electronics, rigid-flex PCBs are also anticipated to become widespread as technology develops and consumer demand for reliable electronics rises.

Rigid-flex PCBs have acquired a lot of interest in the design of IoT devices in the last few years due to their great endurance. These flexible wiring-connected printed circuit boards (PCBs) provide benefits over conventional rigid PCBs, particularly in high-vibration situations like automotive engines. So the automotive sector has increased its use creating a huge potential for this segment in recent years.

Substrate-like PCB Industry Analysis by Top Investment Segments

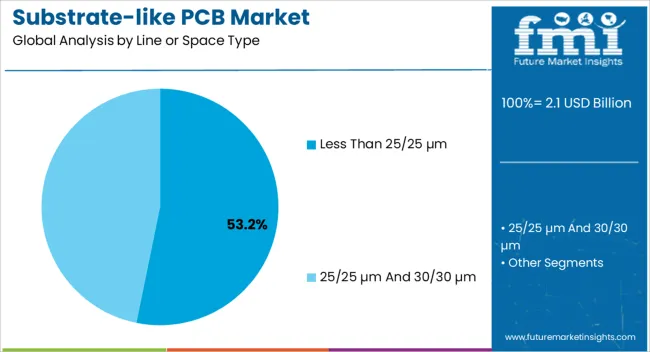
Top Line or Space Type Segment 25/25 µm and 30/30 µm Line or Space
Top Market Segment Historical CAGR from 2018 to 2022 15.7%
Top Market Segment Forecasted CAGR from 2023 to 2033 13.4%

Automated Optical Inspecting Technology is Getting Higher Preference over Other Technologies

Growing focus on the 25/25 µm and 30/30 µm market segments in recent years has been highlighted by FMI experts in the report. By the conclusion of the analysis period, it is anticipated that this segment could dominate the overall market by following a high growth rate.

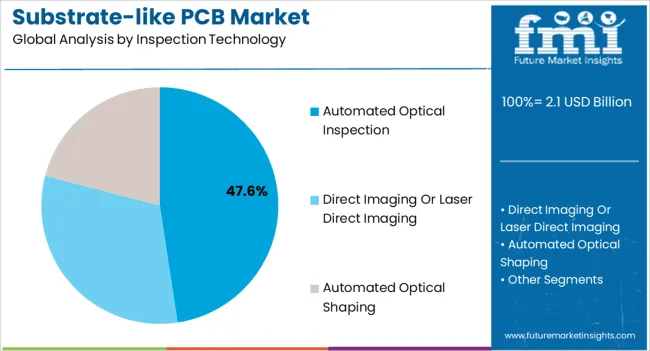
The automated optical inspection technology segment is anticipated to represent a sizable potential for the market growing at a high rate than other segments. Due to its ease of application and comparatively low operational cost, it is predicted to remain the preferred choice among end-users through 2033.

Top Inspection Technology Segment Automated Optical Inspection
Top Market Segment Historical CAGR from 2018 to 2022 15.5%
Top Market Segment Forecasted CAGR from 2023 to 2033 13.3%

Analysis of Top Countries, Producing, Formulating, Packaging, Distributing, and Consuming Substrate-like PCB

Regional Market Attributes Details
Historical CAGR of the United States Market from 2018 to 2022 12.6%
Forecasted CAGR of the United States Market from 2023 to 2033 12.3%
Anticipated Overall Market Value in the United States by 2033 USD 852.9 million
The United States Market Absolute Dollar Growth Until 2033 USD 585.5 million

Substrate-like PCB Manufacturers in the United States are Targeting Foreign Markets

The demand for substrate-like PCBs in the United States is huge, and the market is anticipated to expand steadily due to evolving technology. Furthermore, the rising demand for high-performance electronics and the existence of key competitors in the country could play a crucial role in this progress. Although sales in the domestic market could expand at a pace of 12.3%, manufacturers hope to find great opportunities beyond the United States.

Regional Market Attributes Details
Historical CAGR of the United Kingdom Market from 2018 to 2022 11.1%
Forecasted CAGR of the United Kingdom Market from 2023 to 2033 11.9%
Anticipated Overall Market Value in the United Kingdom by 2033 USD 142.6 million
Projected Growth of the Market Until 2033 in Absolute Dollar USD 96.2 million

The United Kingdom PCB Market to Remain Notable in Sales of Substrate-like for Manufacturers in Europe

The establishment of new PCB manufacturing facilities in Europe is a response to the expanding demand for circuit boards of superior quality. Germany, France, Spain, and the United Kingdom are mentioned as notable regional markets for substrate-like PCBs in Europe. The United Kingdom is also anticipated to expand at a slightly significant pace from 2023 to 2033 suggesting a promising market for manufacturers in Europe.

Regional Market Attributes Details
Historical CAGR of the China Market from 2018 to 2022 18.1%
Forecasted CAGR of the China Market from 2023 to 2033 15.1%
Anticipated Overall Market Value in China by 2033 USD 1.5 billion
China Market Absolute Dollar Growth until 2033 USD 1.1 billion

Asia Pacific Countries are Getting Attractive for Global Substrate-like PCB Manufacturers

Many Asia Pacific countries contribute significantly to the global PCB industry and also held a considerable share in this substrate-like PCB industry. Key participants in this geographical region include China, Japan, South Korea, India, and Taiwan as well as some South East Asian Association countries. Further, China holds strong PCB manufacturing capacities, which are projected to be fueled by the region's emphasis on technical improvements and production capacities.

Regional Market Attributes Details
Historical CAGR of the Japan Market from 2018 to 2022 17%
Forecasted CAGR of the Japan Market from 2023 to 2033 13.8%
Anticipated Overall Market Value in Japan by 2033 USD 1 billion
Japan Market Absolute Dollar Growth Until 2033 USD 726 million

India is emerging as a significant center for electronics production, including substrate-like PCBs, due to its trained labor, welcoming business environment, and supportive infrastructure. In contrast, the state of the economy, changes in regulations, and industry competitiveness can have an impact on the market dynamics of other regional countries.

AT&S AG, which produces high-tech PCBs for a range of medical applications, said in January 2022 to expand its manufacturing facility in Asia Pacific. Asia Pacific PCB manufacturers now have great access to chips and this expansion guarantees its development in the Southeast Asian medical devices sector.

Regional Market Attributes Details
Historical CAGR of the South Korea Market from 2018 to 2022 17.4%
Forecasted CAGR of the South Korea Market from 2023 to 2033 14%
Anticipated Overall Market Value in South Korea by 2033 USD 357.7 million
South Korea Market Absolute Dollar Growth Until 2033 USD 261.3 million

Leading Suppliers of Substrate-like PCB

Manufacturers’ response to rising worries about cutting-edge technology, the robustness of the PCB supply chain, and geographical diversity influence the overall market competitive landscape. Moreover, opening highly automated printed circuit board (PCB) production facilities by many leading market players demonstrates their dedication to cutting-edge technology. For instance,

  • TTM Technologies Incorporation announced the development of a highly automated PCB manufacturing plant in Malaysia with a capital expenditure of USD 130 million by 2025. Likewise, Austria Technologie & Systemtechnik AG stated in January 2022 that it might be expanding its manufacturing facility in Ansan, South Korea.

Leading players hope to remain competitive in the developing electronics market and fulfill the rising demand for complex circuit boards by making high-tech investments. They are also putting a huge emphasis on increasing the resilience of the PCB supply chain after the recent pandemic disruptions. Furthermore, recent geopolitical issues have highlighted how crucial it is to diversify production sites leading to frequent mergers and partnerships with regional players.

How can Substrate-like PCB Manufacturers Scale their Businesses in the Global Market?

The substrate-like printed circuit board (PCB) manufacturers can adopt ongoing innovation and product development initiatives to scale up their businesses. By extending production facilities to emerging economies, manufacturers can reduce any risks and can make sure that their goods have a reliable supply chain.

Existing players as well as start-ups can adopt industrial automation systems to increase the production capacity of their facilities. Moreover, automation increases productivity, accuracy, and scalability, enabling the manufacture of high-quality substrate-like printed circuit boards (PCBs). New players can also take advantage of access to a large talent pool and fortify their position by utilizing the benefits of e-commerce platforms.

Key Players Profiled in the Substrate-like PCB Market Report

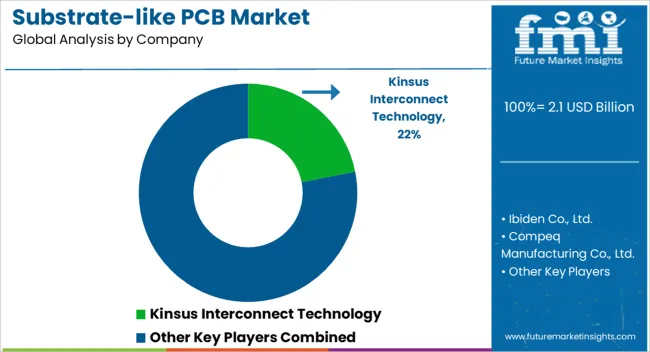
  • Kinsus Interconnect Technology
  • Ibiden Co., Ltd.
  • Compeq Manufacturing Co., Ltd.
  • Unimicron Technology Corporation
  • Austria Technologies & Systemtechnik AG (AT&S)
  • TTM Technologies
  • Samsung Electro-Mechanics
  • Korea International Circuit Incorporation
  • Zhen Ding Technology
  • Daeduck Gds Company
  • Tripod Technology Corp

Key Shifting Preferences Covered in Substrate-like PCB Market Report

Attribute Details
Forecast Period 2023 to 2033
Historical Data Available for 2018 to 2022
Market Analysis USD million or USD billion for Value and Units for Volume
Key Regions Covered North America; Latin America; Europe; The Middle East & Africa; East Asia; South Asia and Oceania
Key Countries Covered The United States, Canada, Brazil, Mexico, Germany, Spain, Italy, France, United Kingdom, Russia, China, India, Australia & New Zealand, GCC Countries, and South Africa
Key Segments Covered By Line or Space Type, By Inspection Technology, By Application, and By Region
Key Companies Profiled Kinsus Interconnect Technology; Ibiden Co.; Ltd.; Compaq Manufacturing Co.; Ltd.; Unimicron Technology Corporation; Austria Technologie & Systemtechnik AG (AT&S); TTM Technologies; Samsung Electro-Mechanics; Korea International Circuit Incorporation; Zhen Ding Technology; Daeduck Gds Company; and Tripod Technology Corp
Report Coverage Market Forecast, Company Share Analysis, Competition Intelligence, DROT Analysis, Market Dynamics and Challenges, and Strategic Growth Initiatives
Customization & Pricing Available upon Request

Top Segments Studied in the Substrate-like PCB Market Research Report

By Line or Space Type:

  • Less than 25/25 µm
  • 25/25 µm and 30/30 µm

By Inspection Technology:

  • Automated Optical Inspection
  • Direct Imaging or Laser Direct Imaging
  • Automated Optical Shaping

By Application:

  • Consumer Electronics Industries
  • Computing and Communications Sector
  • Automotive Industries
  • Medical Sector
  • Manufacturing Industries
  • Military, Defense, and Aerospace Sector
  • Other Applications

By Region:

  • North America Market
  • Latin America Market
  • Europe Market
  • East Asia Market
  • South Asia and Pacific Market
  • The Middle East and Africa (MEA) Market

Table of Content

  • 1. Executive Summary
  • 2. Market Overview
  • 3. Market Background
  • 4. Global Market Analysis 2018 to 2022 and Forecast, 2023 to 2033
  • 5. Global Market Analysis 2018 to 2022 and Forecast 2023 to 2033, By Line/Space
    • 5.1. 25/25µm and 30/30µm Line/Space
    • 5.2. Less Than 25/25 µm Line/Space
  • 6. Global Market Analysis 2018 to 2022 and Forecast 2023 to 2033, By Inspection Technology
    • 6.1. Automated Optical Inspection
    • 6.2. Direct Imaging or Laser Direct Imaging
    • 6.3. Automated Optical Shaping
  • 7. Global Market Analysis 2018 to 2022 and Forecast 2023 to 2033, By Application
    • 7.1. Consumer Electronics
    • 7.2. Computing and Communications
    • 7.3. Automotive
    • 7.4. Medical
    • 7.5. Industrial
    • 7.6. Military, Defense, and Aerospace
  • 8. Global Market Analysis 2018 to 2022 and Forecast 2023 to 2033, By Region
    • 8.1. North America
    • 8.2. Latin America
    • 8.3. Europe
    • 8.4. Asia Pacific
    • 8.5. MEA
  • 9. North America Market Analysis 2018 to 2022 and Forecast 2023 to 2033, By Country
  • 10. Latin America Market Analysis 2018 to 2022 and Forecast 2023 to 2033, By Country
  • 11. Europe Market Analysis 2018 to 2022 and Forecast 2023 to 2033, By Country
  • 12. Asia Pacific Market Analysis 2018 to 2022 and Forecast 2023 to 2033, By Country
  • 13. MEA Market Analysis 2018 to 2022 and Forecast 2023 to 2033, By Country
  • 14. Key Countries Market Analysis
  • 15. Market Structure Analysis
  • 16. Competition Analysis
    • 16.1. Kinsus Interconnect Technology
    • 16.2. Ibiden
    • 16.3. Compeq
    • 16.4. Unimicron
    • 16.5. AT&S
    • 16.6. TTM Technologies
    • 16.7. Samsung Electro-Mechanics
    • 16.8. Korea Circuit
    • 16.9. Zhen Ding Technology
    • 16.10. Daeduck Gds Company
    • 16.11. Tripod Technology Corp
  • 17. Assumptions & Acronyms Used
  • 18. Research Methodology

List of Tables

Table 1: Global Market Value (US$ Million) Forecast by Region, 2018 to 2033

Table 2: Global Market Volume (Units) Forecast by Region, 2018 to 2033

Table 3: Global Market Value (US$ Million) Forecast by Line/Space, 2018 to 2033

Table 4: Global Market Volume (Units) Forecast by Line/Space, 2018 to 2033

Table 5: Global Market Value (US$ Million) Forecast by Inspection Technology, 2018 to 2033

Table 6: Global Market Volume (Units) Forecast by Inspection Technology, 2018 to 2033

Table 7: Global Market Value (US$ Million) Forecast by Application, 2018 to 2033

Table 8: Global Market Volume (Units) Forecast by Application, 2018 to 2033

Table 9: North America Market Value (US$ Million) Forecast by Country, 2018 to 2033

Table 10: North America Market Volume (Units) Forecast by Country, 2018 to 2033

Table 11: North America Market Value (US$ Million) Forecast by Line/Space, 2018 to 2033

Table 12: North America Market Volume (Units) Forecast by Line/Space, 2018 to 2033

Table 13: North America Market Value (US$ Million) Forecast by Inspection Technology, 2018 to 2033

Table 14: North America Market Volume (Units) Forecast by Inspection Technology, 2018 to 2033

Table 15: North America Market Value (US$ Million) Forecast by Application, 2018 to 2033

Table 16: North America Market Volume (Units) Forecast by Application, 2018 to 2033

Table 17: Latin America Market Value (US$ Million) Forecast by Country, 2018 to 2033

Table 18: Latin America Market Volume (Units) Forecast by Country, 2018 to 2033

Table 19: Latin America Market Value (US$ Million) Forecast by Line/Space, 2018 to 2033

Table 20: Latin America Market Volume (Units) Forecast by Line/Space, 2018 to 2033

Table 21: Latin America Market Value (US$ Million) Forecast by Inspection Technology, 2018 to 2033

Table 22: Latin America Market Volume (Units) Forecast by Inspection Technology, 2018 to 2033

Table 23: Latin America Market Value (US$ Million) Forecast by Application, 2018 to 2033

Table 24: Latin America Market Volume (Units) Forecast by Application, 2018 to 2033

Table 25: Europe Market Value (US$ Million) Forecast by Country, 2018 to 2033

Table 26: Europe Market Volume (Units) Forecast by Country, 2018 to 2033

Table 27: Europe Market Value (US$ Million) Forecast by Line/Space, 2018 to 2033

Table 28: Europe Market Volume (Units) Forecast by Line/Space, 2018 to 2033

Table 29: Europe Market Value (US$ Million) Forecast by Inspection Technology, 2018 to 2033

Table 30: Europe Market Volume (Units) Forecast by Inspection Technology, 2018 to 2033

Table 31: Europe Market Value (US$ Million) Forecast by Application, 2018 to 2033

Table 32: Europe Market Volume (Units) Forecast by Application, 2018 to 2033

Table 33: Asia Pacific Market Value (US$ Million) Forecast by Country, 2018 to 2033

Table 34: Asia Pacific Market Volume (Units) Forecast by Country, 2018 to 2033

Table 35: Asia Pacific Market Value (US$ Million) Forecast by Line/Space, 2018 to 2033

Table 36: Asia Pacific Market Volume (Units) Forecast by Line/Space, 2018 to 2033

Table 37: Asia Pacific Market Value (US$ Million) Forecast by Inspection Technology, 2018 to 2033

Table 38: Asia Pacific Market Volume (Units) Forecast by Inspection Technology, 2018 to 2033

Table 39: Asia Pacific Market Value (US$ Million) Forecast by Application, 2018 to 2033

Table 40: Asia Pacific Market Volume (Units) Forecast by Application, 2018 to 2033

Table 41: MEA Market Value (US$ Million) Forecast by Country, 2018 to 2033

Table 42: MEA Market Volume (Units) Forecast by Country, 2018 to 2033

Table 43: MEA Market Value (US$ Million) Forecast by Line/Space, 2018 to 2033

Table 44: MEA Market Volume (Units) Forecast by Line/Space, 2018 to 2033

Table 45: MEA Market Value (US$ Million) Forecast by Inspection Technology, 2018 to 2033

Table 46: MEA Market Volume (Units) Forecast by Inspection Technology, 2018 to 2033

Table 47: MEA Market Value (US$ Million) Forecast by Application, 2018 to 2033

Table 48: MEA Market Volume (Units) Forecast by Application, 2018 to 2033

List of Figures

Figure 1: Global Market Value (US$ Million) by Line/Space, 2023 to 2033

Figure 2: Global Market Value (US$ Million) by Inspection Technology, 2023 to 2033

Figure 3: Global Market Value (US$ Million) by Application, 2023 to 2033

Figure 4: Global Market Value (US$ Million) by Region, 2023 to 2033

Figure 5: Global Market Value (US$ Million) Analysis by Region, 2018 to 2033

Figure 6: Global Market Volume (Units) Analysis by Region, 2018 to 2033

Figure 7: Global Market Value Share (%) and BPS Analysis by Region, 2023 to 2033

Figure 8: Global Market Y-o-Y Growth (%) Projections by Region, 2023 to 2033

Figure 9: Global Market Value (US$ Million) Analysis by Line/Space, 2018 to 2033

Figure 10: Global Market Volume (Units) Analysis by Line/Space, 2018 to 2033

Figure 11: Global Market Value Share (%) and BPS Analysis by Line/Space, 2023 to 2033

Figure 12: Global Market Y-o-Y Growth (%) Projections by Line/Space, 2023 to 2033

Figure 13: Global Market Value (US$ Million) Analysis by Inspection Technology, 2018 to 2033

Figure 14: Global Market Volume (Units) Analysis by Inspection Technology, 2018 to 2033

Figure 15: Global Market Value Share (%) and BPS Analysis by Inspection Technology, 2023 to 2033

Figure 16: Global Market Y-o-Y Growth (%) Projections by Inspection Technology, 2023 to 2033

Figure 17: Global Market Value (US$ Million) Analysis by Application, 2018 to 2033

Figure 18: Global Market Volume (Units) Analysis by Application, 2018 to 2033

Figure 19: Global Market Value Share (%) and BPS Analysis by Application, 2023 to 2033

Figure 20: Global Market Y-o-Y Growth (%) Projections by Application, 2023 to 2033

Figure 21: Global Market Attractiveness by Line/Space, 2023 to 2033

Figure 22: Global Market Attractiveness by Inspection Technology, 2023 to 2033

Figure 23: Global Market Attractiveness by Application, 2023 to 2033

Figure 24: Global Market Attractiveness by Region, 2023 to 2033

Figure 25: North America Market Value (US$ Million) by Line/Space, 2023 to 2033

Figure 26: North America Market Value (US$ Million) by Inspection Technology, 2023 to 2033

Figure 27: North America Market Value (US$ Million) by Application, 2023 to 2033

Figure 28: North America Market Value (US$ Million) by Country, 2023 to 2033

Figure 29: North America Market Value (US$ Million) Analysis by Country, 2018 to 2033

Figure 30: North America Market Volume (Units) Analysis by Country, 2018 to 2033

Figure 31: North America Market Value Share (%) and BPS Analysis by Country, 2023 to 2033

Figure 32: North America Market Y-o-Y Growth (%) Projections by Country, 2023 to 2033

Figure 33: North America Market Value (US$ Million) Analysis by Line/Space, 2018 to 2033

Figure 34: North America Market Volume (Units) Analysis by Line/Space, 2018 to 2033

Figure 35: North America Market Value Share (%) and BPS Analysis by Line/Space, 2023 to 2033

Figure 36: North America Market Y-o-Y Growth (%) Projections by Line/Space, 2023 to 2033

Figure 37: North America Market Value (US$ Million) Analysis by Inspection Technology, 2018 to 2033

Figure 38: North America Market Volume (Units) Analysis by Inspection Technology, 2018 to 2033

Figure 39: North America Market Value Share (%) and BPS Analysis by Inspection Technology, 2023 to 2033

Figure 40: North America Market Y-o-Y Growth (%) Projections by Inspection Technology, 2023 to 2033

Figure 41: North America Market Value (US$ Million) Analysis by Application, 2018 to 2033

Figure 42: North America Market Volume (Units) Analysis by Application, 2018 to 2033

Figure 43: North America Market Value Share (%) and BPS Analysis by Application, 2023 to 2033

Figure 44: North America Market Y-o-Y Growth (%) Projections by Application, 2023 to 2033

Figure 45: North America Market Attractiveness by Line/Space, 2023 to 2033

Figure 46: North America Market Attractiveness by Inspection Technology, 2023 to 2033

Figure 47: North America Market Attractiveness by Application, 2023 to 2033

Figure 48: North America Market Attractiveness by Country, 2023 to 2033

Figure 49: Latin America Market Value (US$ Million) by Line/Space, 2023 to 2033

Figure 50: Latin America Market Value (US$ Million) by Inspection Technology, 2023 to 2033

Figure 51: Latin America Market Value (US$ Million) by Application, 2023 to 2033

Figure 52: Latin America Market Value (US$ Million) by Country, 2023 to 2033

Figure 53: Latin America Market Value (US$ Million) Analysis by Country, 2018 to 2033

Figure 54: Latin America Market Volume (Units) Analysis by Country, 2018 to 2033

Figure 55: Latin America Market Value Share (%) and BPS Analysis by Country, 2023 to 2033

Figure 56: Latin America Market Y-o-Y Growth (%) Projections by Country, 2023 to 2033

Figure 57: Latin America Market Value (US$ Million) Analysis by Line/Space, 2018 to 2033

Figure 58: Latin America Market Volume (Units) Analysis by Line/Space, 2018 to 2033

Figure 59: Latin America Market Value Share (%) and BPS Analysis by Line/Space, 2023 to 2033

Figure 60: Latin America Market Y-o-Y Growth (%) Projections by Line/Space, 2023 to 2033

Figure 61: Latin America Market Value (US$ Million) Analysis by Inspection Technology, 2018 to 2033

Figure 62: Latin America Market Volume (Units) Analysis by Inspection Technology, 2018 to 2033

Figure 63: Latin America Market Value Share (%) and BPS Analysis by Inspection Technology, 2023 to 2033

Figure 64: Latin America Market Y-o-Y Growth (%) Projections by Inspection Technology, 2023 to 2033

Figure 65: Latin America Market Value (US$ Million) Analysis by Application, 2018 to 2033

Figure 66: Latin America Market Volume (Units) Analysis by Application, 2018 to 2033

Figure 67: Latin America Market Value Share (%) and BPS Analysis by Application, 2023 to 2033

Figure 68: Latin America Market Y-o-Y Growth (%) Projections by Application, 2023 to 2033

Figure 69: Latin America Market Attractiveness by Line/Space, 2023 to 2033

Figure 70: Latin America Market Attractiveness by Inspection Technology, 2023 to 2033

Figure 71: Latin America Market Attractiveness by Application, 2023 to 2033

Figure 72: Latin America Market Attractiveness by Country, 2023 to 2033

Figure 73: Europe Market Value (US$ Million) by Line/Space, 2023 to 2033

Figure 74: Europe Market Value (US$ Million) by Inspection Technology, 2023 to 2033

Figure 75: Europe Market Value (US$ Million) by Application, 2023 to 2033

Figure 76: Europe Market Value (US$ Million) by Country, 2023 to 2033

Figure 77: Europe Market Value (US$ Million) Analysis by Country, 2018 to 2033

Figure 78: Europe Market Volume (Units) Analysis by Country, 2018 to 2033

Figure 79: Europe Market Value Share (%) and BPS Analysis by Country, 2023 to 2033

Figure 80: Europe Market Y-o-Y Growth (%) Projections by Country, 2023 to 2033

Figure 81: Europe Market Value (US$ Million) Analysis by Line/Space, 2018 to 2033

Figure 82: Europe Market Volume (Units) Analysis by Line/Space, 2018 to 2033

Figure 83: Europe Market Value Share (%) and BPS Analysis by Line/Space, 2023 to 2033

Figure 84: Europe Market Y-o-Y Growth (%) Projections by Line/Space, 2023 to 2033

Figure 85: Europe Market Value (US$ Million) Analysis by Inspection Technology, 2018 to 2033

Figure 86: Europe Market Volume (Units) Analysis by Inspection Technology, 2018 to 2033

Figure 87: Europe Market Value Share (%) and BPS Analysis by Inspection Technology, 2023 to 2033

Figure 88: Europe Market Y-o-Y Growth (%) Projections by Inspection Technology, 2023 to 2033

Figure 89: Europe Market Value (US$ Million) Analysis by Application, 2018 to 2033

Figure 90: Europe Market Volume (Units) Analysis by Application, 2018 to 2033

Figure 91: Europe Market Value Share (%) and BPS Analysis by Application, 2023 to 2033

Figure 92: Europe Market Y-o-Y Growth (%) Projections by Application, 2023 to 2033

Figure 93: Europe Market Attractiveness by Line/Space, 2023 to 2033

Figure 94: Europe Market Attractiveness by Inspection Technology, 2023 to 2033

Figure 95: Europe Market Attractiveness by Application, 2023 to 2033

Figure 96: Europe Market Attractiveness by Country, 2023 to 2033

Figure 97: Asia Pacific Market Value (US$ Million) by Line/Space, 2023 to 2033

Figure 98: Asia Pacific Market Value (US$ Million) by Inspection Technology, 2023 to 2033

Figure 99: Asia Pacific Market Value (US$ Million) by Application, 2023 to 2033

Figure 100: Asia Pacific Market Value (US$ Million) by Country, 2023 to 2033

Figure 101: Asia Pacific Market Value (US$ Million) Analysis by Country, 2018 to 2033

Figure 102: Asia Pacific Market Volume (Units) Analysis by Country, 2018 to 2033

Figure 103: Asia Pacific Market Value Share (%) and BPS Analysis by Country, 2023 to 2033

Figure 104: Asia Pacific Market Y-o-Y Growth (%) Projections by Country, 2023 to 2033

Figure 105: Asia Pacific Market Value (US$ Million) Analysis by Line/Space, 2018 to 2033

Figure 106: Asia Pacific Market Volume (Units) Analysis by Line/Space, 2018 to 2033

Figure 107: Asia Pacific Market Value Share (%) and BPS Analysis by Line/Space, 2023 to 2033

Figure 108: Asia Pacific Market Y-o-Y Growth (%) Projections by Line/Space, 2023 to 2033

Figure 109: Asia Pacific Market Value (US$ Million) Analysis by Inspection Technology, 2018 to 2033

Figure 110: Asia Pacific Market Volume (Units) Analysis by Inspection Technology, 2018 to 2033

Figure 111: Asia Pacific Market Value Share (%) and BPS Analysis by Inspection Technology, 2023 to 2033

Figure 112: Asia Pacific Market Y-o-Y Growth (%) Projections by Inspection Technology, 2023 to 2033

Figure 113: Asia Pacific Market Value (US$ Million) Analysis by Application, 2018 to 2033

Figure 114: Asia Pacific Market Volume (Units) Analysis by Application, 2018 to 2033

Figure 115: Asia Pacific Market Value Share (%) and BPS Analysis by Application, 2023 to 2033

Figure 116: Asia Pacific Market Y-o-Y Growth (%) Projections by Application, 2023 to 2033

Figure 117: Asia Pacific Market Attractiveness by Line/Space, 2023 to 2033

Figure 118: Asia Pacific Market Attractiveness by Inspection Technology, 2023 to 2033

Figure 119: Asia Pacific Market Attractiveness by Application, 2023 to 2033

Figure 120: Asia Pacific Market Attractiveness by Country, 2023 to 2033

Figure 121: MEA Market Value (US$ Million) by Line/Space, 2023 to 2033

Figure 122: MEA Market Value (US$ Million) by Inspection Technology, 2023 to 2033

Figure 123: MEA Market Value (US$ Million) by Application, 2023 to 2033

Figure 124: MEA Market Value (US$ Million) by Country, 2023 to 2033

Figure 125: MEA Market Value (US$ Million) Analysis by Country, 2018 to 2033

Figure 126: MEA Market Volume (Units) Analysis by Country, 2018 to 2033

Figure 127: MEA Market Value Share (%) and BPS Analysis by Country, 2023 to 2033

Figure 128: MEA Market Y-o-Y Growth (%) Projections by Country, 2023 to 2033

Figure 129: MEA Market Value (US$ Million) Analysis by Line/Space, 2018 to 2033

Figure 130: MEA Market Volume (Units) Analysis by Line/Space, 2018 to 2033

Figure 131: MEA Market Value Share (%) and BPS Analysis by Line/Space, 2023 to 2033

Figure 132: MEA Market Y-o-Y Growth (%) Projections by Line/Space, 2023 to 2033

Figure 133: MEA Market Value (US$ Million) Analysis by Inspection Technology, 2018 to 2033

Figure 134: MEA Market Volume (Units) Analysis by Inspection Technology, 2018 to 2033

Figure 135: MEA Market Value Share (%) and BPS Analysis by Inspection Technology, 2023 to 2033

Figure 136: MEA Market Y-o-Y Growth (%) Projections by Inspection Technology, 2023 to 2033

Figure 137: MEA Market Value (US$ Million) Analysis by Application, 2018 to 2033

Figure 138: MEA Market Volume (Units) Analysis by Application, 2018 to 2033

Figure 139: MEA Market Value Share (%) and BPS Analysis by Application, 2023 to 2033

Figure 140: MEA Market Y-o-Y Growth (%) Projections by Application, 2023 to 2033

Figure 141: MEA Market Attractiveness by Line/Space, 2023 to 2033

Figure 142: MEA Market Attractiveness by Inspection Technology, 2023 to 2033

Figure 143: MEA Market Attractiveness by Application, 2023 to 2033

Figure 144: MEA Market Attractiveness by Country, 2023 to 2033

Frequently Asked Questions

How Big is the Substract-like PCB Market?

The market is valued at USD 1.6 billion in 2023.

Who are the Key Substract-like PCB Market Players?

TTM Technologies and Zhen Ding Technology are key market players.

Which is the Key Segment by End-use Type?

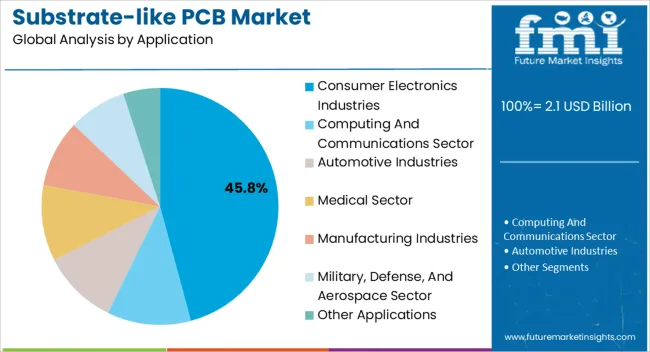
The consumer electronic industry are likely to remain preferred through 2033.

Which is the Go-to-Market Strategy?

Players opt for new launches, collaborations and partnerships.

Which are the Key Asian Countries in the Substract-like PCB Market?

Japan, India and China dominate the Asian market.

Explore Similar Insights

Future Market Insights

Substrate-like PCB Market