Reports

- Global Locations -

Headquarters

Future Market Insights, Inc.

Christiana Corporate, 200
Continental Drive, Suite 401,
Newark, Delaware - 19713,
United States

T: +1-845-579-5705

Americas

Future Market Insights, Inc.

616 Corporate Way, Suite 2-9018,
Valley Cottage, NY 10989, United States

T: +1-347-918-3531

MEA

Future Market Insights

1602-6 Jumeirah Bay X2 Tower, Plot No: JLT-PH2-X2A,
Jumeirah Lakes Towers, Dubai,
United Arab Emirates

Europe

Future Market Insights

3rd Floor, 207 Regent Street,
W1B 3HH London
United Kingdom

T: + 44 (0) 20 8123 9659
D: +44 (0) 20 3287 4268

Asia Pacific

Future Market Insights

IndiaLand Global Tech Park, Unit UG-1, Behind Grand HighStreet, Phase 1, Hinjawadi, MH, Pune – 411057, India

Sudachi Market Outlook (2022 to 2032)

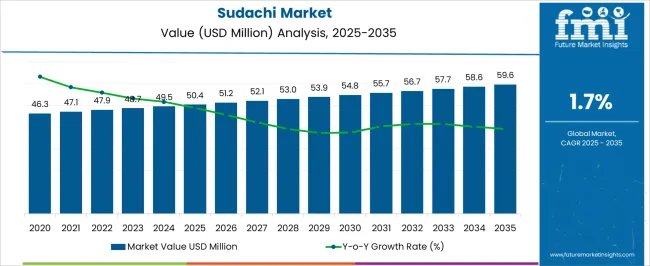
The global sudachi market is expected to grow at a rate of more than 1.7% per year between 2022 and 2032, owing to the growing adoption of sudachi as a natural citrus flavoring agent in the food and beverage industry.

The COVID-19 outbreak has resulted in the shutdown of sudachi manufacturing units, causing supply chain disruptions and declining usage of sudachi around the world. This has had a negative impact on sudachi's raw material supply because the majority of raw materials are exported from Japan to other countries. This factor has caused its price to rise even further in a short period of time

The growing consumer awareness of sudachi and its benefits is propelling sudachi market statistics. The increased availability of the product due to e-commerce has accelerated the implication of the product.

Puree-type acceptance is expected to accelerate the trends in the sudachi market due to its longer shelf life when compared to liquid.

Attributes Details
Sudachi Market Size (2022E) USD 47.9 Million
Sudachi Market Projected Size (2032F) USD 56.7 Million
Value CAGR (2022 to 2032) 1.7%

North America is expected to have the highest share of the product along with demand for natural citrus flavors in the coming years. Citrus fruits are high in vitamins, which help to boost a person's immunity when consumed on a regular basis which in turn influences the creation of lucrative opportunities and trends in the sudachi market.

Sudachi aids in the fight against germs and the repair of the body. This will assist the regional trends in expanding and gaining more share of the market in the coming years. Furthermore, Japanese and Southeast Asian cuisines are well-received in the USA. This is because low-calorie food products are becoming more popular, and people are becoming more aware of their health benefits. This factor is proving to be a positive scenario for the sudachi market expansion in North American regions.

Currently, the USA holds the largest sudachi market share and is expected to have the highest CAGR during the forecast period. This is due to a high adoption rate of exotic flavors as well as increased sudachi production in California farms which influences the expansion and trends prevailing in the market.

Don't pay for what you don't need

Customize your report by selecting specific countries or regions and save 30%!

How Does Sudachi Market Historic and Future Outlook Compare?

Consumer awareness of the importance of health is boosting interest in the use of natural flavoring agents in food and beverage products, resulting in increased usage of the product along with boosting the size of the sudachi market in various parts of the world.

It provides health benefits and is frequently used as a lime alternative, resulting in increased consumer knowledge of health and acceptance of novel flavors, which is driving the sudachi market towards expansion during the forecast period. In addition, the increased adoption of sudachi as a flavor enhancer in desserts and non-alcoholic drinks is likely to boost the sudachi market.

Sudachi Market

Which factors are Bolstering the Global Forum for Sudachi?

Consumption of artificial flavorings in food products can cause allergic responses, abdominal pain, exacerbation of asthmatic symptoms, vomiting, food hypersensitivity, and diarrhea, to name a few.

As a result, greater awareness of the negative effects of chemical components that cause allergies is projected to enhance overall such statistics.

Sudachi is becoming more popular as a substitute for fake citrus flavors. Vitamin C, phosphorus, calcium, magnesium, and potassium, are all abundant in sudachi fruit naturally. As a result, there are numerous health benefits to eating sudachi. Furthermore, sudachi is grown in greenhouses, ensuring year-round availability, therefore, pushing up the consumption of the product to various parts of the world.

The market is projected to see a boom in the coming years as consumers' lifestyles change and rise disposable income. Sudachi is commonly used in meat, salads, seafood meals, and desserts because it enhances the flavor of the product without adding calories, which helps in the growth of the sudachi market.
Nandini Roy Choudhury

Principal Consultant

Talk to Analyst

Find your sweet spots for generating winning opportunities in this market.

Country-wise Insights

How is the USA Sudachi Market Shaping?

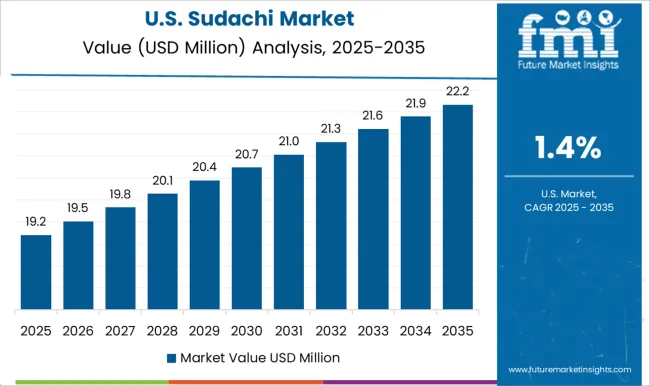
The potential in the low-calorie food sector is expected to grow as the prevalence of diabetes rises across the country which accelerates the expansion of the sudachi market.

Since the outbreak of the COVID-19 pandemic, the USA population has become increasingly interested in eating healthy, low-calorie foods. This tendency is projected to support the trends and opportunities and the growth of the market n the USA.
Which Factor is Boosting the Japanese Market Share?

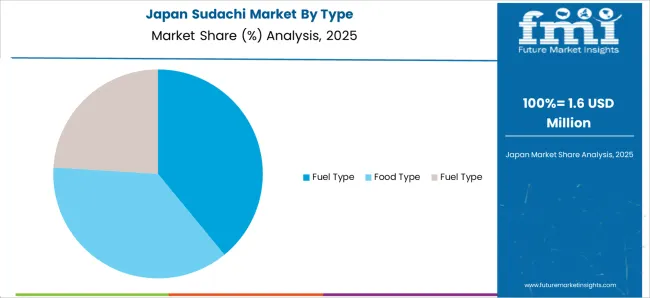
Key reasons driving the sudachi market growth include rising use of the product along with natural citrus flavors, increased demand for Japanese cuisine, and increased consumer knowledge of sudachi. Sudachi is becoming increasingly popular because of its distinct flavor and is often used as a nutritious component in the preparation of pork, fish, poultry, and salads in the country which impacts the sudachi market trends in near future.

How is the Chinese Sudachi Market Performing?

Due to its booming natural citrus flavor sector, China presently dominates the global sudachi market. Asia Pacific is a major sudachi producer, with the product being exported to countries across the world.

The beverage business in the region is booming, thanks to natural taste innovation. As a result, statistics in China are predicted to accelerate as a result of such circumstances.

Category-wise Insights

What is Propelling the Consumption of Sudachi Juice?

The juice segment in the sudachi market is expected to approach USD 25.3 Million by 2027, with a CAGR of around 1.6%. It is most commonly taken as a juice, and because of its liquid nature, it is simple to blend and cook with a variety of foods. Although it has a shorter shelf life than sudachi powder, its compatibility with food makes it a superior choice.

When compared to puree and powder, the production of sudachi juice is less complicated and time-intensive. As a result, this component aids the sudachi market expansion.

What is Boosting the Application of Sudachi in the Desserts Market?

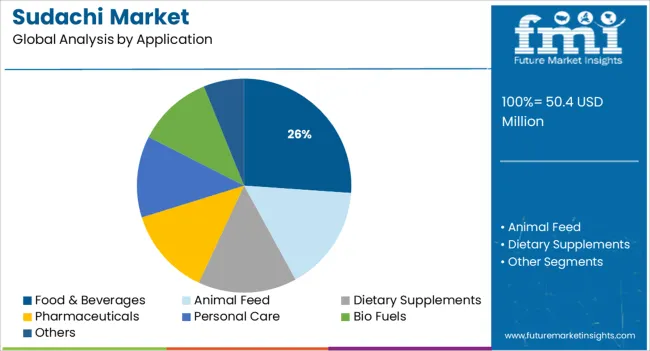
The sudachi market is divided into three applications: beverage, food, and others. Food is further subdivided into the bakery, meat, poultry, seafood, sauces and dressings, desserts, and others.

Among these, the sauces and dressings segment is expected to grow by 1.2% over the forecast period. The meat, poultry, and seafood segment are expected to grow by 1.4% in the coming year.

The native fruit is mostly squeezed over Japanese grilled fish dishes. Sudachi, with its pleasant fragrance and tangy flavor, is known to reduce fishy odor and taste which positively influences the sudachi market during the forecast period.

The bakery segment will grow by more than 0.7%. Sudachi juice is also excellent for a variety of bakery items, including pastry fillings and cakes. Meanwhile, the other food segment is expected to grow by 1.0%.

The other application segment is expected to grow at a rate of 0.9% in the coming year. Sudachi is known to have numerous health benefits in addition to other advantages. It has been shown to help with calcium absorption and blood sugar regulation.

It can help to boost the immune system, reduce inflammation, and improve blood circulation if consumed on a regular basis, and impacts the opportunities in the sudachi market.

Desserts are the fastest expanding sub-segment in the food industry, because of the increased usage of sudachi in mousse, ice creams, ice pops, and other desserts.

Sudachi manufacturers are continuously experimenting with food products especially desserts, in order to provide consumers with unique products and gain a competitive advantage. This is leading to rapidly emerging trends in the dessert category.
Get the data you need at a Fraction of the cost

Personalize your report by choosing insights you need
and save 40%!

Competitive Landscape

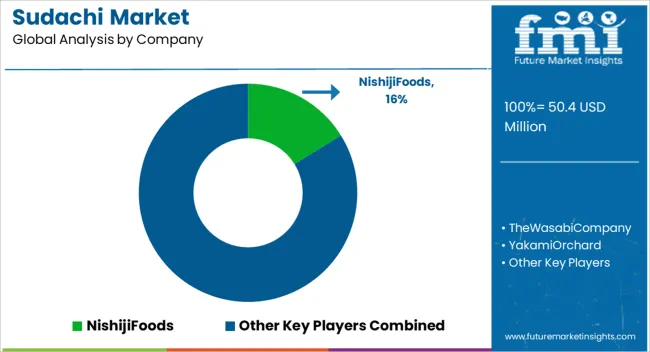
To increase overall sudachi market share, companies are implementing strategic initiatives such as collaboration and M&As. As the global sudachi market is still in its infancy, only small and medium-sized businesses sell the products. In the foreseeable time frame increased consumption of various food products is likely to boost the number of new entrants.

The biggies are investing in expanding their production capacities, either by building new manufacturing facilities or increasing the capacity of their existing manufacturing plants, in order to meet the consumer demand in the forum.

Scope of the Report

Attribute Details
Forecast Period 2022 to 2032
Historical Data Available for 2017 to 2021
Market Analysis USD Million for Value and MT for Volume
Key Regions Covered North America, Latin America, Europe, Asia Pacific, and the Middle East and Africa
Key Countries Covered USA, Canada, Mexico, Germany, United Kingdom, France, Italy, China, Japan, South Korea, Australia, Brazil, Middle East, Africa, and others
Key Segments Covered Type, Application, and Region
Key Companies Profiled
  • Nishiji foods
  • The Wasabi Company
  • Yakami Orchard
  • The Bando Foods Company
  • Yuzuya Honten Co., Ltd.
  • SICA SAS SICODIS
  • Ponthier Sas
  • Barth Fruit AG
  • HIKARI FOODS CO., LTD.
  • Nishikidôri SASU PALMIFRANCE
  • Others
Report Coverage Market Forecast, Company Share Analysis, Competition Intelligence, Drivers, Restraints, Opportunities and Threats Analysis, Market Dynamics and Challenges, and Strategic Growth Initiatives
Customization & Pricing Available upon Request

Sudachi Market by Category

By Type, Sudachi Market is Segmented as:

  • Juice
  • Puree
  • Others

By Application, Sudachi Market is Segmented as:

  • Deserts
  • Sauces & Dressings
  • Meat, Poultry & Seafood
  • Bakery
  • Beverages
  • Others

By Region, Sudachi Market is segmented as:

  • North America
  • Latin America
  • Europe
  • Asia Pacific
  • Middle East and Africa

Frequently Asked Questions

How Big is the Sudachi Market?

The sudachi market share will reach nearly USD 47.9 Million by 2022.

At what Growth Rate is Sudachi Market Growing?

The sudachi statistics is growing at a CAGR of 1.7% in 2022 and is expected to reach a market value of USD 56.7 Million in 2032.

What is the North America Sudachi Market Outlook?

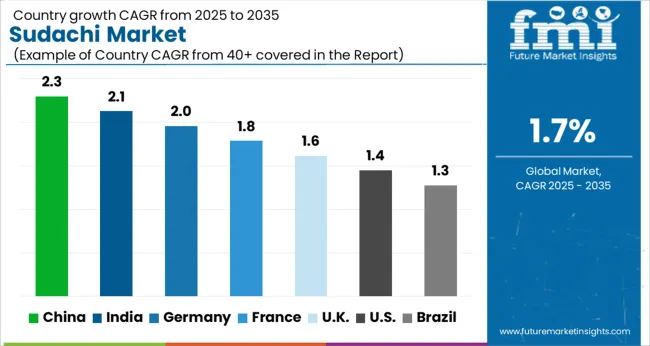
The North American sudachi market is expected to register a 2.4% CAGR between 2022 and 2032.

At What Rate will Sudachi Demand Grow in Europe?

The demand for sudachi is expected to grow at a 2.1% CAGR between 2022 and 2032.

What Are the Key Trends Shaping the Sudachi Market?

The sudachi market is predicted to grow because of the growing adoption of sudachi as a natural citrus flavoring agent in the food and beverage industry across the globe, therefore, positively impacting the sudachi market growth.

Table of Content

1. Executive Summary | Sudachi Market

    1.1. Global Market Outlook

    1.2. Demand-side Trends

    1.3. Supply-side Trends

    1.4. Technology Roadmap Analysis

    1.5. Analysis and Recommendations

2. Market Overview

    2.1. Market Coverage / Taxonomy

    2.2. Market Definition / Scope / Limitations

3. Market Background

    3.1. Market Dynamics

        3.1.1. Drivers

        3.1.2. Restraints

        3.1.3. Opportunity

        3.1.4. Trends

    3.2. Scenario Forecast

        3.2.1. Demand in Optimistic Scenario

        3.2.2. Demand in Likely Scenario

        3.2.3. Demand in Conservative Scenario

    3.3. Product Launches & Recent Developments

    3.4. Product Life Cycle Analysis

    3.5. Value Chain Analysis

        3.5.1. Supply Side Participants and Their Roles

            3.5.1.1. Producers

            3.5.1.2. Mid-Level Participants (Traders/ Agents/ Brokers)

            3.5.1.3. Wholesalers and Distributors

        3.5.2. % of Operating Margin Analysis

        3.5.3. List of Raw Material Suppliers

        3.5.4. List of Existing and Potential Buyers

    3.6. Global Market - Pricing Analysis

        3.6.1. Price Point Assessment by Region

        3.6.2. Price Point Assessment by Type

        3.6.3. Price Forecast till 2032

        3.6.4. Factors Affecting Pricing

    3.7. Forecast Factors - Relevance & Impact

    3.8. PESTLE and Porter’s Analysis

    3.9. Regulatory Landscape

        3.9.1. Packaging & Labelling Regulations

        3.9.2. Certifications and Certifying Agency Overview

        3.9.3. Import/Export Policies

    3.10. Regional Parent Market Outlook

    3.11. Consumers Survey Analysis

    3.12. Macro-Economic Factors

    3.13. Product Claims & Nutritional Information scanned by Buyers

4. Global Market Analysis 2017 to 2021 and Forecast, 2022 to 2032

    4.1. Historical Market Size Value (US$ Million) & Volume (MT) Analysis, 2017 to 2021

    4.2. Current and Future Market Size Value (US$ Million) & Volume (MT) Projections, 2022 to 2032

        4.2.1. Y-o-Y Growth Trend Analysis

        4.2.2. Absolute $ Opportunity Analysis

5. Global Market Analysis 2017 to 2021 and Forecast 2022 to 2032, By Type

    5.1. Introduction / Key Findings

    5.2. Historical Market Size Value (US$ Million) & Volume (MT) Analysis By Type, 2017 to 2021

    5.3. Current and Future Market Size Value (US$ Million) & Volume (MT) Analysis and Forecast By Type, 2022 to 2032

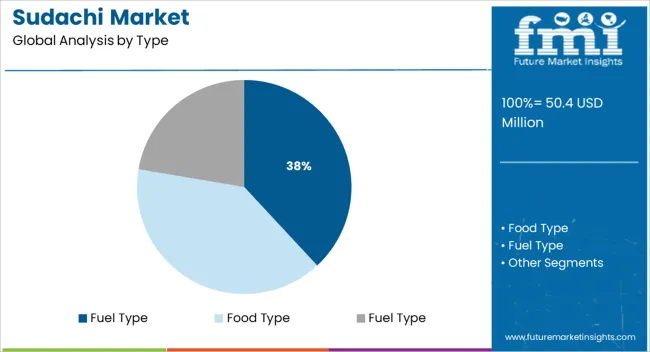
        5.3.1. Feed Type

        5.3.2. Food Type

        5.3.3. Fuel type

    5.4. Y-o-Y Growth Trend Analysis By Type, 2017 to 2021

    5.5. Absolute $ Opportunity Analysis By Type, 2022 to 2032

6. Global Market Analysis 2017 to 2021 and Forecast 2022 to 2032, By Application

    6.1. Introduction / Key Findings

    6.2. Historical Market Size Value (US$ Million) & Volume (MT) Analysis By Application, 2017 to 2021

    6.3. Current and Future Market Size Value (US$ Million) & Volume (MT) Analysis and Forecast By Application, 2022 to 2032

        6.3.1. Food & Beverages

        6.3.2. Animal Feed

        6.3.3. Dietary Supplements

        6.3.4. Pharmaceuticals

        6.3.5. Personal Care

        6.3.6. Bio Fuels

        6.3.7. Others

    6.4. Y-o-Y Growth Trend Analysis By Application, 2017 to 2021

    6.5. Absolute $ Opportunity Analysis By Application, 2022 to 2032

7. Global Market Analysis 2017 to 2021 and Forecast 2022 to 2032, By Region

    7.1. Introduction

    7.2. Historical Market Size Value (US$ Million) & Volume (MT) Analysis By Region, 2017 to 2021

    7.3. Current Market Size Value (US$ Million) & Volume (MT) Analysis and Forecast By Region, 2022 to 2032

        7.3.1. North America

        7.3.2. Latin America

        7.3.3. Europe

        7.3.4. East Asia

        7.3.5. South Asia

        7.3.6. Oceania

        7.3.7. Middle East and Africa

    7.4. Market Attractiveness Analysis By Region

8. North America Market Analysis 2017 to 2021 and Forecast 2022 to 2032, By Country

    8.1. Historical Market Size Value (US$ Million) & Volume (MT) Trend Analysis By Market Taxonomy, 2017 to 2021

    8.2. Market Size Value (US$ Million) & Volume (MT) Forecast By Market Taxonomy, 2022 to 2032

        8.2.1. By Country

            8.2.1.1. USA

            8.2.1.2. Canada

        8.2.2. By Type

        8.2.3. By Application

    8.3. Market Attractiveness Analysis

        8.3.1. By Country

        8.3.2. By Type

        8.3.3. By Application

    8.4. Key Takeaways

9. Latin America Market Analysis 2017 to 2021 and Forecast 2022 to 2032, By Country

    9.1. Historical Market Size Value (US$ Million) & Volume (MT) Trend Analysis By Market Taxonomy, 2017 to 2021

    9.2. Market Size Value (US$ Million) & Volume (MT) Forecast By Market Taxonomy, 2022 to 2032

        9.2.1. By Country

            9.2.1.1. Brazil

            9.2.1.2. Mexico

            9.2.1.3. Argentina

            9.2.1.4. Chile

            9.2.1.5. Peru

            9.2.1.6. Rest of Latin America

        9.2.2. By Type

        9.2.3. By Application

    9.3. Market Attractiveness Analysis

        9.3.1. By Country

        9.3.2. By Type

        9.3.3. By Application

    9.4. Key Takeaways

10. Europe Market Analysis 2017 to 2021 and Forecast 2022 to 2032, By Country

    10.1. Historical Market Size Value (US$ Million) & Volume (MT) Trend Analysis By Market Taxonomy, 2017 to 2021

    10.2. Market Size Value (US$ Million) & Volume (MT) Forecast By Market Taxonomy, 2022 to 2032

        10.2.1. By Country

            10.2.1.1. Germany

            10.2.1.2. Italy

            10.2.1.3. France

            10.2.1.4. United Kingdom

            10.2.1.5. Spain

            10.2.1.6. Russia

            10.2.1.7. BENELUX

            10.2.1.8. Poland

            10.2.1.9. Nordic Countries

            10.2.1.10. Rest of Europe

        10.2.2. By Type

        10.2.3. By Application

    10.3. Market Attractiveness Analysis

        10.3.1. By Country

        10.3.2. By Type

        10.3.3. By Application

    10.4. Key Takeaways

11. East Asia Market Analysis 2017 to 2021 and Forecast 2022 to 2032, By Country

    11.1. Historical Market Size Value (US$ Million) & Volume (MT) Trend Analysis By Market Taxonomy, 2017 to 2021

    11.2. Market Size Value (US$ Million) & Volume (MT) Forecast By Market Taxonomy, 2022 to 2032

        11.2.1. By Country

            11.2.1.1. China

            11.2.1.2. Japan

            11.2.1.3. South Korea

        11.2.2. By Type

        11.2.3. By Application

    11.3. Market Attractiveness Analysis

        11.3.1. By Country

        11.3.2. By Type

        11.3.3. By Application

    11.4. Key Takeaways

12. South Asia Market Analysis 2017 to 2021 and Forecast 2022 to 2032, By Country

    12.1. Historical Market Size Value (US$ Million) & Volume (MT) Trend Analysis By Market Taxonomy, 2017 to 2021

    12.2. Market Size Value (US$ Million) & Volume (MT) Forecast By Market Taxonomy, 2022 to 2032

        12.2.1. By Country

            12.2.1.1. India

            12.2.1.2. Thailand

            12.2.1.3. Malaysia

            12.2.1.4. Indonesia

            12.2.1.5. Rest of South Asia

        12.2.2. By Type

        12.2.3. By Application

    12.3. Market Attractiveness Analysis

        12.3.1. By Country

        12.3.2. By Type

        12.3.3. By Application

    12.4. Key Takeaways

13. Oceania Market Analysis 2017 to 2021 and Forecast 2022 to 2032, By Country

    13.1. Historical Market Size Value (US$ Million) & Volume (MT) Trend Analysis By Market Taxonomy, 2017 to 2021

    13.2. Market Size Value (US$ Million) & Volume (MT) Forecast By Market Taxonomy, 2022 to 2032

        13.2.1. By Country

            13.2.1.1. Australia

            13.2.1.2. New Zealand

        13.2.2. By Type

        13.2.3. By Application

    13.3. Market Attractiveness Analysis

        13.3.1. By Country

        13.3.2. By Type

        13.3.3. By Application

    13.4. Key Takeaways

14. Middle East and Africa Market Analysis 2017 to 2021 and Forecast 2022 to 2032, By Country

    14.1. Historical Market Size Value (US$ Million) & Volume (MT) Trend Analysis By Market Taxonomy, 2017 to 2021

    14.2. Market Size Value (US$ Million) & Volume (MT) Forecast By Market Taxonomy, 2022 to 2032

        14.2.1. By Country

            14.2.1.1. GCC Countries

            14.2.1.2. South Africa

            14.2.1.3. Central Africa

            14.2.1.4. North Africa

        14.2.2. By Type

        14.2.3. By Application

    14.3. Market Attractiveness Analysis

        14.3.1. By Country

        14.3.2. By Type

        14.3.3. By Application

    14.4. Key Takeaways

15. Key Countries Market Analysis

    15.1. USA

        15.1.1. Pricing Analysis

        15.1.2. Market Share Analysis, 2021

            15.1.2.1. By Type

            15.1.2.2. By Application

    15.2. Canada

        15.2.1. Pricing Analysis

        15.2.2. Market Share Analysis, 2021

            15.2.2.1. By Type

            15.2.2.2. By Application

    15.3. Brazil

        15.3.1. Pricing Analysis

        15.3.2. Market Share Analysis, 2021

            15.3.2.1. By Type

            15.3.2.2. By Application

    15.4. Mexico

        15.4.1. Pricing Analysis

        15.4.2. Market Share Analysis, 2021

            15.4.2.1. By Type

            15.4.2.2. By Application

    15.5. Argentina

        15.5.1. Pricing Analysis

        15.5.2. Market Share Analysis, 2021

            15.5.2.1. By Type

            15.5.2.2. By Application

    15.6. Chile

        15.6.1. Pricing Analysis

        15.6.2. Market Share Analysis, 2021

            15.6.2.1. By Type

            15.6.2.2. By Application

    15.7. Peru

        15.7.1. Pricing Analysis

        15.7.2. Market Share Analysis, 2021

            15.7.2.1. By Type

            15.7.2.2. By Application

    15.8. Germany

        15.8.1. Pricing Analysis

        15.8.2. Market Share Analysis, 2021

            15.8.2.1. By Type

            15.8.2.2. By Application

    15.9. Italy

        15.9.1. Pricing Analysis

        15.9.2. Market Share Analysis, 2021

            15.9.2.1. By Type

            15.9.2.2. By Application

    15.10. France

        15.10.1. Pricing Analysis

        15.10.2. Market Share Analysis, 2021

            15.10.2.1. By Type

            15.10.2.2. By Application

    15.11. Spain

        15.11.1. Pricing Analysis

        15.11.2. Market Share Analysis, 2021

            15.11.2.1. By Type

            15.11.2.2. By Application

    15.12. United Kingdom

        15.12.1. Pricing Analysis

        15.12.2. Market Share Analysis, 2021

            15.12.2.1. By Type

            15.12.2.2. By Application

    15.13. Russia

        15.13.1. Pricing Analysis

        15.13.2. Market Share Analysis, 2021

            15.13.2.1. By Type

            15.13.2.2. By Application

    15.14. Poland

        15.14.1. Pricing Analysis

        15.14.2. Market Share Analysis, 2021

            15.14.2.1. By Type

            15.14.2.2. By Application

    15.15. BENELUX

        15.15.1. Pricing Analysis

        15.15.2. Market Share Analysis, 2021

            15.15.2.1. By Type

            15.15.2.2. By Application

    15.16. Nordic Countries

        15.16.1. Pricing Analysis

        15.16.2. Market Share Analysis, 2021

            15.16.2.1. By Type

            15.16.2.2. By Application

    15.17. China

        15.17.1. Pricing Analysis

        15.17.2. Market Share Analysis, 2021

            15.17.2.1. By Type

            15.17.2.2. By Application

    15.18. Japan

        15.18.1. Pricing Analysis

        15.18.2. Market Share Analysis, 2021

            15.18.2.1. By Type

            15.18.2.2. By Application

    15.19. South Korea

        15.19.1. Pricing Analysis

        15.19.2. Market Share Analysis, 2021

            15.19.2.1. By Type

            15.19.2.2. By Application

    15.20. India

        15.20.1. Pricing Analysis

        15.20.2. Market Share Analysis, 2021

            15.20.2.1. By Type

            15.20.2.2. By Application

    15.21. Thailand

        15.21.1. Pricing Analysis

        15.21.2. Market Share Analysis, 2021

            15.21.2.1. By Type

            15.21.2.2. By Application

    15.22. Indonesia

        15.22.1. Pricing Analysis

        15.22.2. Market Share Analysis, 2021

            15.22.2.1. By Type

            15.22.2.2. By Application

    15.23. Malaysia

        15.23.1. Pricing Analysis

        15.23.2. Market Share Analysis, 2021

            15.23.2.1. By Type

            15.23.2.2. By Application

    15.24. Singapore

        15.24.1. Pricing Analysis

        15.24.2. Market Share Analysis, 2021

            15.24.2.1. By Type

            15.24.2.2. By Application

    15.25. GCC Countries

        15.25.1. Pricing Analysis

        15.25.2. Market Share Analysis, 2021

            15.25.2.1. By Type

            15.25.2.2. By Application

    15.26. South Africa

        15.26.1. Pricing Analysis

        15.26.2. Market Share Analysis, 2021

            15.26.2.1. By Type

            15.26.2.2. By Application

    15.27. Central Africa

        15.27.1. Pricing Analysis

        15.27.2. Market Share Analysis, 2021

            15.27.2.1. By Type

            15.27.2.2. By Application

    15.28. North Africa

        15.28.1. Pricing Analysis

        15.28.2. Market Share Analysis, 2021

            15.28.2.1. By Type

            15.28.2.2. By Application

16. Market Structure Analysis

    16.1. Competition Dashboard

    16.2. Competition Benchmarking

    16.3. Market Share Analysis of Top Players

        16.3.1. By Regional

        16.3.2. By Type

        16.3.3. By Application

17. Competition Analysis

    17.1. Competition Deep Dive

        17.1.1. Nishiji foods

            17.1.1.1. Overview

            17.1.1.2. Product Portfolio

            17.1.1.3. Profitability by Market Segments (Product/Age /Sales Channel/Region)

            17.1.1.4. Sales Footprint

            17.1.1.5. Strategy Overview

                17.1.1.5.1. Marketing Strategy

                17.1.1.5.2. Product Strategy

                17.1.1.5.3. Channel Strategy

        17.1.2. The Wasabi Company

            17.1.2.1. Overview

            17.1.2.2. Product Portfolio

            17.1.2.3. Profitability by Market Segments (Product/Age /Sales Channel/Region)

            17.1.2.4. Sales Footprint

            17.1.2.5. Strategy Overview

                17.1.2.5.1. Marketing Strategy

                17.1.2.5.2. Product Strategy

                17.1.2.5.3. Channel Strategy

        17.1.3. Yakami Orchard

            17.1.3.1. Overview

            17.1.3.2. Product Portfolio

            17.1.3.3. Profitability by Market Segments (Product/Age /Sales Channel/Region)

            17.1.3.4. Sales Footprint

            17.1.3.5. Strategy Overview

                17.1.3.5.1. Marketing Strategy

                17.1.3.5.2. Product Strategy

                17.1.3.5.3. Channel Strategy

        17.1.4. The Bando Foods Company

            17.1.4.1. Overview

            17.1.4.2. Product Portfolio

            17.1.4.3. Profitability by Market Segments (Product/Age /Sales Channel/Region)

            17.1.4.4. Sales Footprint

            17.1.4.5. Strategy Overview

                17.1.4.5.1. Marketing Strategy

                17.1.4.5.2. Product Strategy

                17.1.4.5.3. Channel Strategy

        17.1.5. Yuzuya Honten Co.

            17.1.5.1. Overview

            17.1.5.2. Product Portfolio

            17.1.5.3. Profitability by Market Segments (Product/Age /Sales Channel/Region)

            17.1.5.4. Sales Footprint

            17.1.5.5. Strategy Overview

                17.1.5.5.1. Marketing Strategy

                17.1.5.5.2. Product Strategy

                17.1.5.5.3. Channel Strategy

        17.1.6. SICA SAS SICODIS

            17.1.6.1. Overview

            17.1.6.2. Product Portfolio

            17.1.6.3. Profitability by Market Segments (Product/Age /Sales Channel/Region)

            17.1.6.4. Sales Footprint

            17.1.6.5. Strategy Overview

                17.1.6.5.1. Marketing Strategy

                17.1.6.5.2. Product Strategy

                17.1.6.5.3. Channel Strategy

        17.1.7. Ponthier Sas

            17.1.7.1. Overview

            17.1.7.2. Product Portfolio

            17.1.7.3. Profitability by Market Segments (Product/Age /Sales Channel/Region)

            17.1.7.4. Sales Footprint

            17.1.7.5. Strategy Overview

                17.1.7.5.1. Marketing Strategy

                17.1.7.5.2. Product Strategy

                17.1.7.5.3. Channel Strategy

        17.1.8. Barth Fruit AG

            17.1.8.1. Overview

            17.1.8.2. Product Portfolio

            17.1.8.3. Profitability by Market Segments (Product/Age /Sales Channel/Region)

            17.1.8.4. Sales Footprint

            17.1.8.5. Strategy Overview

                17.1.8.5.1. Marketing Strategy

                17.1.8.5.2. Product Strategy

                17.1.8.5.3. Channel Strategy

        17.1.9. HIKARI FOODS CO. LTD

            17.1.9.1. Overview

            17.1.9.2. Product Portfolio

            17.1.9.3. Profitability by Market Segments (Product/Age /Sales Channel/Region)

            17.1.9.4. Sales Footprint

            17.1.9.5. Strategy Overview

                17.1.9.5.1. Marketing Strategy

                17.1.9.5.2. Product Strategy

                17.1.9.5.3. Channel Strategy

        17.1.10. Nishikidôri SASU PALMIFRANCE

            17.1.10.1. Overview

            17.1.10.2. Product Portfolio

            17.1.10.3. Profitability by Market Segments (Product/Age /Sales Channel/Region)

            17.1.10.4. Sales Footprint

            17.1.10.5. Strategy Overview

                17.1.10.5.1. Marketing Strategy

                17.1.10.5.2. Product Strategy

                17.1.10.5.3. Channel Strategy

        17.1.11. Kaiser Foods

            17.1.11.1. Overview

            17.1.11.2. Product Portfolio

            17.1.11.3. Profitability by Market Segments (Product/Age /Sales Channel/Region)

            17.1.11.4. Sales Footprint

            17.1.11.5. Strategy Overview

                17.1.11.5.1. Marketing Strategy

                17.1.11.5.2. Product Strategy

                17.1.11.5.3. Channel Strategy

        17.1.12. Ikeda

            17.1.12.1. Overview

            17.1.12.2. Product Portfolio

            17.1.12.3. Profitability by Market Segments (Product/Age /Sales Channel/Region)

            17.1.12.4. Sales Footprint

            17.1.12.5. Strategy Overview

                17.1.12.5.1. Marketing Strategy

                17.1.12.5.2. Product Strategy

                17.1.12.5.3. Channel Strategy

        17.1.13. Others

18. Assumptions & Acronyms Used

19. Research Methodology

List of Tables

Table 1: Global Market Value (US$ Million) Forecast by Region, 2017 to 2032

Table 2: Global Market Volume (MT) Forecast by Region, 2017 to 2032

Table 3: Global Market Value (US$ Million) Forecast by Type, 2017 to 2032

Table 4: Global Market Volume (MT) Forecast by Type, 2017 to 2032

Table 5: Global Market Value (US$ Million) Forecast by Application, 2017 to 2032

Table 6: Global Market Volume (MT) Forecast by Application, 2017 to 2032

Table 7: North America Market Value (US$ Million) Forecast by Country, 2017 to 2032

Table 8: North America Market Volume (MT) Forecast by Country, 2017 to 2032

Table 9: North America Market Value (US$ Million) Forecast by Type, 2017 to 2032

Table 10: North America Market Volume (MT) Forecast by Type, 2017 to 2032

Table 11: North America Market Value (US$ Million) Forecast by Application, 2017 to 2032

Table 12: North America Market Volume (MT) Forecast by Application, 2017 to 2032

Table 13: Latin America Market Value (US$ Million) Forecast by Country, 2017 to 2032

Table 14: Latin America Market Volume (MT) Forecast by Country, 2017 to 2032

Table 15: Latin America Market Value (US$ Million) Forecast by Type, 2017 to 2032

Table 16: Latin America Market Volume (MT) Forecast by Type, 2017 to 2032

Table 17: Latin America Market Value (US$ Million) Forecast by Application, 2017 to 2032

Table 18: Latin America Market Volume (MT) Forecast by Application, 2017 to 2032

Table 19: Europe Market Value (US$ Million) Forecast by Country, 2017 to 2032

Table 20: Europe Market Volume (MT) Forecast by Country, 2017 to 2032

Table 21: Europe Market Value (US$ Million) Forecast by Type, 2017 to 2032

Table 22: Europe Market Volume (MT) Forecast by Type, 2017 to 2032

Table 23: Europe Market Value (US$ Million) Forecast by Application, 2017 to 2032

Table 24: Europe Market Volume (MT) Forecast by Application, 2017 to 2032

Table 25: East Asia Market Value (US$ Million) Forecast by Country, 2017 to 2032

Table 26: East Asia Market Volume (MT) Forecast by Country, 2017 to 2032

Table 27: East Asia Market Value (US$ Million) Forecast by Type, 2017 to 2032

Table 28: East Asia Market Volume (MT) Forecast by Type, 2017 to 2032

Table 29: East Asia Market Value (US$ Million) Forecast by Application, 2017 to 2032

Table 30: East Asia Market Volume (MT) Forecast by Application, 2017 to 2032

Table 31: South Asia Market Value (US$ Million) Forecast by Country, 2017 to 2032

Table 32: South Asia Market Volume (MT) Forecast by Country, 2017 to 2032

Table 33: South Asia Market Value (US$ Million) Forecast by Type, 2017 to 2032

Table 34: South Asia Market Volume (MT) Forecast by Type, 2017 to 2032

Table 35: South Asia Market Value (US$ Million) Forecast by Application, 2017 to 2032

Table 36: South Asia Market Volume (MT) Forecast by Application, 2017 to 2032

Table 37: Oceania Market Value (US$ Million) Forecast by Country, 2017 to 2032

Table 38: Oceania Market Volume (MT) Forecast by Country, 2017 to 2032

Table 39: Oceania Market Value (US$ Million) Forecast by Type, 2017 to 2032

Table 40: Oceania Market Volume (MT) Forecast by Type, 2017 to 2032

Table 41: Oceania Market Value (US$ Million) Forecast by Application, 2017 to 2032

Table 42: Oceania Market Volume (MT) Forecast by Application, 2017 to 2032

Table 43: MEA Market Value (US$ Million) Forecast by Country, 2017 to 2032

Table 44: MEA Market Volume (MT) Forecast by Country, 2017 to 2032

Table 45: MEA Market Value (US$ Million) Forecast by Type, 2017 to 2032

Table 46: MEA Market Volume (MT) Forecast by Type, 2017 to 2032

Table 47: MEA Market Value (US$ Million) Forecast by Application, 2017 to 2032

Table 48: MEA Market Volume (MT) Forecast by Application, 2017 to 2032

List of Charts

Figure 1: Global Market Value (US$ Million) by Type, 2022 to 2032

Figure 2: Global Market Value (US$ Million) by Application, 2022 to 2032

Figure 3: Global Market Value (US$ Million) by Region, 2022 to 2032

Figure 4: Global Market Value (US$ Million) Analysis by Region, 2017 to 2032

Figure 5: Global Market Volume (MT) Analysis by Region, 2017 to 2032

Figure 6: Global Market Value Share (%) and BPS Analysis by Region, 2022 to 2032

Figure 7: Global Market Y-o-Y Growth (%) Projections by Region, 2022 to 2032

Figure 8: Global Market Value (US$ Million) Analysis by Type, 2017 to 2032

Figure 9: Global Market Volume (MT) Analysis by Type, 2017 to 2032

Figure 10: Global Market Value Share (%) and BPS Analysis by Type, 2022 to 2032

Figure 11: Global Market Y-o-Y Growth (%) Projections by Type, 2022 to 2032

Figure 12: Global Market Value (US$ Million) Analysis by Application, 2017 to 2032

Figure 13: Global Market Volume (MT) Analysis by Application, 2017 to 2032

Figure 14: Global Market Value Share (%) and BPS Analysis by Application, 2022 to 2032

Figure 15: Global Market Y-o-Y Growth (%) Projections by Application, 2022 to 2032

Figure 16: Global Market Attractiveness by Type, 2022 to 2032

Figure 17: Global Market Attractiveness by Application, 2022 to 2032

Figure 18: Global Market Attractiveness by Region, 2022 to 2032

Figure 19: North America Market Value (US$ Million) by Type, 2022 to 2032

Figure 20: North America Market Value (US$ Million) by Application, 2022 to 2032

Figure 21: North America Market Value (US$ Million) by Country, 2022 to 2032

Figure 22: North America Market Value (US$ Million) Analysis by Country, 2017 to 2032

Figure 23: North America Market Volume (MT) Analysis by Country, 2017 to 2032

Figure 24: North America Market Value Share (%) and BPS Analysis by Country, 2022 to 2032

Figure 25: North America Market Y-o-Y Growth (%) Projections by Country, 2022 to 2032

Figure 26: North America Market Value (US$ Million) Analysis by Type, 2017 to 2032

Figure 27: North America Market Volume (MT) Analysis by Type, 2017 to 2032

Figure 28: North America Market Value Share (%) and BPS Analysis by Type, 2022 to 2032

Figure 29: North America Market Y-o-Y Growth (%) Projections by Type, 2022 to 2032

Figure 30: North America Market Value (US$ Million) Analysis by Application, 2017 to 2032

Figure 31: North America Market Volume (MT) Analysis by Application, 2017 to 2032

Figure 32: North America Market Value Share (%) and BPS Analysis by Application, 2022 to 2032

Figure 33: North America Market Y-o-Y Growth (%) Projections by Application, 2022 to 2032

Figure 34: North America Market Attractiveness by Type, 2022 to 2032

Figure 35: North America Market Attractiveness by Application, 2022 to 2032

Figure 36: North America Market Attractiveness by Country, 2022 to 2032

Figure 37: Latin America Market Value (US$ Million) by Type, 2022 to 2032

Figure 38: Latin America Market Value (US$ Million) by Application, 2022 to 2032

Figure 39: Latin America Market Value (US$ Million) by Country, 2022 to 2032

Figure 40: Latin America Market Value (US$ Million) Analysis by Country, 2017 to 2032

Figure 41: Latin America Market Volume (MT) Analysis by Country, 2017 to 2032

Figure 42: Latin America Market Value Share (%) and BPS Analysis by Country, 2022 to 2032

Figure 43: Latin America Market Y-o-Y Growth (%) Projections by Country, 2022 to 2032

Figure 44: Latin America Market Value (US$ Million) Analysis by Type, 2017 to 2032

Figure 45: Latin America Market Volume (MT) Analysis by Type, 2017 to 2032

Figure 46: Latin America Market Value Share (%) and BPS Analysis by Type, 2022 to 2032

Figure 47: Latin America Market Y-o-Y Growth (%) Projections by Type, 2022 to 2032

Figure 48: Latin America Market Value (US$ Million) Analysis by Application, 2017 to 2032

Figure 49: Latin America Market Volume (MT) Analysis by Application, 2017 to 2032

Figure 50: Latin America Market Value Share (%) and BPS Analysis by Application, 2022 to 2032

Figure 51: Latin America Market Y-o-Y Growth (%) Projections by Application, 2022 to 2032

Figure 52: Latin America Market Attractiveness by Type, 2022 to 2032

Figure 53: Latin America Market Attractiveness by Application, 2022 to 2032

Figure 54: Latin America Market Attractiveness by Country, 2022 to 2032

Figure 55: Europe Market Value (US$ Million) by Type, 2022 to 2032

Figure 56: Europe Market Value (US$ Million) by Application, 2022 to 2032

Figure 57: Europe Market Value (US$ Million) by Country, 2022 to 2032

Figure 58: Europe Market Value (US$ Million) Analysis by Country, 2017 to 2032

Figure 59: Europe Market Volume (MT) Analysis by Country, 2017 to 2032

Figure 60: Europe Market Value Share (%) and BPS Analysis by Country, 2022 to 2032

Figure 61: Europe Market Y-o-Y Growth (%) Projections by Country, 2022 to 2032

Figure 62: Europe Market Value (US$ Million) Analysis by Type, 2017 to 2032

Figure 63: Europe Market Volume (MT) Analysis by Type, 2017 to 2032

Figure 64: Europe Market Value Share (%) and BPS Analysis by Type, 2022 to 2032

Figure 65: Europe Market Y-o-Y Growth (%) Projections by Type, 2022 to 2032

Figure 66: Europe Market Value (US$ Million) Analysis by Application, 2017 to 2032

Figure 67: Europe Market Volume (MT) Analysis by Application, 2017 to 2032

Figure 68: Europe Market Value Share (%) and BPS Analysis by Application, 2022 to 2032

Figure 69: Europe Market Y-o-Y Growth (%) Projections by Application, 2022 to 2032

Figure 70: Europe Market Attractiveness by Type, 2022 to 2032

Figure 71: Europe Market Attractiveness by Application, 2022 to 2032

Figure 72: Europe Market Attractiveness by Country, 2022 to 2032

Figure 73: East Asia Market Value (US$ Million) by Type, 2022 to 2032

Figure 74: East Asia Market Value (US$ Million) by Application, 2022 to 2032

Figure 75: East Asia Market Value (US$ Million) by Country, 2022 to 2032

Figure 76: East Asia Market Value (US$ Million) Analysis by Country, 2017 to 2032

Figure 77: East Asia Market Volume (MT) Analysis by Country, 2017 to 2032

Figure 78: East Asia Market Value Share (%) and BPS Analysis by Country, 2022 to 2032

Figure 79: East Asia Market Y-o-Y Growth (%) Projections by Country, 2022 to 2032

Figure 80: East Asia Market Value (US$ Million) Analysis by Type, 2017 to 2032

Figure 81: East Asia Market Volume (MT) Analysis by Type, 2017 to 2032

Figure 82: East Asia Market Value Share (%) and BPS Analysis by Type, 2022 to 2032

Figure 83: East Asia Market Y-o-Y Growth (%) Projections by Type, 2022 to 2032

Figure 84: East Asia Market Value (US$ Million) Analysis by Application, 2017 to 2032

Figure 85: East Asia Market Volume (MT) Analysis by Application, 2017 to 2032

Figure 86: East Asia Market Value Share (%) and BPS Analysis by Application, 2022 to 2032

Figure 87: East Asia Market Y-o-Y Growth (%) Projections by Application, 2022 to 2032

Figure 88: East Asia Market Attractiveness by Type, 2022 to 2032

Figure 89: East Asia Market Attractiveness by Application, 2022 to 2032

Figure 90: East Asia Market Attractiveness by Country, 2022 to 2032

Figure 91: South Asia Market Value (US$ Million) by Type, 2022 to 2032

Figure 92: South Asia Market Value (US$ Million) by Application, 2022 to 2032

Figure 93: South Asia Market Value (US$ Million) by Country, 2022 to 2032

Figure 94: South Asia Market Value (US$ Million) Analysis by Country, 2017 to 2032

Figure 95: South Asia Market Volume (MT) Analysis by Country, 2017 to 2032

Figure 96: South Asia Market Value Share (%) and BPS Analysis by Country, 2022 to 2032

Figure 97: South Asia Market Y-o-Y Growth (%) Projections by Country, 2022 to 2032

Figure 98: South Asia Market Value (US$ Million) Analysis by Type, 2017 to 2032

Figure 99: South Asia Market Volume (MT) Analysis by Type, 2017 to 2032

Figure 100: South Asia Market Value Share (%) and BPS Analysis by Type, 2022 to 2032

Figure 101: South Asia Market Y-o-Y Growth (%) Projections by Type, 2022 to 2032

Figure 102: South Asia Market Value (US$ Million) Analysis by Application, 2017 to 2032

Figure 103: South Asia Market Volume (MT) Analysis by Application, 2017 to 2032

Figure 104: South Asia Market Value Share (%) and BPS Analysis by Application, 2022 to 2032

Figure 105: South Asia Market Y-o-Y Growth (%) Projections by Application, 2022 to 2032

Figure 106: South Asia Market Attractiveness by Type, 2022 to 2032

Figure 107: South Asia Market Attractiveness by Application, 2022 to 2032

Figure 108: South Asia Market Attractiveness by Country, 2022 to 2032

Figure 109: Oceania Market Value (US$ Million) by Type, 2022 to 2032

Figure 110: Oceania Market Value (US$ Million) by Application, 2022 to 2032

Figure 111: Oceania Market Value (US$ Million) by Country, 2022 to 2032

Figure 112: Oceania Market Value (US$ Million) Analysis by Country, 2017 to 2032

Figure 113: Oceania Market Volume (MT) Analysis by Country, 2017 to 2032

Figure 114: Oceania Market Value Share (%) and BPS Analysis by Country, 2022 to 2032

Figure 115: Oceania Market Y-o-Y Growth (%) Projections by Country, 2022 to 2032

Figure 116: Oceania Market Value (US$ Million) Analysis by Type, 2017 to 2032

Figure 117: Oceania Market Volume (MT) Analysis by Type, 2017 to 2032

Figure 118: Oceania Market Value Share (%) and BPS Analysis by Type, 2022 to 2032

Figure 119: Oceania Market Y-o-Y Growth (%) Projections by Type, 2022 to 2032

Figure 120: Oceania Market Value (US$ Million) Analysis by Application, 2017 to 2032

Figure 121: Oceania Market Volume (MT) Analysis by Application, 2017 to 2032

Figure 122: Oceania Market Value Share (%) and BPS Analysis by Application, 2022 to 2032

Figure 123: Oceania Market Y-o-Y Growth (%) Projections by Application, 2022 to 2032

Figure 124: Oceania Market Attractiveness by Type, 2022 to 2032

Figure 125: Oceania Market Attractiveness by Application, 2022 to 2032

Figure 126: Oceania Market Attractiveness by Country, 2022 to 2032

Figure 127: MEA Market Value (US$ Million) by Type, 2022 to 2032

Figure 128: MEA Market Value (US$ Million) by Application, 2022 to 2032

Figure 129: MEA Market Value (US$ Million) by Country, 2022 to 2032

Figure 130: MEA Market Value (US$ Million) Analysis by Country, 2017 to 2032

Figure 131: MEA Market Volume (MT) Analysis by Country, 2017 to 2032

Figure 132: MEA Market Value Share (%) and BPS Analysis by Country, 2022 to 2032

Figure 133: MEA Market Y-o-Y Growth (%) Projections by Country, 2022 to 2032

Figure 134: MEA Market Value (US$ Million) Analysis by Type, 2017 to 2032

Figure 135: MEA Market Volume (MT) Analysis by Type, 2017 to 2032

Figure 136: MEA Market Value Share (%) and BPS Analysis by Type, 2022 to 2032

Figure 137: MEA Market Y-o-Y Growth (%) Projections by Type, 2022 to 2032

Figure 138: MEA Market Value (US$ Million) Analysis by Application, 2017 to 2032

Figure 139: MEA Market Volume (MT) Analysis by Application, 2017 to 2032

Figure 140: MEA Market Value Share (%) and BPS Analysis by Application, 2022 to 2032

Figure 141: MEA Market Y-o-Y Growth (%) Projections by Application, 2022 to 2032

Figure 142: MEA Market Attractiveness by Type, 2022 to 2032

Figure 143: MEA Market Attractiveness by Application, 2022 to 2032

Figure 144: MEA Market Attractiveness by Country, 2022 to 2032

Recommendations

Food and Beverage

Citrus Oil Market

Published : April 2024

Food and Beverage

Citrus Flavors Market

Published : August 2023

Food and Beverage

Citrus Seeds Market

Published : June 2023

Food and Beverage

Citrus Yogurt Market

Published : April 2023

Explore Food and Beverage Insights

View Reports