Reports

- Global Locations -

Headquarters

Future Market Insights, Inc.

Christiana Corporate, 200
Continental Drive, Suite 401,
Newark, Delaware - 19713,
United States

T: +1-347-918-3531

Americas

Future Market Insights, Inc.

616 Corporate Way, Suite 2-9018,
Valley Cottage, NY 10989, United States

MEA

Future Market Insights

1602-6 Jumeirah Bay X2 Tower, Plot No: JLT-PH2-X2A,
Jumeirah Lakes Towers, Dubai,
United Arab Emirates

Europe

Future Market Insights

3rd Floor, 207 Regent Street,
W1B 3HH London
United Kingdom

T: + 44 (0) 20 8123 9659

Asia Pacific

Future Market Insights

IndiaLand Global Tech Park, Unit UG-1, Behind Grand HighStreet, Phase 1, Hinjawadi, MH, Pune – 411057, India

Tackifier Market Overview for 2024 to 2034

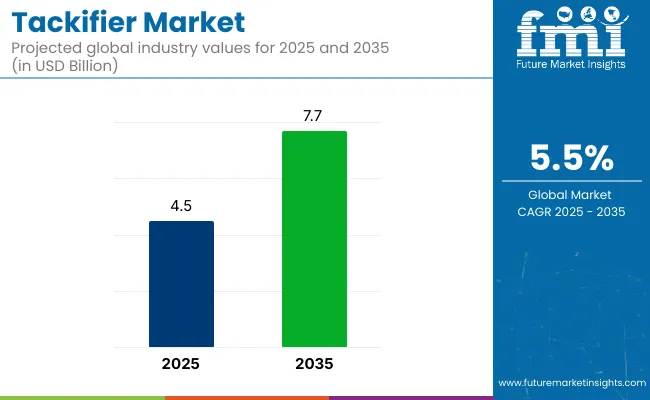
The value of the tackifier market is estimated to be US$ 4.3 billion in 2024. In 2023, the market value was US$ 4.0 billion. The market is expected to grow at a CAGR of 5.5% over the forecast period from 2024 to 2034. By 2034, the market valuation is predicted to reach US$ 7.3 billion.

Tackifier Market Analysis and Insights

  • Tackifiers are integral parts of adhesives. Thus, the growing demand for adhesives is instrumental to the growth of the tackifier market. With the rise of various industries requiring adhesives, the tackifier market is growing.
  • The sticky nature of the product makes tackifiers important for adhesives used in the construction industry. Thus, the rise of the construction industry is conducive to the growth of the tackifier market.
  • As the construction industry is growing, the needs for building construction are getting diverse. There is a greater need for adhesives that are pressure-sensitive and water-borne. Adhesives use tackifiers to meet the varying needs of the construction industry.
  • Several industries, such as automobile, packaging, and printing, use tackifiers, ensuring the diversity of the market for the chemical compound.
  • While tackifiers make up a major part of adhesives worldwide, tackifier-free adhesive options have also emerged. Thus, there is a constraint placed on the growth of the market.
Attributes Details
Tackifier Market Size in 2024 US$ 4.3 billion
Projected Market Value by 2034 US$ 7.3 billion
Value-based CAGR from 2024 to 2034 5.5%

Don't pay for what you don't need

Customize your report by selecting specific countries or regions and save 30%!

Historical Performance of the Tackifier Market

The tackifier market was valued at US$ 3.0 billion in 2019. The market progressed at a CAGR of 7.5% during the historical period from 2019 to 2023.

The growing needs of the construction industry were met by the rising supply of adhesives, boosting the tackifier market. Increased use of tackifiers in packaging and the rise of the packaging industry also benefited the market during the historical period. In 2023, the market value reached US$ 4.0 billion.

Market Value (2019) US$ 3.0 billion
Historical CAGR (2018 to 2022) 7.5%
Historical Market Valuation (2022) US$ 4.0 billion

Long-term Analysis of the Tackifier Market

The tackifier market is marked to be worth US$ 4.3 billion in 2024. The market is projected to grow at a CAGR of 5.5% over the forecast period.

Over the forecast period, the use of adhesives, and in turn tackifiers, is expected to continue growing strong. To satisfy the differing needs of the ever-evolving construction industry, the demand for adhesives is increasing, propelling the market’s growth. In addition to the construction industry, tackifier-infused adhesives are also used in several industries, such as pharmaceutical and agriculture. Thus, there are growth prospects for tackifiers over the forecast period.

However, the progress of the market over the forecast period is predicted to be more restrained than the historical period. The growing adoption of tackifier-free adhesives is a major factor restraining market growth. By 2034, the market for tackifiers is expected to reach a valuation of US$ 7.3 billion.

Trends in the Tackifier Market

  • Apart from economically-developed nations, the construction industry is also growing in under-explored areas. The wide penetration of the construction industry is helping the tackifier market to have a wide appeal, too.
  • Tackifiers’ status as a resin-based substance provides a negative outlook to the product in certain quarters. As a result, tackifiers are also subject to stringent rules from various regulatory bodies.
  • To get around sustainability issues surrounding the product, manufacturers are producing bio-based tackifiers. Thus, there is increased production of tackifiers that are based on pine and poly (β-pinene), among other sustainable materials.
  • The use of tackifiers in the agricultural sector is growing. The use of tackifiers has been linked with the stoppage of soil erosion. Tackifiers help to keep mulch rooted to the ground, helping the agriculture sector to face the effects of rain and wind.
  • There has been a growing demand for hot-melt adhesives from various industries. Tackifiers are majorly used in hot melt adhesives and thus, the market is benefiting from the increasing preference shown toward adhesives.
  • Tackifier production can often be at the mercy of the price of raw materials. The fluctuating nature of the raw materials required for tackifiers has the potential to hinder the market.
  • Adhesives and tackifiers are an integral part of bookbinding. Thus, the rising sales of printed books positively impact the tackifier industry.
Nikhil Kaitwade
Nikhil Kaitwade

Principal Consultant

Talk to Analyst

Find your sweet spots for generating winning opportunities in this market.

Comparative View of Adjacent Markets

Besides the tackifier market, key attributes of two other markets related to adhesives have been discussed in the section below. The markets are the electronics adhesive market and the structural adhesive market.

By looking at the markets in conjunction, the growing scope of adhesives can be witnessed. In addition, the challenges faced by markets related to adhesives have also been highlighted.

Tackifier Market:

Attributes Tackifier Market
Value-based CAGR (2024 to 2034) 5.5%
Market Trends
  • Production of bio-based tackifiers
  • Use of tackifiers to tackle soil erosion
Restraint
  • Rising popularity of tackifier-free adhesives
Growth Factors
  • Growth of the construction industry
  • Use of tackifiers in a diverse array of industries

Electronics Adhesive Market:

Attributes Electronics Adhesive Market
Value-based CAGR (2024 to 2034) 9.0%
Market Trend
  • Emergence of advanced technologies necessitating higher quality adhesives for electronics
Restraint
  • Threat of strict regulations
Growth Factor
  • Use of adhesives in electronic wearable devices

Structural Adhesive Market:

Attributes Structural Adhesive Market
Value-based CAGR (2024 to 2034) 4.8%
Market Trend
  • Improved structural adhesives with capabilities such as enhanced adhesion and improved durability
Restraint
  • Concerns regarding the impact of the external environment on structural adhesives
Growth Factors
  • Customized structural adhesives to meet the varied requirements of diverse customers

Category-wise Outlook

The tackifier market can be segregated into two segments: product and feedstock. By looking at the segments, the product higher in demand among tackifiers can be known.

Popularity of Hot Melt Adhesives Ensures Demand for Hydrocarbon Resins

Attributes Details
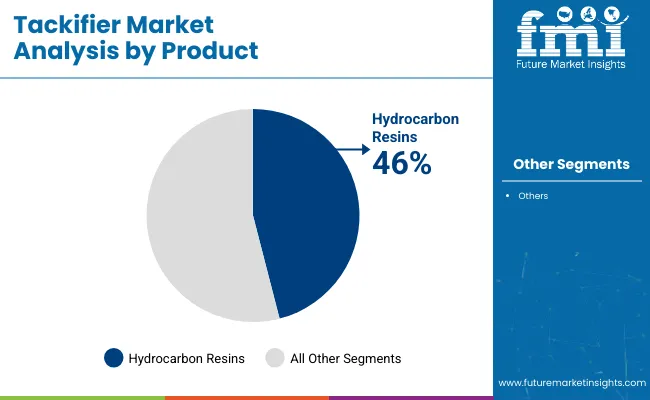
Top Product Hydrocarbon Resins
CAGR (2024 to 2034) 5.2%

Tackifiers in the form of hydrocarbon resins are projected to show progress in the market. From 2024 to 2034, the CAGR for hydrocarbon resins is pegged at 5.2%.

Hydrocarbon resins have wide application in a number of industries, from bookbinding to vehicles. However, it is the use of the product as a tackifier in hot-melt adhesives that is prominent. As hot-melt adhesives grow in demand, the market for hydrocarbon resins is getting propelled.

Rising Demand for Synthetic Tackifiers for Feedstock

Attributes Details
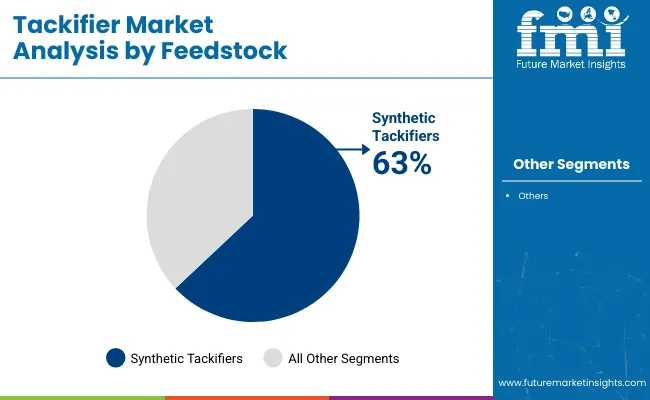
Top Feedstock Synthetic Tackifiers
CAGR (2024 to 2034) 5.0%

Synthetic tackifiers lead the market by feedstock. Over the forecast period, synthetic tackifiers are expected to register a CAGR of 5.0%.

Synthetic tackifiers are considered the go-to feedstock product in the market. The product has earned the trust of end-users, and thus, there is continued demand for synthetic tackifiers. However, biobased/natural tackifiers are also growing in popularity. As sustainability concerns grow, biobased tackifiers have the potential to drive the market.

Get the data you need at a Fraction of the cost

Personalize your report by choosing insights you need
and save 40%!

Country-Wise Analysis

Asia Pacific is marked to have significant potential for market growth. The growing economies in the region are paving the way for the rise of the construction industry. Other industries that involve prominent use of tackifiers like automobile and packaging, are marked for progress in the region. Thus, the Asia Pacific tackifier market is rife with opportunities.

Europe is another significant region in the market. The proliferation of technology in the region, as well as the commitment to sustainability, is helping the market to grow in Europe.

Countries CAGR
United States 5.8%
United Kingdom 6.6%
China 7.0%
South Korea 7.2%
Japan 6.7%

Rapidly Rising Construction Industry in South Korea Drives Tackifier Market

South Korea is one of the most promising countries in the market for tackifiers. From 2024 to 2034, the CAGR for the market in South Korea is predicted to be 7.2%.

The construction industry is experiencing landmark developments in South Korea. The industrial value of construction contracts is also increasing, as put forward by the Korean Statistical Information Service (KOSIS). Thus, the use of tackifiers is expected to continue growing in South Korea.

Chinese Companies Exporting Tackifiers in Huge Quantities

China is not far behind South Korea when it comes to progress predicted for the market. For the forecast period, the CAGR for the market in China is predicted to be 7.0%.

In addition to rising usage, Chinese producers are also exporting tackifiers. Guangdong Komo Co. Ltd. is one example of a company that is engaged in exporting natural biobased tackifiers. Thus, the market is expected to rise in China.

Robust Automobile Industry in Japan Fuels Demand for Tackifiers

Japan is another Asian country marked with potential for market growth. The market is expected to register a strong CAGR of 6.7% over the forecast period.

Japan is one of the premium destinations for automobiles. Both domestic consumption and export of vehicles take place in Japan through companies like Nissan and Toyota. Thus, tackifiers are increasing in demand in Japan.

Online Sales Channels Giving New Dimension to Market in the United Kingdom

The United Kingdom is one of the fastest-rising countries in the European market. The CAGR for the United Kingdom market is anticipated to be 6.6% over the forecast period.

Suppliers of tackifiers are taking the online route for market expansion in the United Kingdom. Besides traditional industrial end-users, suppliers are also targeting consumers by expounding on the sticky benefits of the product. Thus, there is an increased scope for the market in the United Kingdom.

Growing Imports of Tackifiers in the United States

While local companies are largely engaged in producing tackifiers in the United States, there is notable import of products in the country. Tackifiers are imported from countries like Japan and China in the United States. The market is expected to register a commendable CAGR of 5.8% over the forecast period.

Competitive Landscape in the Tackifier Market

Several companies have established a stronghold in the tackifier market. However, there is still scope for new entrants as well as players on a smaller scale to thrive in the market.

As the industries that employ tackifiers through various forms seek out new locations, there is also a drive to expand the market geographically. Key players are also looking to reduce costs in manufacturing to further increase growth prospects in the tackifier market.

Recent Developments in the Tackifier Market

  • In May 2021, SI Group announced an ambitious plan for its plant in Lote, India. The company increased the capacity of its tackifier plant by 75%.
  • In April 2020, the Regalite R1125 hydrocarbon resin was launched. It is a resin that is useful as a tackifier for hot-melt adhesives.
  • In April 2020, Kraton Corporation launched the SYLVALITE line of products. The line includes tackifiers that are biobased and made by using the REvolution rosin ester technology.

Key Companies in the Tackifier Market

  • Henkel AG & Co. KGa
  • ZEON CORPORATION
  • Eastman Chemical Company
  • Arkema
  • Kolon Industries, Inc.
  • H.B. Fuller Company
  • BASF SE
  • Exxon Mobil Corporation
  • SI Group, Inc.
  • KRATON CORPORATION
  • Cray Valley
  • Arakawa Chemical Industries, Ltd.
  • YASUHARA CHEMICAL CO., LTD.
  • Lawter
  • Harima Chemicals Group, Inc
  • Lesco Chemical Limited
  • TECKREZ, INC.
  • Henan Anglxxon Chemical Co., Ltd.
  • Robert Kraemer GmbH & Co. KG

Key Segments in the Tackifier Market

By Product:

  • Hydrocarbon Resins
  • Rosin Resins
  • Terpene Resins

By Feedstock:

  • Synthetic Tackifiers
  • Natural/Biobased Tackifiers

By Region:

  • North America
  • Latin America
  • Europe
  • South Asia
  • East Asia
  • Oceania
  • Middle East and Africa (MEA)

Frequently Asked Questions

What is the Tackifier Market Size?

The tackifier market size is estimated to be US$ 4.3 billion in 2024.

How Big Will the Tackifier Market Be by 2034?

The tackifier market is projected to reach US$ 7.3 billion by 2034.

How will the Tackifier Market Progress in the United States?

The CAGR for the market in the United States is estimated to be 5.8% from 2024 to 2034.

What are Examples of Tackifiers?

Hydrocarbon resins, rosin resins, and terpene resins are examples of tackifiers.

What is the Scope of the Tackifier Market?

The tackifier market is expected to grow at a CAGR of 5.5% over the forecast period.

Table of Content

1. Executive Summary

    1.1. Global Market Outlook

    1.2. Demand-side Trends

    1.3. Supply-side Trends

    1.4. Technology Roadmap Analysis

    1.5. Analysis and Recommendations

2. Market Overview

    2.1. Market Coverage / Taxonomy

    2.2. Market Definition / Scope / Limitations

3. Market Background

    3.1. Market Dynamics

        3.1.1. Drivers

        3.1.2. Restraints

        3.1.3. Opportunity

        3.1.4. Trends

    3.2. Scenario Forecast

        3.2.1. Demand in Optimistic Scenario

        3.2.2. Demand in Likely Scenario

        3.2.3. Demand in Conservative Scenario

    3.3. Opportunity Map Analysis

    3.4. Product Life Cycle Analysis

    3.5. Supply Chain Analysis

        3.5.1. Supply Side Participants and their Roles

            3.5.1.1. Producers

            3.5.1.2. Mid-Level Participants (Traders/ Agents/ Brokers)

            3.5.1.3. Wholesalers and Distributors

        3.5.2. Value Added and Value Created at Node in the Supply Chain

        3.5.3. List of Raw Material Suppliers

        3.5.4. List of Existing and Potential Buyer’s

    3.6. Investment Feasibility Matrix

    3.7. Value Chain Analysis

        3.7.1. Profit Margin Analysis

        3.7.2. Wholesalers and Distributors

        3.7.3. Retailers

    3.8. PESTLE and Porter’s Analysis

    3.9. Regulatory Landscape

        3.9.1. By Key Regions

        3.9.2. By Key Countries

    3.10. Regional Parent Market Outlook

    3.11. Production and Consumption Statistics

    3.12. Import and Export Statistics

4. Global Market Analysis 2019 to 2023 and Forecast, 2024 to 2034

    4.1. Historical Market Size Value (US$ Million) & Volume (Tons) Analysis, 2019 to 2023

    4.2. Current and Future Market Size Value (US$ Million) & Volume (Tons) Projections, 2024 to 2034

        4.2.1. Y-o-Y Growth Trend Analysis

        4.2.2. Absolute $ Opportunity Analysis

5. Global Market Analysis 2019 to 2023 and Forecast 2024 to 2034, By Product

    5.1. Introduction / Key Findings

    5.2. Historical Market Size Value (US$ Million) & Volume (Tons) Analysis By Product, 2019 to 2023

    5.3. Current and Future Market Size Value (US$ Million) & Volume (Tons) Analysis and Forecast By Product, 2024 to 2034

        5.3.1. Hydrocarbon Resins

        5.3.2. Rosin Resins

        5.3.3. Terpene Resins

    5.4. Y-o-Y Growth Trend Analysis By Product, 2019 to 2023

    5.5. Absolute $ Opportunity Analysis By Product, 2024 to 2034

6. Global Market Analysis 2019 to 2023 and Forecast 2024 to 2034, By Feedstock

    6.1. Introduction / Key Findings

    6.2. Historical Market Size Value (US$ Million) & Volume (Tons) Analysis By Feedstock, 2019 to 2023

    6.3. Current and Future Market Size Value (US$ Million) & Volume (Tons) Analysis and Forecast By Feedstock, 2024 to 2034

        6.3.1. Synthetic Tackifiers

        6.3.2. Natural/Biobased Tackifiers

    6.4. Y-o-Y Growth Trend Analysis By Feedstock, 2019 to 2023

    6.5. Absolute $ Opportunity Analysis By Feedstock, 2024 to 2034

7. Global Market Analysis 2019 to 2023 and Forecast 2024 to 2034, By Form

    7.1. Introduction / Key Findings

    7.2. Historical Market Size Value (US$ Million) & Volume (Tons) Analysis By Form, 2019 to 2023

    7.3. Current and Future Market Size Value (US$ Million) & Volume (Tons) Analysis and Forecast By Form, 2024 to 2034

        7.3.1. Solid

        7.3.2. Liquid

        7.3.3. Resin Dispersion

    7.4. Y-o-Y Growth Trend Analysis By Form, 2019 to 2023

    7.5. Absolute $ Opportunity Analysis By Form, 2024 to 2034

8. Global Market Analysis 2019 to 2023 and Forecast 2024 to 2034, By Application

    8.1. Introduction / Key Findings

    8.2. Historical Market Size Value (US$ Million) & Volume (Tons) Analysis By Application, 2019 to 2023

    8.3. Current and Future Market Size Value (US$ Million) & Volume (Tons) Analysis and Forecast By Application, 2024 to 2034

        8.3.1. Pressure Sensitive Adhesives (PSA)

        8.3.2. Hot Melt Adhesives (HMA)

        8.3.3. Others

    8.4. Y-o-Y Growth Trend Analysis By Application, 2019 to 2023

    8.5. Absolute $ Opportunity Analysis By Application, 2024 to 2034

9. Global Market Analysis 2019 to 2023 and Forecast 2024 to 2034, By End-User

    9.1. Introduction / Key Findings

    9.2. Historical Market Size Value (US$ Million) & Volume (Tons) Analysis By End-User, 2019 to 2023

    9.3. Current and Future Market Size Value (US$ Million) & Volume (Tons) Analysis and Forecast By End-User, 2024 to 2034

        9.3.1. Packaging

        9.3.2. Construction/Assembly

        9.3.3. Nonwoven

        9.3.4. Bookbinding

        9.3.5. Others

    9.4. Y-o-Y Growth Trend Analysis By End-User, 2019 to 2023

    9.5. Absolute $ Opportunity Analysis By End-User, 2024 to 2034

10. Global Market Analysis 2019 to 2023 and Forecast 2024 to 2034, By Region

    10.1. Introduction

    10.2. Historical Market Size Value (US$ Million) & Volume (Tons) Analysis By Region, 2019 to 2023

    10.3. Current Market Size Value (US$ Million) & Volume (Tons) Analysis and Forecast By Region, 2024 to 2034

        10.3.1. North America

        10.3.2. Latin America

        10.3.3. Western Europe

        10.3.4. Eastern Europe

        10.3.5. South Asia and Pacific

        10.3.6. East Asia

        10.3.7. Middle East and Africa

    10.4. Market Attractiveness Analysis By Region

11. North America Market Analysis 2019 to 2023 and Forecast 2024 to 2034, By Country

    11.1. Historical Market Size Value (US$ Million) & Volume (Tons) Trend Analysis By Market Taxonomy, 2019 to 2023

    11.2. Market Size Value (US$ Million) & Volume (Tons) Forecast By Market Taxonomy, 2024 to 2034

        11.2.1. By Country

            11.2.1.1. USA

            11.2.1.2. Canada

        11.2.2. By Product

        11.2.3. By Feedstock

        11.2.4. By Form

        11.2.5. By Application

        11.2.6. By End-User

    11.3. Market Attractiveness Analysis

        11.3.1. By Country

        11.3.2. By Product

        11.3.3. By Feedstock

        11.3.4. By Form

        11.3.5. By Application

        11.3.6. By End-User

    11.4. Key Takeaways

12. Latin America Market Analysis 2019 to 2023 and Forecast 2024 to 2034, By Country

    12.1. Historical Market Size Value (US$ Million) & Volume (Tons) Trend Analysis By Market Taxonomy, 2019 to 2023

    12.2. Market Size Value (US$ Million) & Volume (Tons) Forecast By Market Taxonomy, 2024 to 2034

        12.2.1. By Country

            12.2.1.1. Brazil

            12.2.1.2. Mexico

            12.2.1.3. Rest of Latin America

        12.2.2. By Product

        12.2.3. By Feedstock

        12.2.4. By Form

        12.2.5. By Application

        12.2.6. By End-User

    12.3. Market Attractiveness Analysis

        12.3.1. By Country

        12.3.2. By Product

        12.3.3. By Feedstock

        12.3.4. By Form

        12.3.5. By Application

        12.3.6. By End-User

    12.4. Key Takeaways

13. Western Europe Market Analysis 2019 to 2023 and Forecast 2024 to 2034, By Country

    13.1. Historical Market Size Value (US$ Million) & Volume (Tons) Trend Analysis By Market Taxonomy, 2019 to 2023

    13.2. Market Size Value (US$ Million) & Volume (Tons) Forecast By Market Taxonomy, 2024 to 2034

        13.2.1. By Country

            13.2.1.1. Germany

            13.2.1.2. UK

            13.2.1.3. France

            13.2.1.4. Spain

            13.2.1.5. Italy

            13.2.1.6. Rest of Western Europe

        13.2.2. By Product

        13.2.3. By Feedstock

        13.2.4. By Form

        13.2.5. By Application

        13.2.6. By End-User

    13.3. Market Attractiveness Analysis

        13.3.1. By Country

        13.3.2. By Product

        13.3.3. By Feedstock

        13.3.4. By Form

        13.3.5. By Application

        13.3.6. By End-User

    13.4. Key Takeaways

14. Eastern Europe Market Analysis 2019 to 2023 and Forecast 2024 to 2034, By Country

    14.1. Historical Market Size Value (US$ Million) & Volume (Tons) Trend Analysis By Market Taxonomy, 2019 to 2023

    14.2. Market Size Value (US$ Million) & Volume (Tons) Forecast By Market Taxonomy, 2024 to 2034

        14.2.1. By Country

            14.2.1.1. Poland

            14.2.1.2. Russia

            14.2.1.3. Czech Republic

            14.2.1.4. Romania

            14.2.1.5. Rest of Eastern Europe

        14.2.2. By Product

        14.2.3. By Feedstock

        14.2.4. By Form

        14.2.5. By Application

        14.2.6. By End-User

    14.3. Market Attractiveness Analysis

        14.3.1. By Country

        14.3.2. By Product

        14.3.3. By Feedstock

        14.3.4. By Form

        14.3.5. By Application

        14.3.6. By End-User

    14.4. Key Takeaways

15. South Asia and Pacific Market Analysis 2019 to 2023 and Forecast 2024 to 2034, By Country

    15.1. Historical Market Size Value (US$ Million) & Volume (Tons) Trend Analysis By Market Taxonomy, 2019 to 2023

    15.2. Market Size Value (US$ Million) & Volume (Tons) Forecast By Market Taxonomy, 2024 to 2034

        15.2.1. By Country

            15.2.1.1. India

            15.2.1.2. Bangladesh

            15.2.1.3. Australia

            15.2.1.4. New Zealand

            15.2.1.5. Rest of South Asia and Pacific

        15.2.2. By Product

        15.2.3. By Feedstock

        15.2.4. By Form

        15.2.5. By Application

        15.2.6. By End-User

    15.3. Market Attractiveness Analysis

        15.3.1. By Country

        15.3.2. By Product

        15.3.3. By Feedstock

        15.3.4. By Form

        15.3.5. By Application

        15.3.6. By End-User

    15.4. Key Takeaways

16. East Asia Market Analysis 2019 to 2023 and Forecast 2024 to 2034, By Country

    16.1. Historical Market Size Value (US$ Million) & Volume (Tons) Trend Analysis By Market Taxonomy, 2019 to 2023

    16.2. Market Size Value (US$ Million) & Volume (Tons) Forecast By Market Taxonomy, 2024 to 2034

        16.2.1. By Country

            16.2.1.1. China

            16.2.1.2. Japan

            16.2.1.3. South Korea

        16.2.2. By Product

        16.2.3. By Feedstock

        16.2.4. By Form

        16.2.5. By Application

        16.2.6. By End-User

    16.3. Market Attractiveness Analysis

        16.3.1. By Country

        16.3.2. By Product

        16.3.3. By Feedstock

        16.3.4. By Form

        16.3.5. By Application

        16.3.6. By End-User

    16.4. Key Takeaways

17. Middle East and Africa Market Analysis 2019 to 2023 and Forecast 2024 to 2034, By Country

    17.1. Historical Market Size Value (US$ Million) & Volume (Tons) Trend Analysis By Market Taxonomy, 2019 to 2023

    17.2. Market Size Value (US$ Million) & Volume (Tons) Forecast By Market Taxonomy, 2024 to 2034

        17.2.1. By Country

            17.2.1.1. GCC Countries

            17.2.1.2. South Africa

            17.2.1.3. Israel

            17.2.1.4. Rest of MEA

        17.2.2. By Product

        17.2.3. By Feedstock

        17.2.4. By Form

        17.2.5. By Application

        17.2.6. By End-User

    17.3. Market Attractiveness Analysis

        17.3.1. By Country

        17.3.2. By Product

        17.3.3. By Feedstock

        17.3.4. By Form

        17.3.5. By Application

        17.3.6. By End-User

    17.4. Key Takeaways

18. Key Countries Market Analysis

    18.1. USA

        18.1.1. Pricing Analysis

        18.1.2. Market Share Analysis, 2023

            18.1.2.1. By Product

            18.1.2.2. By Feedstock

            18.1.2.3. By Form

            18.1.2.4. By Application

            18.1.2.5. By End-User

    18.2. Canada

        18.2.1. Pricing Analysis

        18.2.2. Market Share Analysis, 2023

            18.2.2.1. By Product

            18.2.2.2. By Feedstock

            18.2.2.3. By Form

            18.2.2.4. By Application

            18.2.2.5. By End-User

    18.3. Brazil

        18.3.1. Pricing Analysis

        18.3.2. Market Share Analysis, 2023

            18.3.2.1. By Product

            18.3.2.2. By Feedstock

            18.3.2.3. By Form

            18.3.2.4. By Application

            18.3.2.5. By End-User

    18.4. Mexico

        18.4.1. Pricing Analysis

        18.4.2. Market Share Analysis, 2023

            18.4.2.1. By Product

            18.4.2.2. By Feedstock

            18.4.2.3. By Form

            18.4.2.4. By Application

            18.4.2.5. By End-User

    18.5. Germany

        18.5.1. Pricing Analysis

        18.5.2. Market Share Analysis, 2023

            18.5.2.1. By Product

            18.5.2.2. By Feedstock

            18.5.2.3. By Form

            18.5.2.4. By Application

            18.5.2.5. By End-User

    18.6. UK

        18.6.1. Pricing Analysis

        18.6.2. Market Share Analysis, 2023

            18.6.2.1. By Product

            18.6.2.2. By Feedstock

            18.6.2.3. By Form

            18.6.2.4. By Application

            18.6.2.5. By End-User

    18.7. France

        18.7.1. Pricing Analysis

        18.7.2. Market Share Analysis, 2023

            18.7.2.1. By Product

            18.7.2.2. By Feedstock

            18.7.2.3. By Form

            18.7.2.4. By Application

            18.7.2.5. By End-User

    18.8. Spain

        18.8.1. Pricing Analysis

        18.8.2. Market Share Analysis, 2023

            18.8.2.1. By Product

            18.8.2.2. By Feedstock

            18.8.2.3. By Form

            18.8.2.4. By Application

            18.8.2.5. By End-User

    18.9. Italy

        18.9.1. Pricing Analysis

        18.9.2. Market Share Analysis, 2023

            18.9.2.1. By Product

            18.9.2.2. By Feedstock

            18.9.2.3. By Form

            18.9.2.4. By Application

            18.9.2.5. By End-User

    18.10. Poland

        18.10.1. Pricing Analysis

        18.10.2. Market Share Analysis, 2023

            18.10.2.1. By Product

            18.10.2.2. By Feedstock

            18.10.2.3. By Form

            18.10.2.4. By Application

            18.10.2.5. By End-User

    18.11. Russia

        18.11.1. Pricing Analysis

        18.11.2. Market Share Analysis, 2023

            18.11.2.1. By Product

            18.11.2.2. By Feedstock

            18.11.2.3. By Form

            18.11.2.4. By Application

            18.11.2.5. By End-User

    18.12. Czech Republic

        18.12.1. Pricing Analysis

        18.12.2. Market Share Analysis, 2023

            18.12.2.1. By Product

            18.12.2.2. By Feedstock

            18.12.2.3. By Form

            18.12.2.4. By Application

            18.12.2.5. By End-User

    18.13. Romania

        18.13.1. Pricing Analysis

        18.13.2. Market Share Analysis, 2023

            18.13.2.1. By Product

            18.13.2.2. By Feedstock

            18.13.2.3. By Form

            18.13.2.4. By Application

            18.13.2.5. By End-User

    18.14. India

        18.14.1. Pricing Analysis

        18.14.2. Market Share Analysis, 2023

            18.14.2.1. By Product

            18.14.2.2. By Feedstock

            18.14.2.3. By Form

            18.14.2.4. By Application

            18.14.2.5. By End-User

    18.15. Bangladesh

        18.15.1. Pricing Analysis

        18.15.2. Market Share Analysis, 2023

            18.15.2.1. By Product

            18.15.2.2. By Feedstock

            18.15.2.3. By Form

            18.15.2.4. By Application

            18.15.2.5. By End-User

    18.16. Australia

        18.16.1. Pricing Analysis

        18.16.2. Market Share Analysis, 2023

            18.16.2.1. By Product

            18.16.2.2. By Feedstock

            18.16.2.3. By Form

            18.16.2.4. By Application

            18.16.2.5. By End-User

    18.17. New Zealand

        18.17.1. Pricing Analysis

        18.17.2. Market Share Analysis, 2023

            18.17.2.1. By Product

            18.17.2.2. By Feedstock

            18.17.2.3. By Form

            18.17.2.4. By Application

            18.17.2.5. By End-User

    18.18. China

        18.18.1. Pricing Analysis

        18.18.2. Market Share Analysis, 2023

            18.18.2.1. By Product

            18.18.2.2. By Feedstock

            18.18.2.3. By Form

            18.18.2.4. By Application

            18.18.2.5. By End-User

    18.19. Japan

        18.19.1. Pricing Analysis

        18.19.2. Market Share Analysis, 2023

            18.19.2.1. By Product

            18.19.2.2. By Feedstock

            18.19.2.3. By Form

            18.19.2.4. By Application

            18.19.2.5. By End-User

    18.20. South Korea

        18.20.1. Pricing Analysis

        18.20.2. Market Share Analysis, 2023

            18.20.2.1. By Product

            18.20.2.2. By Feedstock

            18.20.2.3. By Form

            18.20.2.4. By Application

            18.20.2.5. By End-User

    18.21. GCC Countries

        18.21.1. Pricing Analysis

        18.21.2. Market Share Analysis, 2023

            18.21.2.1. By Product

            18.21.2.2. By Feedstock

            18.21.2.3. By Form

            18.21.2.4. By Application

            18.21.2.5. By End-User

    18.22. South Africa

        18.22.1. Pricing Analysis

        18.22.2. Market Share Analysis, 2023

            18.22.2.1. By Product

            18.22.2.2. By Feedstock

            18.22.2.3. By Form

            18.22.2.4. By Application

            18.22.2.5. By End-User

    18.23. Israel

        18.23.1. Pricing Analysis

        18.23.2. Market Share Analysis, 2023

            18.23.2.1. By Product

            18.23.2.2. By Feedstock

            18.23.2.3. By Form

            18.23.2.4. By Application

            18.23.2.5. By End-User

19. Market Structure Analysis

    19.1. Competition Dashboard

    19.2. Competition Benchmarking

    19.3. Market Share Analysis of Top Players

        19.3.1. By Regional

        19.3.2. By Product

        19.3.3. By Feedstock

        19.3.4. By Form

        19.3.5. By Application

        19.3.6. By End-User

20. Competition Analysis

    20.1. Competition Deep Dive

        20.1.1. Eastman Chemical Company

            20.1.1.1. Overview

            20.1.1.2. Product Portfolio

            20.1.1.3. Profitability by Market Segments

            20.1.1.4. Sales Footprint

            20.1.1.5. Strategy Overview

                20.1.1.5.1. Marketing Strategy

                20.1.1.5.2. Product Strategy

                20.1.1.5.3. Channel Strategy

        20.1.2. ZEON CORPORATION

            20.1.2.1. Overview

            20.1.2.2. Product Portfolio

            20.1.2.3. Profitability by Market Segments

            20.1.2.4. Sales Footprint

            20.1.2.5. Strategy Overview

                20.1.2.5.1. Marketing Strategy

                20.1.2.5.2. Product Strategy

                20.1.2.5.3. Channel Strategy

        20.1.3. Arkema

            20.1.3.1. Overview

            20.1.3.2. Product Portfolio

            20.1.3.3. Profitability by Market Segments

            20.1.3.4. Sales Footprint

            20.1.3.5. Strategy Overview

                20.1.3.5.1. Marketing Strategy

                20.1.3.5.2. Product Strategy

                20.1.3.5.3. Channel Strategy

        20.1.4. Kolon Industries

            20.1.4.1. Overview

            20.1.4.2. Product Portfolio

            20.1.4.3. Profitability by Market Segments

            20.1.4.4. Sales Footprint

            20.1.4.5. Strategy Overview

                20.1.4.5.1. Marketing Strategy

                20.1.4.5.2. Product Strategy

                20.1.4.5.3. Channel Strategy

        20.1.5. H.B. Fuller Company

            20.1.5.1. Overview

            20.1.5.2. Product Portfolio

            20.1.5.3. Profitability by Market Segments

            20.1.5.4. Sales Footprint

            20.1.5.5. Strategy Overview

                20.1.5.5.1. Marketing Strategy

                20.1.5.5.2. Product Strategy

                20.1.5.5.3. Channel Strategy

        20.1.6. BASF SE

            20.1.6.1. Overview

            20.1.6.2. Product Portfolio

            20.1.6.3. Profitability by Market Segments

            20.1.6.4. Sales Footprint

            20.1.6.5. Strategy Overview

                20.1.6.5.1. Marketing Strategy

                20.1.6.5.2. Product Strategy

                20.1.6.5.3. Channel Strategy

        20.1.7. Exxon Mobil Corporation

            20.1.7.1. Overview

            20.1.7.2. Product Portfolio

            20.1.7.3. Profitability by Market Segments

            20.1.7.4. Sales Footprint

            20.1.7.5. Strategy Overview

                20.1.7.5.1. Marketing Strategy

                20.1.7.5.2. Product Strategy

                20.1.7.5.3. Channel Strategy

        20.1.8. SI Group

            20.1.8.1. Overview

            20.1.8.2. Product Portfolio

            20.1.8.3. Profitability by Market Segments

            20.1.8.4. Sales Footprint

            20.1.8.5. Strategy Overview

                20.1.8.5.1. Marketing Strategy

                20.1.8.5.2. Product Strategy

                20.1.8.5.3. Channel Strategy

        20.1.9. KRATON CORPORATION

            20.1.9.1. Overview

            20.1.9.2. Product Portfolio

            20.1.9.3. Profitability by Market Segments

            20.1.9.4. Sales Footprint

            20.1.9.5. Strategy Overview

                20.1.9.5.1. Marketing Strategy

                20.1.9.5.2. Product Strategy

                20.1.9.5.3. Channel Strategy

        20.1.10. Cray Valley

            20.1.10.1. Overview

            20.1.10.2. Product Portfolio

            20.1.10.3. Profitability by Market Segments

            20.1.10.4. Sales Footprint

            20.1.10.5. Strategy Overview

                20.1.10.5.1. Marketing Strategy

                20.1.10.5.2. Product Strategy

                20.1.10.5.3. Channel Strategy

21. Assumptions & Acronyms Used

22. Research Methodology

List of Tables

Table 1: Global Market Value (US$ Million) Forecast by Region, 2019 to 2034

Table 2: Global Market Volume (Tons) Forecast by Region, 2019 to 2034

Table 3: Global Market Value (US$ Million) Forecast by Product, 2019 to 2034

Table 4: Global Market Volume (Tons) Forecast by Product, 2019 to 2034

Table 5: Global Market Value (US$ Million) Forecast by Feedstock, 2019 to 2034

Table 6: Global Market Volume (Tons) Forecast by Feedstock, 2019 to 2034

Table 7: Global Market Value (US$ Million) Forecast by Form, 2019 to 2034

Table 8: Global Market Volume (Tons) Forecast by Form, 2019 to 2034

Table 9: Global Market Value (US$ Million) Forecast by Application, 2019 to 2034

Table 10: Global Market Volume (Tons) Forecast by Application, 2019 to 2034

Table 11: Global Market Value (US$ Million) Forecast by End-User, 2019 to 2034

Table 12: Global Market Volume (Tons) Forecast by End-User, 2019 to 2034

Table 13: North America Market Value (US$ Million) Forecast by Country, 2019 to 2034

Table 14: North America Market Volume (Tons) Forecast by Country, 2019 to 2034

Table 15: North America Market Value (US$ Million) Forecast by Product, 2019 to 2034

Table 16: North America Market Volume (Tons) Forecast by Product, 2019 to 2034

Table 17: North America Market Value (US$ Million) Forecast by Feedstock, 2019 to 2034

Table 18: North America Market Volume (Tons) Forecast by Feedstock, 2019 to 2034

Table 19: North America Market Value (US$ Million) Forecast by Form, 2019 to 2034

Table 20: North America Market Volume (Tons) Forecast by Form, 2019 to 2034

Table 21: North America Market Value (US$ Million) Forecast by Application, 2019 to 2034

Table 22: North America Market Volume (Tons) Forecast by Application, 2019 to 2034

Table 23: North America Market Value (US$ Million) Forecast by End-User, 2019 to 2034

Table 24: North America Market Volume (Tons) Forecast by End-User, 2019 to 2034

Table 25: Latin America Market Value (US$ Million) Forecast by Country, 2019 to 2034

Table 26: Latin America Market Volume (Tons) Forecast by Country, 2019 to 2034

Table 27: Latin America Market Value (US$ Million) Forecast by Product, 2019 to 2034

Table 28: Latin America Market Volume (Tons) Forecast by Product, 2019 to 2034

Table 29: Latin America Market Value (US$ Million) Forecast by Feedstock, 2019 to 2034

Table 30: Latin America Market Volume (Tons) Forecast by Feedstock, 2019 to 2034

Table 31: Latin America Market Value (US$ Million) Forecast by Form, 2019 to 2034

Table 32: Latin America Market Volume (Tons) Forecast by Form, 2019 to 2034

Table 33: Latin America Market Value (US$ Million) Forecast by Application, 2019 to 2034

Table 34: Latin America Market Volume (Tons) Forecast by Application, 2019 to 2034

Table 35: Latin America Market Value (US$ Million) Forecast by End-User, 2019 to 2034

Table 36: Latin America Market Volume (Tons) Forecast by End-User, 2019 to 2034

Table 37: Western Europe Market Value (US$ Million) Forecast by Country, 2019 to 2034

Table 38: Western Europe Market Volume (Tons) Forecast by Country, 2019 to 2034

Table 39: Western Europe Market Value (US$ Million) Forecast by Product, 2019 to 2034

Table 40: Western Europe Market Volume (Tons) Forecast by Product, 2019 to 2034

Table 41: Western Europe Market Value (US$ Million) Forecast by Feedstock, 2019 to 2034

Table 42: Western Europe Market Volume (Tons) Forecast by Feedstock, 2019 to 2034

Table 43: Western Europe Market Value (US$ Million) Forecast by Form, 2019 to 2034

Table 44: Western Europe Market Volume (Tons) Forecast by Form, 2019 to 2034

Table 45: Western Europe Market Value (US$ Million) Forecast by Application, 2019 to 2034

Table 46: Western Europe Market Volume (Tons) Forecast by Application, 2019 to 2034

Table 47: Western Europe Market Value (US$ Million) Forecast by End-User, 2019 to 2034

Table 48: Western Europe Market Volume (Tons) Forecast by End-User, 2019 to 2034

Table 49: Eastern Europe Market Value (US$ Million) Forecast by Country, 2019 to 2034

Table 50: Eastern Europe Market Volume (Tons) Forecast by Country, 2019 to 2034

Table 51: Eastern Europe Market Value (US$ Million) Forecast by Product, 2019 to 2034

Table 52: Eastern Europe Market Volume (Tons) Forecast by Product, 2019 to 2034

Table 53: Eastern Europe Market Value (US$ Million) Forecast by Feedstock, 2019 to 2034

Table 54: Eastern Europe Market Volume (Tons) Forecast by Feedstock, 2019 to 2034

Table 55: Eastern Europe Market Value (US$ Million) Forecast by Form, 2019 to 2034

Table 56: Eastern Europe Market Volume (Tons) Forecast by Form, 2019 to 2034

Table 57: Eastern Europe Market Value (US$ Million) Forecast by Application, 2019 to 2034

Table 58: Eastern Europe Market Volume (Tons) Forecast by Application, 2019 to 2034

Table 59: Eastern Europe Market Value (US$ Million) Forecast by End-User, 2019 to 2034

Table 60: Eastern Europe Market Volume (Tons) Forecast by End-User, 2019 to 2034

Table 61: South Asia and Pacific Market Value (US$ Million) Forecast by Country, 2019 to 2034

Table 62: South Asia and Pacific Market Volume (Tons) Forecast by Country, 2019 to 2034

Table 63: South Asia and Pacific Market Value (US$ Million) Forecast by Product, 2019 to 2034

Table 64: South Asia and Pacific Market Volume (Tons) Forecast by Product, 2019 to 2034

Table 65: South Asia and Pacific Market Value (US$ Million) Forecast by Feedstock, 2019 to 2034

Table 66: South Asia and Pacific Market Volume (Tons) Forecast by Feedstock, 2019 to 2034

Table 67: South Asia and Pacific Market Value (US$ Million) Forecast by Form, 2019 to 2034

Table 68: South Asia and Pacific Market Volume (Tons) Forecast by Form, 2019 to 2034

Table 69: South Asia and Pacific Market Value (US$ Million) Forecast by Application, 2019 to 2034

Table 70: South Asia and Pacific Market Volume (Tons) Forecast by Application, 2019 to 2034

Table 71: South Asia and Pacific Market Value (US$ Million) Forecast by End-User, 2019 to 2034

Table 72: South Asia and Pacific Market Volume (Tons) Forecast by End-User, 2019 to 2034

Table 73: East Asia Market Value (US$ Million) Forecast by Country, 2019 to 2034

Table 74: East Asia Market Volume (Tons) Forecast by Country, 2019 to 2034

Table 75: East Asia Market Value (US$ Million) Forecast by Product, 2019 to 2034

Table 76: East Asia Market Volume (Tons) Forecast by Product, 2019 to 2034

Table 77: East Asia Market Value (US$ Million) Forecast by Feedstock, 2019 to 2034

Table 78: East Asia Market Volume (Tons) Forecast by Feedstock, 2019 to 2034

Table 79: East Asia Market Value (US$ Million) Forecast by Form, 2019 to 2034

Table 80: East Asia Market Volume (Tons) Forecast by Form, 2019 to 2034

Table 81: East Asia Market Value (US$ Million) Forecast by Application, 2019 to 2034

Table 82: East Asia Market Volume (Tons) Forecast by Application, 2019 to 2034

Table 83: East Asia Market Value (US$ Million) Forecast by End-User, 2019 to 2034

Table 84: East Asia Market Volume (Tons) Forecast by End-User, 2019 to 2034

Table 85: Middle East and Africa Market Value (US$ Million) Forecast by Country, 2019 to 2034

Table 86: Middle East and Africa Market Volume (Tons) Forecast by Country, 2019 to 2034

Table 87: Middle East and Africa Market Value (US$ Million) Forecast by Product, 2019 to 2034

Table 88: Middle East and Africa Market Volume (Tons) Forecast by Product, 2019 to 2034

Table 89: Middle East and Africa Market Value (US$ Million) Forecast by Feedstock, 2019 to 2034

Table 90: Middle East and Africa Market Volume (Tons) Forecast by Feedstock, 2019 to 2034

Table 91: Middle East and Africa Market Value (US$ Million) Forecast by Form, 2019 to 2034

Table 92: Middle East and Africa Market Volume (Tons) Forecast by Form, 2019 to 2034

Table 93: Middle East and Africa Market Value (US$ Million) Forecast by Application, 2019 to 2034

Table 94: Middle East and Africa Market Volume (Tons) Forecast by Application, 2019 to 2034

Table 95: Middle East and Africa Market Value (US$ Million) Forecast by End-User, 2019 to 2034

Table 96: Middle East and Africa Market Volume (Tons) Forecast by End-User, 2019 to 2034

List of Charts

Figure 1: Global Market Value (US$ Million) by Product, 2024 to 2034

Figure 2: Global Market Value (US$ Million) by Feedstock, 2024 to 2034

Figure 3: Global Market Value (US$ Million) by Form, 2024 to 2034

Figure 4: Global Market Value (US$ Million) by Application, 2024 to 2034

Figure 5: Global Market Value (US$ Million) by End-User, 2024 to 2034

Figure 6: Global Market Value (US$ Million) by Region, 2024 to 2034

Figure 7: Global Market Value (US$ Million) Analysis by Region, 2019 to 2034

Figure 8: Global Market Volume (Tons) Analysis by Region, 2019 to 2034

Figure 9: Global Market Value Share (%) and BPS Analysis by Region, 2024 to 2034

Figure 10: Global Market Y-o-Y Growth (%) Projections by Region, 2024 to 2034

Figure 11: Global Market Value (US$ Million) Analysis by Product, 2019 to 2034

Figure 12: Global Market Volume (Tons) Analysis by Product, 2019 to 2034

Figure 13: Global Market Value Share (%) and BPS Analysis by Product, 2024 to 2034

Figure 14: Global Market Y-o-Y Growth (%) Projections by Product, 2024 to 2034

Figure 15: Global Market Value (US$ Million) Analysis by Feedstock, 2019 to 2034

Figure 16: Global Market Volume (Tons) Analysis by Feedstock, 2019 to 2034

Figure 17: Global Market Value Share (%) and BPS Analysis by Feedstock, 2024 to 2034

Figure 18: Global Market Y-o-Y Growth (%) Projections by Feedstock, 2024 to 2034

Figure 19: Global Market Value (US$ Million) Analysis by Form, 2019 to 2034

Figure 20: Global Market Volume (Tons) Analysis by Form, 2019 to 2034

Figure 21: Global Market Value Share (%) and BPS Analysis by Form, 2024 to 2034

Figure 22: Global Market Y-o-Y Growth (%) Projections by Form, 2024 to 2034

Figure 23: Global Market Value (US$ Million) Analysis by Application, 2019 to 2034

Figure 24: Global Market Volume (Tons) Analysis by Application, 2019 to 2034

Figure 25: Global Market Value Share (%) and BPS Analysis by Application, 2024 to 2034

Figure 26: Global Market Y-o-Y Growth (%) Projections by Application, 2024 to 2034

Figure 27: Global Market Value (US$ Million) Analysis by End-User, 2019 to 2034

Figure 28: Global Market Volume (Tons) Analysis by End-User, 2019 to 2034

Figure 29: Global Market Value Share (%) and BPS Analysis by End-User, 2024 to 2034

Figure 30: Global Market Y-o-Y Growth (%) Projections by End-User, 2024 to 2034

Figure 31: Global Market Attractiveness by Product, 2024 to 2034

Figure 32: Global Market Attractiveness by Feedstock, 2024 to 2034

Figure 33: Global Market Attractiveness by Form, 2024 to 2034

Figure 34: Global Market Attractiveness by Application, 2024 to 2034

Figure 35: Global Market Attractiveness by End-User, 2024 to 2034

Figure 36: Global Market Attractiveness by Region, 2024 to 2034

Figure 37: North America Market Value (US$ Million) by Product, 2024 to 2034

Figure 38: North America Market Value (US$ Million) by Feedstock, 2024 to 2034

Figure 39: North America Market Value (US$ Million) by Form, 2024 to 2034

Figure 40: North America Market Value (US$ Million) by Application, 2024 to 2034

Figure 41: North America Market Value (US$ Million) by End-User, 2024 to 2034

Figure 42: North America Market Value (US$ Million) by Country, 2024 to 2034

Figure 43: North America Market Value (US$ Million) Analysis by Country, 2019 to 2034

Figure 44: North America Market Volume (Tons) Analysis by Country, 2019 to 2034

Figure 45: North America Market Value Share (%) and BPS Analysis by Country, 2024 to 2034

Figure 46: North America Market Y-o-Y Growth (%) Projections by Country, 2024 to 2034

Figure 47: North America Market Value (US$ Million) Analysis by Product, 2019 to 2034

Figure 48: North America Market Volume (Tons) Analysis by Product, 2019 to 2034

Figure 49: North America Market Value Share (%) and BPS Analysis by Product, 2024 to 2034

Figure 50: North America Market Y-o-Y Growth (%) Projections by Product, 2024 to 2034

Figure 51: North America Market Value (US$ Million) Analysis by Feedstock, 2019 to 2034

Figure 52: North America Market Volume (Tons) Analysis by Feedstock, 2019 to 2034

Figure 53: North America Market Value Share (%) and BPS Analysis by Feedstock, 2024 to 2034

Figure 54: North America Market Y-o-Y Growth (%) Projections by Feedstock, 2024 to 2034

Figure 55: North America Market Value (US$ Million) Analysis by Form, 2019 to 2034

Figure 56: North America Market Volume (Tons) Analysis by Form, 2019 to 2034

Figure 57: North America Market Value Share (%) and BPS Analysis by Form, 2024 to 2034

Figure 58: North America Market Y-o-Y Growth (%) Projections by Form, 2024 to 2034

Figure 59: North America Market Value (US$ Million) Analysis by Application, 2019 to 2034

Figure 60: North America Market Volume (Tons) Analysis by Application, 2019 to 2034

Figure 61: North America Market Value Share (%) and BPS Analysis by Application, 2024 to 2034

Figure 62: North America Market Y-o-Y Growth (%) Projections by Application, 2024 to 2034

Figure 63: North America Market Value (US$ Million) Analysis by End-User, 2019 to 2034

Figure 64: North America Market Volume (Tons) Analysis by End-User, 2019 to 2034

Figure 65: North America Market Value Share (%) and BPS Analysis by End-User, 2024 to 2034

Figure 66: North America Market Y-o-Y Growth (%) Projections by End-User, 2024 to 2034

Figure 67: North America Market Attractiveness by Product, 2024 to 2034

Figure 68: North America Market Attractiveness by Feedstock, 2024 to 2034

Figure 69: North America Market Attractiveness by Form, 2024 to 2034

Figure 70: North America Market Attractiveness by Application, 2024 to 2034

Figure 71: North America Market Attractiveness by End-User, 2024 to 2034

Figure 72: North America Market Attractiveness by Country, 2024 to 2034

Figure 73: Latin America Market Value (US$ Million) by Product, 2024 to 2034

Figure 74: Latin America Market Value (US$ Million) by Feedstock, 2024 to 2034

Figure 75: Latin America Market Value (US$ Million) by Form, 2024 to 2034

Figure 76: Latin America Market Value (US$ Million) by Application, 2024 to 2034

Figure 77: Latin America Market Value (US$ Million) by End-User, 2024 to 2034

Figure 78: Latin America Market Value (US$ Million) by Country, 2024 to 2034

Figure 79: Latin America Market Value (US$ Million) Analysis by Country, 2019 to 2034

Figure 80: Latin America Market Volume (Tons) Analysis by Country, 2019 to 2034

Figure 81: Latin America Market Value Share (%) and BPS Analysis by Country, 2024 to 2034

Figure 82: Latin America Market Y-o-Y Growth (%) Projections by Country, 2024 to 2034

Figure 83: Latin America Market Value (US$ Million) Analysis by Product, 2019 to 2034

Figure 84: Latin America Market Volume (Tons) Analysis by Product, 2019 to 2034

Figure 85: Latin America Market Value Share (%) and BPS Analysis by Product, 2024 to 2034

Figure 86: Latin America Market Y-o-Y Growth (%) Projections by Product, 2024 to 2034

Figure 87: Latin America Market Value (US$ Million) Analysis by Feedstock, 2019 to 2034

Figure 88: Latin America Market Volume (Tons) Analysis by Feedstock, 2019 to 2034

Figure 89: Latin America Market Value Share (%) and BPS Analysis by Feedstock, 2024 to 2034

Figure 90: Latin America Market Y-o-Y Growth (%) Projections by Feedstock, 2024 to 2034

Figure 91: Latin America Market Value (US$ Million) Analysis by Form, 2019 to 2034

Figure 92: Latin America Market Volume (Tons) Analysis by Form, 2019 to 2034

Figure 93: Latin America Market Value Share (%) and BPS Analysis by Form, 2024 to 2034

Figure 94: Latin America Market Y-o-Y Growth (%) Projections by Form, 2024 to 2034

Figure 95: Latin America Market Value (US$ Million) Analysis by Application, 2019 to 2034

Figure 96: Latin America Market Volume (Tons) Analysis by Application, 2019 to 2034

Figure 97: Latin America Market Value Share (%) and BPS Analysis by Application, 2024 to 2034

Figure 98: Latin America Market Y-o-Y Growth (%) Projections by Application, 2024 to 2034

Figure 99: Latin America Market Value (US$ Million) Analysis by End-User, 2019 to 2034

Figure 100: Latin America Market Volume (Tons) Analysis by End-User, 2019 to 2034

Figure 101: Latin America Market Value Share (%) and BPS Analysis by End-User, 2024 to 2034

Figure 102: Latin America Market Y-o-Y Growth (%) Projections by End-User, 2024 to 2034

Figure 103: Latin America Market Attractiveness by Product, 2024 to 2034

Figure 104: Latin America Market Attractiveness by Feedstock, 2024 to 2034

Figure 105: Latin America Market Attractiveness by Form, 2024 to 2034

Figure 106: Latin America Market Attractiveness by Application, 2024 to 2034

Figure 107: Latin America Market Attractiveness by End-User, 2024 to 2034

Figure 108: Latin America Market Attractiveness by Country, 2024 to 2034

Figure 109: Western Europe Market Value (US$ Million) by Product, 2024 to 2034

Figure 110: Western Europe Market Value (US$ Million) by Feedstock, 2024 to 2034

Figure 111: Western Europe Market Value (US$ Million) by Form, 2024 to 2034

Figure 112: Western Europe Market Value (US$ Million) by Application, 2024 to 2034

Figure 113: Western Europe Market Value (US$ Million) by End-User, 2024 to 2034

Figure 114: Western Europe Market Value (US$ Million) by Country, 2024 to 2034

Figure 115: Western Europe Market Value (US$ Million) Analysis by Country, 2019 to 2034

Figure 116: Western Europe Market Volume (Tons) Analysis by Country, 2019 to 2034

Figure 117: Western Europe Market Value Share (%) and BPS Analysis by Country, 2024 to 2034

Figure 118: Western Europe Market Y-o-Y Growth (%) Projections by Country, 2024 to 2034

Figure 119: Western Europe Market Value (US$ Million) Analysis by Product, 2019 to 2034

Figure 120: Western Europe Market Volume (Tons) Analysis by Product, 2019 to 2034

Figure 121: Western Europe Market Value Share (%) and BPS Analysis by Product, 2024 to 2034

Figure 122: Western Europe Market Y-o-Y Growth (%) Projections by Product, 2024 to 2034

Figure 123: Western Europe Market Value (US$ Million) Analysis by Feedstock, 2019 to 2034

Figure 124: Western Europe Market Volume (Tons) Analysis by Feedstock, 2019 to 2034

Figure 125: Western Europe Market Value Share (%) and BPS Analysis by Feedstock, 2024 to 2034

Figure 126: Western Europe Market Y-o-Y Growth (%) Projections by Feedstock, 2024 to 2034

Figure 127: Western Europe Market Value (US$ Million) Analysis by Form, 2019 to 2034

Figure 128: Western Europe Market Volume (Tons) Analysis by Form, 2019 to 2034

Figure 129: Western Europe Market Value Share (%) and BPS Analysis by Form, 2024 to 2034

Figure 130: Western Europe Market Y-o-Y Growth (%) Projections by Form, 2024 to 2034

Figure 131: Western Europe Market Value (US$ Million) Analysis by Application, 2019 to 2034

Figure 132: Western Europe Market Volume (Tons) Analysis by Application, 2019 to 2034

Figure 133: Western Europe Market Value Share (%) and BPS Analysis by Application, 2024 to 2034

Figure 134: Western Europe Market Y-o-Y Growth (%) Projections by Application, 2024 to 2034

Figure 135: Western Europe Market Value (US$ Million) Analysis by End-User, 2019 to 2034

Figure 136: Western Europe Market Volume (Tons) Analysis by End-User, 2019 to 2034

Figure 137: Western Europe Market Value Share (%) and BPS Analysis by End-User, 2024 to 2034

Figure 138: Western Europe Market Y-o-Y Growth (%) Projections by End-User, 2024 to 2034

Figure 139: Western Europe Market Attractiveness by Product, 2024 to 2034

Figure 140: Western Europe Market Attractiveness by Feedstock, 2024 to 2034

Figure 141: Western Europe Market Attractiveness by Form, 2024 to 2034

Figure 142: Western Europe Market Attractiveness by Application, 2024 to 2034

Figure 143: Western Europe Market Attractiveness by End-User, 2024 to 2034

Figure 144: Western Europe Market Attractiveness by Country, 2024 to 2034

Figure 145: Eastern Europe Market Value (US$ Million) by Product, 2024 to 2034

Figure 146: Eastern Europe Market Value (US$ Million) by Feedstock, 2024 to 2034

Figure 147: Eastern Europe Market Value (US$ Million) by Form, 2024 to 2034

Figure 148: Eastern Europe Market Value (US$ Million) by Application, 2024 to 2034

Figure 149: Eastern Europe Market Value (US$ Million) by End-User, 2024 to 2034

Figure 150: Eastern Europe Market Value (US$ Million) by Country, 2024 to 2034

Figure 151: Eastern Europe Market Value (US$ Million) Analysis by Country, 2019 to 2034

Figure 152: Eastern Europe Market Volume (Tons) Analysis by Country, 2019 to 2034

Figure 153: Eastern Europe Market Value Share (%) and BPS Analysis by Country, 2024 to 2034

Figure 154: Eastern Europe Market Y-o-Y Growth (%) Projections by Country, 2024 to 2034

Figure 155: Eastern Europe Market Value (US$ Million) Analysis by Product, 2019 to 2034

Figure 156: Eastern Europe Market Volume (Tons) Analysis by Product, 2019 to 2034

Figure 157: Eastern Europe Market Value Share (%) and BPS Analysis by Product, 2024 to 2034

Figure 158: Eastern Europe Market Y-o-Y Growth (%) Projections by Product, 2024 to 2034

Figure 159: Eastern Europe Market Value (US$ Million) Analysis by Feedstock, 2019 to 2034

Figure 160: Eastern Europe Market Volume (Tons) Analysis by Feedstock, 2019 to 2034

Figure 161: Eastern Europe Market Value Share (%) and BPS Analysis by Feedstock, 2024 to 2034

Figure 162: Eastern Europe Market Y-o-Y Growth (%) Projections by Feedstock, 2024 to 2034

Figure 163: Eastern Europe Market Value (US$ Million) Analysis by Form, 2019 to 2034

Figure 164: Eastern Europe Market Volume (Tons) Analysis by Form, 2019 to 2034

Figure 165: Eastern Europe Market Value Share (%) and BPS Analysis by Form, 2024 to 2034

Figure 166: Eastern Europe Market Y-o-Y Growth (%) Projections by Form, 2024 to 2034

Figure 167: Eastern Europe Market Value (US$ Million) Analysis by Application, 2019 to 2034

Figure 168: Eastern Europe Market Volume (Tons) Analysis by Application, 2019 to 2034

Figure 169: Eastern Europe Market Value Share (%) and BPS Analysis by Application, 2024 to 2034

Figure 170: Eastern Europe Market Y-o-Y Growth (%) Projections by Application, 2024 to 2034

Figure 171: Eastern Europe Market Value (US$ Million) Analysis by End-User, 2019 to 2034

Figure 172: Eastern Europe Market Volume (Tons) Analysis by End-User, 2019 to 2034

Figure 173: Eastern Europe Market Value Share (%) and BPS Analysis by End-User, 2024 to 2034

Figure 174: Eastern Europe Market Y-o-Y Growth (%) Projections by End-User, 2024 to 2034

Figure 175: Eastern Europe Market Attractiveness by Product, 2024 to 2034

Figure 176: Eastern Europe Market Attractiveness by Feedstock, 2024 to 2034

Figure 177: Eastern Europe Market Attractiveness by Form, 2024 to 2034

Figure 178: Eastern Europe Market Attractiveness by Application, 2024 to 2034

Figure 179: Eastern Europe Market Attractiveness by End-User, 2024 to 2034

Figure 180: Eastern Europe Market Attractiveness by Country, 2024 to 2034

Figure 181: South Asia and Pacific Market Value (US$ Million) by Product, 2024 to 2034

Figure 182: South Asia and Pacific Market Value (US$ Million) by Feedstock, 2024 to 2034

Figure 183: South Asia and Pacific Market Value (US$ Million) by Form, 2024 to 2034

Figure 184: South Asia and Pacific Market Value (US$ Million) by Application, 2024 to 2034

Figure 185: South Asia and Pacific Market Value (US$ Million) by End-User, 2024 to 2034

Figure 186: South Asia and Pacific Market Value (US$ Million) by Country, 2024 to 2034

Figure 187: South Asia and Pacific Market Value (US$ Million) Analysis by Country, 2019 to 2034

Figure 188: South Asia and Pacific Market Volume (Tons) Analysis by Country, 2019 to 2034

Figure 189: South Asia and Pacific Market Value Share (%) and BPS Analysis by Country, 2024 to 2034

Figure 190: South Asia and Pacific Market Y-o-Y Growth (%) Projections by Country, 2024 to 2034

Figure 191: South Asia and Pacific Market Value (US$ Million) Analysis by Product, 2019 to 2034

Figure 192: South Asia and Pacific Market Volume (Tons) Analysis by Product, 2019 to 2034

Figure 193: South Asia and Pacific Market Value Share (%) and BPS Analysis by Product, 2024 to 2034

Figure 194: South Asia and Pacific Market Y-o-Y Growth (%) Projections by Product, 2024 to 2034

Figure 195: South Asia and Pacific Market Value (US$ Million) Analysis by Feedstock, 2019 to 2034

Figure 196: South Asia and Pacific Market Volume (Tons) Analysis by Feedstock, 2019 to 2034

Figure 197: South Asia and Pacific Market Value Share (%) and BPS Analysis by Feedstock, 2024 to 2034

Figure 198: South Asia and Pacific Market Y-o-Y Growth (%) Projections by Feedstock, 2024 to 2034

Figure 199: South Asia and Pacific Market Value (US$ Million) Analysis by Form, 2019 to 2034

Figure 200: South Asia and Pacific Market Volume (Tons) Analysis by Form, 2019 to 2034

Figure 201: South Asia and Pacific Market Value Share (%) and BPS Analysis by Form, 2024 to 2034

Figure 202: South Asia and Pacific Market Y-o-Y Growth (%) Projections by Form, 2024 to 2034

Figure 203: South Asia and Pacific Market Value (US$ Million) Analysis by Application, 2019 to 2034

Figure 204: South Asia and Pacific Market Volume (Tons) Analysis by Application, 2019 to 2034

Figure 205: South Asia and Pacific Market Value Share (%) and BPS Analysis by Application, 2024 to 2034

Figure 206: South Asia and Pacific Market Y-o-Y Growth (%) Projections by Application, 2024 to 2034

Figure 207: South Asia and Pacific Market Value (US$ Million) Analysis by End-User, 2019 to 2034

Figure 208: South Asia and Pacific Market Volume (Tons) Analysis by End-User, 2019 to 2034

Figure 209: South Asia and Pacific Market Value Share (%) and BPS Analysis by End-User, 2024 to 2034

Figure 210: South Asia and Pacific Market Y-o-Y Growth (%) Projections by End-User, 2024 to 2034

Figure 211: South Asia and Pacific Market Attractiveness by Product, 2024 to 2034

Figure 212: South Asia and Pacific Market Attractiveness by Feedstock, 2024 to 2034

Figure 213: South Asia and Pacific Market Attractiveness by Form, 2024 to 2034

Figure 214: South Asia and Pacific Market Attractiveness by Application, 2024 to 2034

Figure 215: South Asia and Pacific Market Attractiveness by End-User, 2024 to 2034

Figure 216: South Asia and Pacific Market Attractiveness by Country, 2024 to 2034

Figure 217: East Asia Market Value (US$ Million) by Product, 2024 to 2034

Figure 218: East Asia Market Value (US$ Million) by Feedstock, 2024 to 2034

Figure 219: East Asia Market Value (US$ Million) by Form, 2024 to 2034

Figure 220: East Asia Market Value (US$ Million) by Application, 2024 to 2034

Figure 221: East Asia Market Value (US$ Million) by End-User, 2024 to 2034

Figure 222: East Asia Market Value (US$ Million) by Country, 2024 to 2034

Figure 223: East Asia Market Value (US$ Million) Analysis by Country, 2019 to 2034

Figure 224: East Asia Market Volume (Tons) Analysis by Country, 2019 to 2034

Figure 225: East Asia Market Value Share (%) and BPS Analysis by Country, 2024 to 2034

Figure 226: East Asia Market Y-o-Y Growth (%) Projections by Country, 2024 to 2034

Figure 227: East Asia Market Value (US$ Million) Analysis by Product, 2019 to 2034

Figure 228: East Asia Market Volume (Tons) Analysis by Product, 2019 to 2034

Figure 229: East Asia Market Value Share (%) and BPS Analysis by Product, 2024 to 2034

Figure 230: East Asia Market Y-o-Y Growth (%) Projections by Product, 2024 to 2034

Figure 231: East Asia Market Value (US$ Million) Analysis by Feedstock, 2019 to 2034

Figure 232: East Asia Market Volume (Tons) Analysis by Feedstock, 2019 to 2034

Figure 233: East Asia Market Value Share (%) and BPS Analysis by Feedstock, 2024 to 2034

Figure 234: East Asia Market Y-o-Y Growth (%) Projections by Feedstock, 2024 to 2034

Figure 235: East Asia Market Value (US$ Million) Analysis by Form, 2019 to 2034

Figure 236: East Asia Market Volume (Tons) Analysis by Form, 2019 to 2034

Figure 237: East Asia Market Value Share (%) and BPS Analysis by Form, 2024 to 2034

Figure 238: East Asia Market Y-o-Y Growth (%) Projections by Form, 2024 to 2034

Figure 239: East Asia Market Value (US$ Million) Analysis by Application, 2019 to 2034

Figure 240: East Asia Market Volume (Tons) Analysis by Application, 2019 to 2034

Figure 241: East Asia Market Value Share (%) and BPS Analysis by Application, 2024 to 2034

Figure 242: East Asia Market Y-o-Y Growth (%) Projections by Application, 2024 to 2034

Figure 243: East Asia Market Value (US$ Million) Analysis by End-User, 2019 to 2034

Figure 244: East Asia Market Volume (Tons) Analysis by End-User, 2019 to 2034

Figure 245: East Asia Market Value Share (%) and BPS Analysis by End-User, 2024 to 2034

Figure 246: East Asia Market Y-o-Y Growth (%) Projections by End-User, 2024 to 2034

Figure 247: East Asia Market Attractiveness by Product, 2024 to 2034

Figure 248: East Asia Market Attractiveness by Feedstock, 2024 to 2034

Figure 249: East Asia Market Attractiveness by Form, 2024 to 2034

Figure 250: East Asia Market Attractiveness by Application, 2024 to 2034

Figure 251: East Asia Market Attractiveness by End-User, 2024 to 2034

Figure 252: East Asia Market Attractiveness by Country, 2024 to 2034

Figure 253: Middle East and Africa Market Value (US$ Million) by Product, 2024 to 2034

Figure 254: Middle East and Africa Market Value (US$ Million) by Feedstock, 2024 to 2034

Figure 255: Middle East and Africa Market Value (US$ Million) by Form, 2024 to 2034

Figure 256: Middle East and Africa Market Value (US$ Million) by Application, 2024 to 2034

Figure 257: Middle East and Africa Market Value (US$ Million) by End-User, 2024 to 2034

Figure 258: Middle East and Africa Market Value (US$ Million) by Country, 2024 to 2034

Figure 259: Middle East and Africa Market Value (US$ Million) Analysis by Country, 2019 to 2034

Figure 260: Middle East and Africa Market Volume (Tons) Analysis by Country, 2019 to 2034

Figure 261: Middle East and Africa Market Value Share (%) and BPS Analysis by Country, 2024 to 2034

Figure 262: Middle East and Africa Market Y-o-Y Growth (%) Projections by Country, 2024 to 2034

Figure 263: Middle East and Africa Market Value (US$ Million) Analysis by Product, 2019 to 2034

Figure 264: Middle East and Africa Market Volume (Tons) Analysis by Product, 2019 to 2034

Figure 265: Middle East and Africa Market Value Share (%) and BPS Analysis by Product, 2024 to 2034

Figure 266: Middle East and Africa Market Y-o-Y Growth (%) Projections by Product, 2024 to 2034

Figure 267: Middle East and Africa Market Value (US$ Million) Analysis by Feedstock, 2019 to 2034

Figure 268: Middle East and Africa Market Volume (Tons) Analysis by Feedstock, 2019 to 2034

Figure 269: Middle East and Africa Market Value Share (%) and BPS Analysis by Feedstock, 2024 to 2034

Figure 270: Middle East and Africa Market Y-o-Y Growth (%) Projections by Feedstock, 2024 to 2034

Figure 271: Middle East and Africa Market Value (US$ Million) Analysis by Form, 2019 to 2034

Figure 272: Middle East and Africa Market Volume (Tons) Analysis by Form, 2019 to 2034

Figure 273: Middle East and Africa Market Value Share (%) and BPS Analysis by Form, 2024 to 2034

Figure 274: Middle East and Africa Market Y-o-Y Growth (%) Projections by Form, 2024 to 2034

Figure 275: Middle East and Africa Market Value (US$ Million) Analysis by Application, 2019 to 2034

Figure 276: Middle East and Africa Market Volume (Tons) Analysis by Application, 2019 to 2034

Figure 277: Middle East and Africa Market Value Share (%) and BPS Analysis by Application, 2024 to 2034

Figure 278: Middle East and Africa Market Y-o-Y Growth (%) Projections by Application, 2024 to 2034

Figure 279: Middle East and Africa Market Value (US$ Million) Analysis by End-User, 2019 to 2034

Figure 280: Middle East and Africa Market Volume (Tons) Analysis by End-User, 2019 to 2034

Figure 281: Middle East and Africa Market Value Share (%) and BPS Analysis by End-User, 2024 to 2034

Figure 282: Middle East and Africa Market Y-o-Y Growth (%) Projections by End-User, 2024 to 2034

Figure 283: Middle East and Africa Market Attractiveness by Product, 2024 to 2034

Figure 284: Middle East and Africa Market Attractiveness by Feedstock, 2024 to 2034

Figure 285: Middle East and Africa Market Attractiveness by Form, 2024 to 2034

Figure 286: Middle East and Africa Market Attractiveness by Application, 2024 to 2034

Figure 287: Middle East and Africa Market Attractiveness by End-User, 2024 to 2034

Figure 288: Middle East and Africa Market Attractiveness by Country, 2024 to 2034

Recommendations

Chemicals & Materials

Structural Adhesive Market

Published : November 2023

Chemicals & Materials

Electronics Adhesives Market

Published : June 2023

Explore Chemicals & Materials Insights

View Reports