Reports

- Global Locations -

Headquarters

Future Market Insights, Inc.

Christiana Corporate, 200
Continental Drive, Suite 401,
Newark, Delaware - 19713,
United States

T: +1-845-579-5705

Americas

Future Market Insights, Inc.

616 Corporate Way, Suite 2-9018,
Valley Cottage, NY 10989, United States

T: +1-347-918-3531

MEA

Future Market Insights

1602-6 Jumeirah Bay X2 Tower, Plot No: JLT-PH2-X2A,
Jumeirah Lakes Towers, Dubai,
United Arab Emirates

Europe

Future Market Insights

3rd Floor, 207 Regent Street,
W1B 3HH London
United Kingdom

T: + 44 (0) 20 8123 9659
D: +44 (0) 20 3287 4268

Asia Pacific

Future Market Insights

IndiaLand Global Tech Park, Unit UG-1, Behind Grand HighStreet, Phase 1, Hinjawadi, MH, Pune – 411057, India

Turboexpander Market Outlook from 2024 to 2034

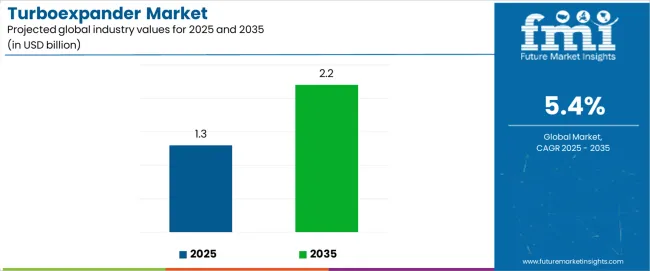
The turboexpander market is estimated to be valued at US$ 1.2 billion in 2024 and is projected to reach US$ 2 billion by 2034, exhibiting a modest CAGR of 5.40% over the forecast period.

Key Market Drivers:

The turboexpander market generated an estimated revenue of US$ 800 million in 2019. Over the span of four years, the market developed at a pace of 7.00% CAGR and added revenue of US$ 400 million in 2023. Several reasons can be attributed to this growth:

  • Increased demand for efficient natural gas processing plants, where turboexpanders play a crucial role in gas processing and liquefaction
  • The expansion of LNG infrastructure, including liquefaction plants, regasification terminals, and LNG carriers, which require turboexpanders for various processes
  • Rising emphasis of industries on optimizing energy usage and minimizing waste, where turboexpanders are used to harness the energy from high-pressure gas streams and convert it into mechanical power or electricity
  • Surging demand for cryogenic applications in industries such as healthcare (medical gases), food processing (cryogenic freezing), and electronics (semiconductor manufacturing)
  • Ongoing advancements in turboexpander design and manufacturing is leading to significant improvements in efficiency, reliability, and performance
  • The exploration and production of oil and gas which require efficient processing technologies like turboexpanders to extract and process hydrocarbons effectively
  • Stringent environmental regulations to reduce emissions, pushing industries to install turboexpanders in their plants to recover waste energy and reduce overall energy consumption and emissions
Attributes Key Statistics
Estimated Market Size (2024) US$ 1.2 billion
Forecasted Market Year Value (2034) US$ 2 billion
Projected Growth (2024 to 2034) 5.40% CAGR

Don't pay for what you don't need

Customize your report by selecting specific countries or regions and save 30%!

Consumption Analysis of Turboexpanders

  • The global oil and gas sector is increasingly adopting turboexpanders, especially by companies involved in natural gas processing plants, LNG facilities, and oil refineries for gas processing, gas liquefaction, and hydrocarbon recovery processes.
  • The sales of turboexpanders are also growing among chemical plants. Companies in this group use turboexpanders for cryogenic applications, such as the separation and purification of gases, as well as for energy recovery from high-pressure gas stream.
  • Turboexpanders are also experiencing increasing demand from power plants, particularly those utilizing combined-cycle or cogeneration systems to recover waste heat from exhaust gases and convert it into electricity.
  • Petrochemical facilities also incorporate turboexpanders for various processes, including ethylene and propylene production, gas separation, and hydrogen recovery.
  • The growing adoption of turboexpanders is also observed in geothermal power plants, biomass facilities, and waste heat recovery systems, where they help generate electricity from renewable sources and improve overall energy efficiency.
  • The sales of turboexpanders are also soaring in healthcare for the production and purification of medical gases, such as oxygen, nitrogen, and argon, used in medical facilities and laboratories.

Restraining Factors Adversely Affecting the Turboexpander Market

The market is anticipated to surpass a valuation of US$ 2 billion by 2034, with a growth rate of 5.40% CAGR. While the market is expected to experience remarkable growth, several restraining factors could adversely affect its development:

  • The upfront cost associated with acquiring modern turboexpanders is keeping a substantial number of consumers away from the market, particularly smaller companies or organizations with limited budgets.
  • Integrating turboexpanders into existing industrial setups is a very cumbersome and costly process. This complexity increases implementation time and costs, posing a barrier to adoption for some industries.
  • Turboexpanders require precise engineering and maintenance to ensure optimal performance and reliability. The lack of a skilled workforce is another challenge, hindering the widespread adoption of turboexpanders in industries.
  • Alternative technologies for energy recovery and waste heat utilization, such as organic Rankine cycle (ORC) systems and absorption chillers, are also diverting potential consumers away from the market.
Nikhil Kaitwade
Nikhil Kaitwade

Principal Consultant

Talk to Analyst

Find your sweet spots for generating winning opportunities in this market.

Comparative View of Adjacent Industries

A comprehensive study has been conducted for the global manufacturing and industrial sector, identifying two products that have the potential to pose rigorous competition to the turboexpander market: the advanced energy storage system market and the absorption chillers market.

The growth rates and current market valuations have been mentioned in the table below. The growth factors and critical challenges in the respective markets have also been discussed. Based on these numbers, the market for advanced energy storage systems is anticipated to outpace the other two in the near future.

Turboexpander Market:

Attributes Turboexpander Market
CAGR (2024 to 2034) 5.40%
Growth Factor Technological advancements enhancing turboexpander performance and reliability
Challenges High initial investment costs associated with turboexpander systems

Advanced Energy Storage System Market:

Attributes Advanced Energy Storage System Market
CAGR (2024 to 2034) 9.50%
Growth Factor Increasing adoption of electric vehicles (EVs) and renewable energy systems
Challenges Environmental concerns related to battery disposal and materials sourcing

Absorption Chillers Market:

Attributes Absorption Chillers Market
CAGR (2024 to 2034) 4.50%
Growth Factor Increasing demand for air conditioning and refrigeration in commercial and industrial sectors
Challenges Competition from alternative cooling technologies such as vapor compression systems

Category-wise Insights

Axial Flow Turboexpanders to Gain Impetus in Industrial Units

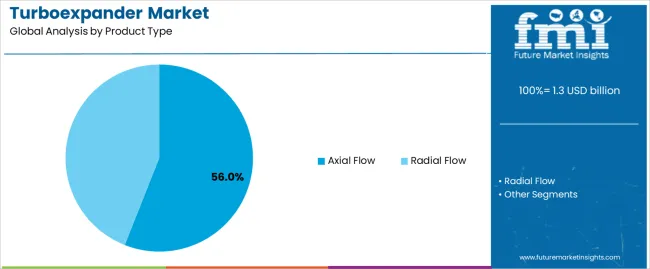
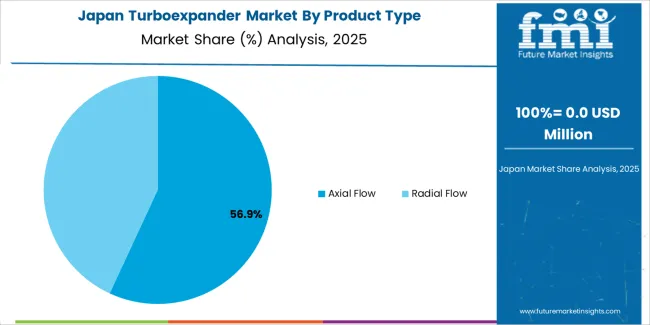
Depending on the product type, the turboexpander market is bifurcated into axial and radial flow. The axial flow segment is anticipated to grow at a modest CAGR of 5.10%.

  • The demand for axial flow turboexpanders is skyrocketing among manufacturing units as they offer higher efficiency, a compact design, and better performance in handling large volume flows and variable operating conditions.
  • These turboexpanders also find their place in various industrial applications, including natural gas processing, liquefied natural gas (LNG) production, and petrochemical refining.
  • Manufacturing units seeking energy-efficient and reliable solutions for energy recovery and process optimization are also adopting turboexpanders, further contributing to the market value.
Attributes Details
Product Type Axial Flow
Forecasted CAGR (from 2024 to 2034) 5.10%

The Sales of Compressor Turboexpanders to Skyrocket in the Coming Decade

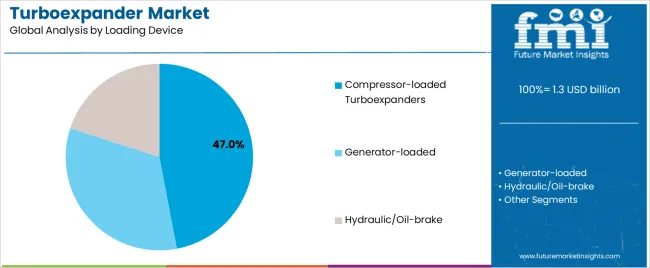
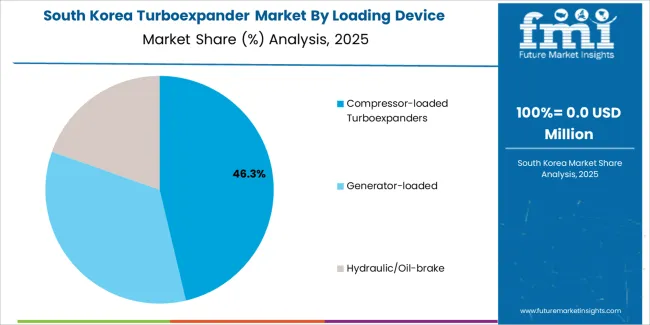
The turboexpander market is categorized by loading devices into compressors, generators, and hydraulic/oil-brakes. The compressors segment dominates the market and is anticipated to grow at a modest CAGR of 4.80%.

  • Businesses are increasingly preferring turboexpanders as they offer significant energy savings by recovering and utilizing waste energy from high-pressure gas streams. This energy can be converted into mechanical power or electricity.
  • The world is constantly pushing toward sustainability, and with increasing awareness of environmental issues and the need to reduce greenhouse gas emissions, factory units are installing turboexpanders to mitigate energy costs.
Attributes Details
Loading Devices Compressors
Forecasted CAGR (from 2024 to 2034) 4.80%

Get the data you need at a Fraction of the cost

Personalize your report by choosing insights you need
and save 40%!

Country-wise Insights

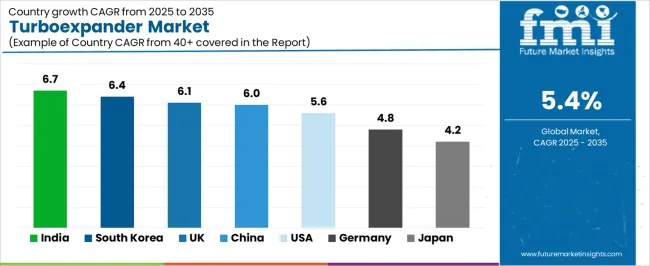
The section provides an analysis of the turboexpander market by country, including Japan, China, the United States, South Korea, and the United Kingdom. The table presents the CAGR for each country, indicating the expected growth of the market in that country through 2034.

Countries Forecasted CAGR (from 2024 to 2034)
South Korea 7.40%
The United Kingdom 6.90%
China 6.40%
The United States 5.80%
Japan 4.00%

Turboexpander Market in South Korea

South Korea is one of the leading countries in this market. The market in South Korea is anticipated to retain its dominance by progressing at an annual growth rate of 7.40% until 2034.

  • South Korea's government has been actively promoting energy efficiency measures to reduce greenhouse gas emissions for the past few years. This creates a favorable environment for companies to invest in turboexpanders, which help in energy recovery and process optimization.
  • In recent years, South Korea has also experienced exponential expansion in its petrochemical industry, with significant investments in refining and processing facilities. The expansion of these industries drives the demand for turboexpanders, which are essential for gas processing, liquefaction, and hydrocarbon recovery.

Turboexpander Market in the United Kingdom

The United Kingdom has also emerged as an important market for turboexpanders. The market is anticipated to maintain its strength by progressing at an annual growth rate of 6.90% until 2034.

  • Similar to South Korea, the United Kingdom's government is also investing heavily in renewable energy sources to reduce dependence on fossil fuels and combat climate change. Turboexpanders play a role in renewable energy applications such as geothermal power plants and waste heat recovery systems, driving market growth.
  • The United Kingdom also maintains a significant oil and gas sector, particularly in the North Sea region. This naturally generates excellent demand for turboexpanders as they are essential components in gas processing and liquefaction plants.

Turboexpander Market in China

China is a significant player in the turboexpander industry, closely following the United States in dominance. The Chinese turboexpander market is anticipated to exhibit an annual growth rate of 6.40% till 2034.

  • China has experienced rapid industrialization and modernization in the last few decades. This has led to an increased demand for energy across various sectors. Turboexpanders are utilized in industries such as oil and gas, chemicals, and power generation for energy recovery and process optimization, fueling the market growth.
  • China has also been investing heavily in the expansion of natural gas pipelines, LNG terminals, and petrochemical facilities. This infrastructure investment drives the demand for turboexpanders for gas processing, liquefaction, and energy recovery applications.

Turboexpander Market in the United States

The turboexpander market is primarily led by the United States, and it is expected to witness a CAGR of 5.80% through the year 2034.

  • The United States has experienced a boom in shale gas production, leading to increased investments in gas processing and LNG export facilities. Turboexpanders are critical components in these facilities for gas processing, driving the market growth.
  • Just like China, the United States is also undergoing a period of industrial modernization. This has amplified the adoption of turboexpanders as they offer energy-saving solutions for industries such as petrochemicals, chemicals, and power generation.

Turboexpander Market in Japan

Japan also makes a significant contribution to the turboexpander industry. Over the next ten years, the Japanese demand for turboexpander is projected to rise at a 4.00% CAGR.

  • Japan, as a country, is very concerned about its energy sources, being an island nation with limited natural resources. This is why companies in Japan emphasize turboexpanders in LNG terminals and gas processing plants to support energy imports and ensure efficient resource utilization.
  • Japan is also known for its technological innovation and engineering expertise. Scientific advancements in turboexpander design and manufacturing have enhanced their efficiency and reliability, making them attractive solutions for energy recovery in industrial processes.

Competitive Landscape

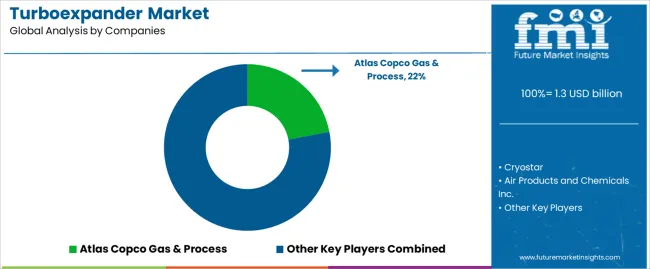
The turboexpander market has numerous players that cater to both international and domestic consumers. Some of the prominent companies in the market, such as Atlas Copco, Cryostar, Air Products and Chemicals, Inc., Baker Hughes, and General Electric, are continuously investing in research and development activities to enhance the efficiency, functionality, and sustainability of their products.

Along with this, these companies often receive grants and subsidies from the government to promote the adoption of turboexpander technology in various industries.

Recent Developments

  • In June 2023, Sapphire Technologies shipped its largest batch of turboexpanders yet, partnering with Tallgrass and Evolve Energy. The delivery of four turboexpanders marked the beginning of a significant milestone, with plans for a 400% production increase by year-end.
  • In May 2023, Iranian experts and technicians at Shazand Petrochemical Company in Markazi Province domestically designed and produced a turboexpander, breaking the West's monopoly. The feat, announced by Iran's Ministry of Petroleum's Shana news agency, involved collaboration with a local knowledge-based firm, offering significant cost savings.
  • In August 2023, Nikkiso Clean Energy & Industrial Gases Group's Cryogenic Service unit, Nikkiso Cryogenic Services (NCS), partnered with Neuman & Esser (NEA) Brazil, expanding local support for Nikkiso products like ACD cryogenic pumps and turboexpanders in Brazil, aiming to streamline repairs and enhance customer service.

Key Companies in the Market

  • Atlas Copco
  • Cryostar
  • Air Products and Chemicals, Inc.
  • Baker Hughes
  • General Electric
  • Siemens
  • Elliott Group
  • Turbogaz
  • L.A. Turbine
  • Kobelco
  • Hangyang
  • ACD
  • Cryoquip
  • Cryodynamics
  • GE Oil & Gas
  • Sulzer
  • R&D Dynamics Corporation
  • Howden
  • Toshiba
  • Voith Turbo

Key Coverage in the Turboexpander Market Report

  • Turboexpander Market Pricing Strategy
  • Top Companies and Manufacturers in the Turboexpander Market
  • Analytical Adjacent Study on Hydrogen/Helium Turboexpander Market and Turboexpander Compressor Market
  • Raw Material Price Variation in the Market

Turboexpander Market by Segmentation

By Product Type:

  • Axial Flow
  • Radial Flow

By Loading Device:

  • Compressor
  • Generator
  • Hydraulic/Oil-brake

By Power Capacity:

  • Less than 1 MW
  • 1MW - 4 MW
  • 5MW - 9MW
  • 10MW - 19MW
  • 20MW - 24 MW
  • 25 MW - 40 MW
  • Above 40 MW

By Application:

  • Air Separation
  • Oil & Gas Processing
  • Cryogenic Application
  • Others

By End Use:

  • Oil & Gas
  • Energy & Power
  • Chemical & Petrochemicals
  • Others

By Region:

  • North America
  • Latin America
  • Asia Pacific
  • Middle East and Africa (MEA)
  • Europe

Frequently Asked Questions

What is the Current Worth of the Turboexpander Market?

The market is expected to be worth US$ 1.2 billion by 2024.

What is the Sales Forecast for Turboexpander through 2034?

The market for turboexpander is expected to reach US$ 2 billion by 2034.

What is the Projected Growth Rate for the Turboexpander Market?

The market is set to grow at a CAGR of 5.40% from 2024 to 2034.

Who are the Key Manufacturing Companies Offering Turboexpander?

Atlas Copco, Cryostar, Air Products and Chemicals, Inc., Baker Hughes, and General Electric are some of the major players in the market.

What was the Overall Value of the Turboexpander Market in 2023?

The valuation for the turboexpander industry in 2023 was US$ 1.1 billion.

Table of Content

1. Executive Summary

    1.1. Global Market Outlook

    1.2. Demand-side Trends

    1.3. Supply-side Trends

    1.4. Technology Roadmap Analysis

    1.5. Analysis and Recommendations

2. Market Overview

    2.1. Market Coverage / Taxonomy

    2.2. Market Definition / Scope / Limitations

3. Market Background

    3.1. Market Dynamics

        3.1.1. Drivers

        3.1.2. Restraints

        3.1.3. Opportunity

        3.1.4. Trends

    3.2. Scenario Forecast

        3.2.1. Demand in Optimistic Scenario

        3.2.2. Demand in Likely Scenario

        3.2.3. Demand in Conservative Scenario

    3.3. Opportunity Map Analysis

    3.4. Product Life Cycle Analysis

    3.5. Supply Chain Analysis

        3.5.1. Supply Side Participants and their Roles

            3.5.1.1. Producers

            3.5.1.2. Mid-Level Participants (Traders/ Agents/ Brokers)

            3.5.1.3. Wholesalers and Distributors

        3.5.2. Value Added and Value Created at Node in the Supply Chain

        3.5.3. List of Raw Material Suppliers

        3.5.4. List of Existing and Potential Buyer’s

    3.6. Investment Feasibility Matrix

    3.7. Value Chain Analysis

        3.7.1. Profit Margin Analysis

        3.7.2. Wholesalers and Distributors

        3.7.3. Retailers

    3.8. PESTLE and Porter’s Analysis

    3.9. Regulatory Landscape

        3.9.1. By Key Regions

        3.9.2. By Key Countries

    3.10. Regional Parent Market Outlook

    3.11. Production and Consumption Statistics

    3.12. Import and Export Statistics

4. Global Market Analysis 2019 to 2023 and Forecast, 2024 to 2034

    4.1. Historical Market Size Value (US$ Million) & Volume (Units) Analysis, 2019 to 2023

    4.2. Current and Future Market Size Value (US$ Million) & Volume (Units) Projections, 2024 to 2034

        4.2.1. Y-o-Y Growth Trend Analysis

        4.2.2. Absolute $ Opportunity Analysis

5. Global Market Analysis 2019 to 2023 and Forecast 2024 to 2034, By Product Type

    5.1. Introduction / Key Findings

    5.2. Historical Market Size Value (US$ Million) & Volume (Units) Analysis By Product Type, 2019 to 2023

    5.3. Current and Future Market Size Value (US$ Million) & Volume (Units) Analysis and Forecast By Product Type, 2024 to 2034

        5.3.1. Axial Flow

        5.3.2. Radial Flow

    5.4. Y-o-Y Growth Trend Analysis By Product Type, 2019 to 2023

    5.5. Absolute $ Opportunity Analysis By Product Type, 2024 to 2034

6. Global Market Analysis 2019 to 2023 and Forecast 2024 to 2034, By Loading Device

    6.1. Introduction / Key Findings

    6.2. Historical Market Size Value (US$ Million) & Volume (Units) Analysis By Loading Device, 2019 to 2023

    6.3. Current and Future Market Size Value (US$ Million) & Volume (Units) Analysis and Forecast By Loading Device, 2024 to 2034

        6.3.1. Compressor

        6.3.2. Generator

        6.3.3. Hydraulic/Oil-brake

    6.4. Y-o-Y Growth Trend Analysis By Loading Device, 2019 to 2023

    6.5. Absolute $ Opportunity Analysis By Loading Device, 2024 to 2034

7. Global Market Analysis 2019 to 2023 and Forecast 2024 to 2034, By Power Capacity

    7.1. Introduction / Key Findings

    7.2. Historical Market Size Value (US$ Million) & Volume (Units) Analysis By Power Capacity, 2019 to 2023

    7.3. Current and Future Market Size Value (US$ Million) & Volume (Units) Analysis and Forecast By Power Capacity, 2024 to 2034

        7.3.1. Less than 1 MW

        7.3.2. 1MW - 4 MW

        7.3.3. 5MW - 9MW

        7.3.4. 10MW - 19MW

        7.3.5. 20MW - 24 MW

        7.3.6. 25 MW - 40 MW

        7.3.7. Above 40 MW

    7.4. Y-o-Y Growth Trend Analysis By Power Capacity, 2019 to 2023

    7.5. Absolute $ Opportunity Analysis By Power Capacity, 2024 to 2034

8. Global Market Analysis 2019 to 2023 and Forecast 2024 to 2034, By Application

    8.1. Introduction / Key Findings

    8.2. Historical Market Size Value (US$ Million) & Volume (Units) Analysis By Application, 2019 to 2023

    8.3. Current and Future Market Size Value (US$ Million) & Volume (Units) Analysis and Forecast By Application, 2024 to 2034

        8.3.1. Air Separation

        8.3.2. Oil & Gas Processing

        8.3.3. Cryogenic Application

        8.3.4. Others

    8.4. Y-o-Y Growth Trend Analysis By Application, 2019 to 2023

    8.5. Absolute $ Opportunity Analysis By Application, 2024 to 2034

9. Global Market Analysis 2019 to 2023 and Forecast 2024 to 2034, By End-use

    9.1. Introduction / Key Findings

    9.2. Historical Market Size Value (US$ Million) & Volume (Units) Analysis By End-use, 2019 to 2023

    9.3. Current and Future Market Size Value (US$ Million) & Volume (Units) Analysis and Forecast By End-use, 2024 to 2034

        9.3.1. Oil & Gas

        9.3.2. Energy & Power

        9.3.3. Chemical & Petrochemicals

        9.3.4. Others

    9.4. Y-o-Y Growth Trend Analysis By End-use, 2019 to 2023

    9.5. Absolute $ Opportunity Analysis By End-use, 2024 to 2034

10. Global Market Analysis 2019 to 2023 and Forecast 2024 to 2034, By Region

    10.1. Introduction

    10.2. Historical Market Size Value (US$ Million) & Volume (Units) Analysis By Region, 2019 to 2023

    10.3. Current Market Size Value (US$ Million) & Volume (Units) Analysis and Forecast By Region, 2024 to 2034

        10.3.1. North America

        10.3.2. Latin America

        10.3.3. Western Europe

        10.3.4. Eastern Europe

        10.3.5. South Asia and Pacific

        10.3.6. East Asia

        10.3.7. Middle East and Africa

    10.4. Market Attractiveness Analysis By Region

11. North America Market Analysis 2019 to 2023 and Forecast 2024 to 2034, By Country

    11.1. Historical Market Size Value (US$ Million) & Volume (Units) Trend Analysis By Market Taxonomy, 2019 to 2023

    11.2. Market Size Value (US$ Million) & Volume (Units) Forecast By Market Taxonomy, 2024 to 2034

        11.2.1. By Country

            11.2.1.1. USA

            11.2.1.2. Canada

        11.2.2. By Product Type

        11.2.3. By Loading Device

        11.2.4. By Power Capacity

        11.2.5. By Application

        11.2.6. By End-use

    11.3. Market Attractiveness Analysis

        11.3.1. By Country

        11.3.2. By Product Type

        11.3.3. By Loading Device

        11.3.4. By Power Capacity

        11.3.5. By Application

        11.3.6. By End-use

    11.4. Key Takeaways

12. Latin America Market Analysis 2019 to 2023 and Forecast 2024 to 2034, By Country

    12.1. Historical Market Size Value (US$ Million) & Volume (Units) Trend Analysis By Market Taxonomy, 2019 to 2023

    12.2. Market Size Value (US$ Million) & Volume (Units) Forecast By Market Taxonomy, 2024 to 2034

        12.2.1. By Country

            12.2.1.1. Brazil

            12.2.1.2. Mexico

            12.2.1.3. Rest of Latin America

        12.2.2. By Product Type

        12.2.3. By Loading Device

        12.2.4. By Power Capacity

        12.2.5. By Application

        12.2.6. By End-use

    12.3. Market Attractiveness Analysis

        12.3.1. By Country

        12.3.2. By Product Type

        12.3.3. By Loading Device

        12.3.4. By Power Capacity

        12.3.5. By Application

        12.3.6. By End-use

    12.4. Key Takeaways

13. Western Europe Market Analysis 2019 to 2023 and Forecast 2024 to 2034, By Country

    13.1. Historical Market Size Value (US$ Million) & Volume (Units) Trend Analysis By Market Taxonomy, 2019 to 2023

    13.2. Market Size Value (US$ Million) & Volume (Units) Forecast By Market Taxonomy, 2024 to 2034

        13.2.1. By Country

            13.2.1.1. Germany

            13.2.1.2. UK

            13.2.1.3. France

            13.2.1.4. Spain

            13.2.1.5. Italy

            13.2.1.6. Rest of Western Europe

        13.2.2. By Product Type

        13.2.3. By Loading Device

        13.2.4. By Power Capacity

        13.2.5. By Application

        13.2.6. By End-use

    13.3. Market Attractiveness Analysis

        13.3.1. By Country

        13.3.2. By Product Type

        13.3.3. By Loading Device

        13.3.4. By Power Capacity

        13.3.5. By Application

        13.3.6. By End-use

    13.4. Key Takeaways

14. Eastern Europe Market Analysis 2019 to 2023 and Forecast 2024 to 2034, By Country

    14.1. Historical Market Size Value (US$ Million) & Volume (Units) Trend Analysis By Market Taxonomy, 2019 to 2023

    14.2. Market Size Value (US$ Million) & Volume (Units) Forecast By Market Taxonomy, 2024 to 2034

        14.2.1. By Country

            14.2.1.1. Poland

            14.2.1.2. Russia

            14.2.1.3. Czech Republic

            14.2.1.4. Romania

            14.2.1.5. Rest of Eastern Europe

        14.2.2. By Product Type

        14.2.3. By Loading Device

        14.2.4. By Power Capacity

        14.2.5. By Application

        14.2.6. By End-use

    14.3. Market Attractiveness Analysis

        14.3.1. By Country

        14.3.2. By Product Type

        14.3.3. By Loading Device

        14.3.4. By Power Capacity

        14.3.5. By Application

        14.3.6. By End-use

    14.4. Key Takeaways

15. South Asia and Pacific Market Analysis 2019 to 2023 and Forecast 2024 to 2034, By Country

    15.1. Historical Market Size Value (US$ Million) & Volume (Units) Trend Analysis By Market Taxonomy, 2019 to 2023

    15.2. Market Size Value (US$ Million) & Volume (Units) Forecast By Market Taxonomy, 2024 to 2034

        15.2.1. By Country

            15.2.1.1. India

            15.2.1.2. Bangladesh

            15.2.1.3. Australia

            15.2.1.4. New Zealand

            15.2.1.5. Rest of South Asia and Pacific

        15.2.2. By Product Type

        15.2.3. By Loading Device

        15.2.4. By Power Capacity

        15.2.5. By Application

        15.2.6. By End-use

    15.3. Market Attractiveness Analysis

        15.3.1. By Country

        15.3.2. By Product Type

        15.3.3. By Loading Device

        15.3.4. By Power Capacity

        15.3.5. By Application

        15.3.6. By End-use

    15.4. Key Takeaways

16. East Asia Market Analysis 2019 to 2023 and Forecast 2024 to 2034, By Country

    16.1. Historical Market Size Value (US$ Million) & Volume (Units) Trend Analysis By Market Taxonomy, 2019 to 2023

    16.2. Market Size Value (US$ Million) & Volume (Units) Forecast By Market Taxonomy, 2024 to 2034

        16.2.1. By Country

            16.2.1.1. China

            16.2.1.2. Japan

            16.2.1.3. South Korea

        16.2.2. By Product Type

        16.2.3. By Loading Device

        16.2.4. By Power Capacity

        16.2.5. By Application

        16.2.6. By End-use

    16.3. Market Attractiveness Analysis

        16.3.1. By Country

        16.3.2. By Product Type

        16.3.3. By Loading Device

        16.3.4. By Power Capacity

        16.3.5. By Application

        16.3.6. By End-use

    16.4. Key Takeaways

17. Middle East and Africa Market Analysis 2019 to 2023 and Forecast 2024 to 2034, By Country

    17.1. Historical Market Size Value (US$ Million) & Volume (Units) Trend Analysis By Market Taxonomy, 2019 to 2023

    17.2. Market Size Value (US$ Million) & Volume (Units) Forecast By Market Taxonomy, 2024 to 2034

        17.2.1. By Country

            17.2.1.1. GCC Countries

            17.2.1.2. South Africa

            17.2.1.3. Israel

            17.2.1.4. Rest of MEA

        17.2.2. By Product Type

        17.2.3. By Loading Device

        17.2.4. By Power Capacity

        17.2.5. By Application

        17.2.6. By End-use

    17.3. Market Attractiveness Analysis

        17.3.1. By Country

        17.3.2. By Product Type

        17.3.3. By Loading Device

        17.3.4. By Power Capacity

        17.3.5. By Application

        17.3.6. By End-use

    17.4. Key Takeaways

18. Key Countries Market Analysis

    18.1. USA

        18.1.1. Pricing Analysis

        18.1.2. Market Share Analysis, 2023

            18.1.2.1. By Product Type

            18.1.2.2. By Loading Device

            18.1.2.3. By Power Capacity

            18.1.2.4. By Application

            18.1.2.5. By End-use

    18.2. Canada

        18.2.1. Pricing Analysis

        18.2.2. Market Share Analysis, 2023

            18.2.2.1. By Product Type

            18.2.2.2. By Loading Device

            18.2.2.3. By Power Capacity

            18.2.2.4. By Application

            18.2.2.5. By End-use

    18.3. Brazil

        18.3.1. Pricing Analysis

        18.3.2. Market Share Analysis, 2023

            18.3.2.1. By Product Type

            18.3.2.2. By Loading Device

            18.3.2.3. By Power Capacity

            18.3.2.4. By Application

            18.3.2.5. By End-use

    18.4. Mexico

        18.4.1. Pricing Analysis

        18.4.2. Market Share Analysis, 2023

            18.4.2.1. By Product Type

            18.4.2.2. By Loading Device

            18.4.2.3. By Power Capacity

            18.4.2.4. By Application

            18.4.2.5. By End-use

    18.5. Germany

        18.5.1. Pricing Analysis

        18.5.2. Market Share Analysis, 2023

            18.5.2.1. By Product Type

            18.5.2.2. By Loading Device

            18.5.2.3. By Power Capacity

            18.5.2.4. By Application

            18.5.2.5. By End-use

    18.6. UK

        18.6.1. Pricing Analysis

        18.6.2. Market Share Analysis, 2023

            18.6.2.1. By Product Type

            18.6.2.2. By Loading Device

            18.6.2.3. By Power Capacity

            18.6.2.4. By Application

            18.6.2.5. By End-use

    18.7. France

        18.7.1. Pricing Analysis

        18.7.2. Market Share Analysis, 2023

            18.7.2.1. By Product Type

            18.7.2.2. By Loading Device

            18.7.2.3. By Power Capacity

            18.7.2.4. By Application

            18.7.2.5. By End-use

    18.8. Spain

        18.8.1. Pricing Analysis

        18.8.2. Market Share Analysis, 2023

            18.8.2.1. By Product Type

            18.8.2.2. By Loading Device

            18.8.2.3. By Power Capacity

            18.8.2.4. By Application

            18.8.2.5. By End-use

    18.9. Italy

        18.9.1. Pricing Analysis

        18.9.2. Market Share Analysis, 2023

            18.9.2.1. By Product Type

            18.9.2.2. By Loading Device

            18.9.2.3. By Power Capacity

            18.9.2.4. By Application

            18.9.2.5. By End-use

    18.10. Poland

        18.10.1. Pricing Analysis

        18.10.2. Market Share Analysis, 2023

            18.10.2.1. By Product Type

            18.10.2.2. By Loading Device

            18.10.2.3. By Power Capacity

            18.10.2.4. By Application

            18.10.2.5. By End-use

    18.11. Russia

        18.11.1. Pricing Analysis

        18.11.2. Market Share Analysis, 2023

            18.11.2.1. By Product Type

            18.11.2.2. By Loading Device

            18.11.2.3. By Power Capacity

            18.11.2.4. By Application

            18.11.2.5. By End-use

    18.12. Czech Republic

        18.12.1. Pricing Analysis

        18.12.2. Market Share Analysis, 2023

            18.12.2.1. By Product Type

            18.12.2.2. By Loading Device

            18.12.2.3. By Power Capacity

            18.12.2.4. By Application

            18.12.2.5. By End-use

    18.13. Romania

        18.13.1. Pricing Analysis

        18.13.2. Market Share Analysis, 2023

            18.13.2.1. By Product Type

            18.13.2.2. By Loading Device

            18.13.2.3. By Power Capacity

            18.13.2.4. By Application

            18.13.2.5. By End-use

    18.14. India

        18.14.1. Pricing Analysis

        18.14.2. Market Share Analysis, 2023

            18.14.2.1. By Product Type

            18.14.2.2. By Loading Device

            18.14.2.3. By Power Capacity

            18.14.2.4. By Application

            18.14.2.5. By End-use

    18.15. Bangladesh

        18.15.1. Pricing Analysis

        18.15.2. Market Share Analysis, 2023

            18.15.2.1. By Product Type

            18.15.2.2. By Loading Device

            18.15.2.3. By Power Capacity

            18.15.2.4. By Application

            18.15.2.5. By End-use

    18.16. Australia

        18.16.1. Pricing Analysis

        18.16.2. Market Share Analysis, 2023

            18.16.2.1. By Product Type

            18.16.2.2. By Loading Device

            18.16.2.3. By Power Capacity

            18.16.2.4. By Application

            18.16.2.5. By End-use

    18.17. New Zealand

        18.17.1. Pricing Analysis

        18.17.2. Market Share Analysis, 2023

            18.17.2.1. By Product Type

            18.17.2.2. By Loading Device

            18.17.2.3. By Power Capacity

            18.17.2.4. By Application

            18.17.2.5. By End-use

    18.18. China

        18.18.1. Pricing Analysis

        18.18.2. Market Share Analysis, 2023

            18.18.2.1. By Product Type

            18.18.2.2. By Loading Device

            18.18.2.3. By Power Capacity

            18.18.2.4. By Application

            18.18.2.5. By End-use

    18.19. Japan

        18.19.1. Pricing Analysis

        18.19.2. Market Share Analysis, 2023

            18.19.2.1. By Product Type

            18.19.2.2. By Loading Device

            18.19.2.3. By Power Capacity

            18.19.2.4. By Application

            18.19.2.5. By End-use

    18.20. South Korea

        18.20.1. Pricing Analysis

        18.20.2. Market Share Analysis, 2023

            18.20.2.1. By Product Type

            18.20.2.2. By Loading Device

            18.20.2.3. By Power Capacity

            18.20.2.4. By Application

            18.20.2.5. By End-use

    18.21. GCC Countries

        18.21.1. Pricing Analysis

        18.21.2. Market Share Analysis, 2023

            18.21.2.1. By Product Type

            18.21.2.2. By Loading Device

            18.21.2.3. By Power Capacity

            18.21.2.4. By Application

            18.21.2.5. By End-use

    18.22. South Africa

        18.22.1. Pricing Analysis

        18.22.2. Market Share Analysis, 2023

            18.22.2.1. By Product Type

            18.22.2.2. By Loading Device

            18.22.2.3. By Power Capacity

            18.22.2.4. By Application

            18.22.2.5. By End-use

    18.23. Israel

        18.23.1. Pricing Analysis

        18.23.2. Market Share Analysis, 2023

            18.23.2.1. By Product Type

            18.23.2.2. By Loading Device

            18.23.2.3. By Power Capacity

            18.23.2.4. By Application

            18.23.2.5. By End-use

19. Market Structure Analysis

    19.1. Competition Dashboard

    19.2. Competition Benchmarking

    19.3. Market Share Analysis of Top Players

        19.3.1. By Regional

        19.3.2. By Product Type

        19.3.3. By Loading Device

        19.3.4. By Power Capacity

        19.3.5. By Application

        19.3.6. By End-use

20. Competition Analysis

    20.1. Competition Deep Dive

        20.1.1. Atlas Copco AB

            20.1.1.1. Overview

            20.1.1.2. Product Portfolio

            20.1.1.3. Profitability by Market Segments

            20.1.1.4. Sales Footprint

            20.1.1.5. Strategy Overview

                20.1.1.5.1. Marketing Strategy

                20.1.1.5.2. Product Strategy

                20.1.1.5.3. Channel Strategy

        20.1.2. Air Products Inc. (ROTOFLOW)

            20.1.2.1. Overview

            20.1.2.2. Product Portfolio

            20.1.2.3. Profitability by Market Segments

            20.1.2.4. Sales Footprint

            20.1.2.5. Strategy Overview

                20.1.2.5.1. Marketing Strategy

                20.1.2.5.2. Product Strategy

                20.1.2.5.3. Channel Strategy

        20.1.3. Air Liquide (formerly Nikkiso Cryogenic Industries)

            20.1.3.1. Overview

            20.1.3.2. Product Portfolio

            20.1.3.3. Profitability by Market Segments

            20.1.3.4. Sales Footprint

            20.1.3.5. Strategy Overview

                20.1.3.5.1. Marketing Strategy

                20.1.3.5.2. Product Strategy

                20.1.3.5.3. Channel Strategy

        20.1.4. Baker Hughes Company

            20.1.4.1. Overview

            20.1.4.2. Product Portfolio

            20.1.4.3. Profitability by Market Segments

            20.1.4.4. Sales Footprint

            20.1.4.5. Strategy Overview

                20.1.4.5.1. Marketing Strategy

                20.1.4.5.2. Product Strategy

                20.1.4.5.3. Channel Strategy

        20.1.5. Chart Industries (L.A. Turbine)

            20.1.5.1. Overview

            20.1.5.2. Product Portfolio

            20.1.5.3. Profitability by Market Segments

            20.1.5.4. Sales Footprint

            20.1.5.5. Strategy Overview

                20.1.5.5.1. Marketing Strategy

                20.1.5.5.2. Product Strategy

                20.1.5.5.3. Channel Strategy

        20.1.6. Linde Plc (Cryostar)

            20.1.6.1. Overview

            20.1.6.2. Product Portfolio

            20.1.6.3. Profitability by Market Segments

            20.1.6.4. Sales Footprint

            20.1.6.5. Strategy Overview

                20.1.6.5.1. Marketing Strategy

                20.1.6.5.2. Product Strategy

                20.1.6.5.3. Channel Strategy

        20.1.7. R&D Dynamics Corporation

            20.1.7.1. Overview

            20.1.7.2. Product Portfolio

            20.1.7.3. Profitability by Market Segments

            20.1.7.4. Sales Footprint

            20.1.7.5. Strategy Overview

                20.1.7.5.1. Marketing Strategy

                20.1.7.5.2. Product Strategy

                20.1.7.5.3. Channel Strategy

        20.1.8. Elliott Group (EBARA Corporation)

            20.1.8.1. Overview

            20.1.8.2. Product Portfolio

            20.1.8.3. Profitability by Market Segments

            20.1.8.4. Sales Footprint

            20.1.8.5. Strategy Overview

                20.1.8.5.1. Marketing Strategy

                20.1.8.5.2. Product Strategy

                20.1.8.5.3. Channel Strategy

        20.1.9. Siemens Energy (Siemens AG)

            20.1.9.1. Overview

            20.1.9.2. Product Portfolio

            20.1.9.3. Profitability by Market Segments

            20.1.9.4. Sales Footprint

            20.1.9.5. Strategy Overview

                20.1.9.5.1. Marketing Strategy

                20.1.9.5.2. Product Strategy

                20.1.9.5.3. Channel Strategy

        20.1.10. Man Energy

            20.1.10.1. Overview

            20.1.10.2. Product Portfolio

            20.1.10.3. Profitability by Market Segments

            20.1.10.4. Sales Footprint

            20.1.10.5. Strategy Overview

                20.1.10.5.1. Marketing Strategy

                20.1.10.5.2. Product Strategy

                20.1.10.5.3. Channel Strategy

        20.1.11. PBS Group, a. s.

            20.1.11.1. Overview

            20.1.11.2. Product Portfolio

            20.1.11.3. Profitability by Market Segments

            20.1.11.4. Sales Footprint

            20.1.11.5. Strategy Overview

                20.1.11.5.1. Marketing Strategy

                20.1.11.5.2. Product Strategy

                20.1.11.5.3. Channel Strategy

        20.1.12. Turbogaz

            20.1.12.1. Overview

            20.1.12.2. Product Portfolio

            20.1.12.3. Profitability by Market Segments

            20.1.12.4. Sales Footprint

            20.1.12.5. Strategy Overview

                20.1.12.5.1. Marketing Strategy

                20.1.12.5.2. Product Strategy

                20.1.12.5.3. Channel Strategy

21. Assumptions & Acronyms Used

22. Research Methodology

List of Tables

Table 1: Global Market Value (US$ Million) Forecast by Region, 2019 to 2034

Table 2: Global Market Volume (Units) Forecast by Region, 2019 to 2034

Table 3: Global Market Value (US$ Million) Forecast by Product Type, 2019 to 2034

Table 4: Global Market Volume (Units) Forecast by Product Type, 2019 to 2034

Table 5: Global Market Value (US$ Million) Forecast by Loading Device, 2019 to 2034

Table 6: Global Market Volume (Units) Forecast by Loading Device, 2019 to 2034

Table 7: Global Market Value (US$ Million) Forecast by Power Capacity, 2019 to 2034

Table 8: Global Market Volume (Units) Forecast by Power Capacity, 2019 to 2034

Table 9: Global Market Value (US$ Million) Forecast by Application, 2019 to 2034

Table 10: Global Market Volume (Units) Forecast by Application, 2019 to 2034

Table 11: Global Market Value (US$ Million) Forecast by End-use, 2019 to 2034

Table 12: Global Market Volume (Units) Forecast by End-use, 2019 to 2034

Table 13: North America Market Value (US$ Million) Forecast by Country, 2019 to 2034

Table 14: North America Market Volume (Units) Forecast by Country, 2019 to 2034

Table 15: North America Market Value (US$ Million) Forecast by Product Type, 2019 to 2034

Table 16: North America Market Volume (Units) Forecast by Product Type, 2019 to 2034

Table 17: North America Market Value (US$ Million) Forecast by Loading Device, 2019 to 2034

Table 18: North America Market Volume (Units) Forecast by Loading Device, 2019 to 2034

Table 19: North America Market Value (US$ Million) Forecast by Power Capacity, 2019 to 2034

Table 20: North America Market Volume (Units) Forecast by Power Capacity, 2019 to 2034

Table 21: North America Market Value (US$ Million) Forecast by Application, 2019 to 2034

Table 22: North America Market Volume (Units) Forecast by Application, 2019 to 2034

Table 23: North America Market Value (US$ Million) Forecast by End-use, 2019 to 2034

Table 24: North America Market Volume (Units) Forecast by End-use, 2019 to 2034

Table 25: Latin America Market Value (US$ Million) Forecast by Country, 2019 to 2034

Table 26: Latin America Market Volume (Units) Forecast by Country, 2019 to 2034

Table 27: Latin America Market Value (US$ Million) Forecast by Product Type, 2019 to 2034

Table 28: Latin America Market Volume (Units) Forecast by Product Type, 2019 to 2034

Table 29: Latin America Market Value (US$ Million) Forecast by Loading Device, 2019 to 2034

Table 30: Latin America Market Volume (Units) Forecast by Loading Device, 2019 to 2034

Table 31: Latin America Market Value (US$ Million) Forecast by Power Capacity, 2019 to 2034

Table 32: Latin America Market Volume (Units) Forecast by Power Capacity, 2019 to 2034

Table 33: Latin America Market Value (US$ Million) Forecast by Application, 2019 to 2034

Table 34: Latin America Market Volume (Units) Forecast by Application, 2019 to 2034

Table 35: Latin America Market Value (US$ Million) Forecast by End-use, 2019 to 2034

Table 36: Latin America Market Volume (Units) Forecast by End-use, 2019 to 2034

Table 37: Western Europe Market Value (US$ Million) Forecast by Country, 2019 to 2034

Table 38: Western Europe Market Volume (Units) Forecast by Country, 2019 to 2034

Table 39: Western Europe Market Value (US$ Million) Forecast by Product Type, 2019 to 2034

Table 40: Western Europe Market Volume (Units) Forecast by Product Type, 2019 to 2034

Table 41: Western Europe Market Value (US$ Million) Forecast by Loading Device, 2019 to 2034

Table 42: Western Europe Market Volume (Units) Forecast by Loading Device, 2019 to 2034

Table 43: Western Europe Market Value (US$ Million) Forecast by Power Capacity, 2019 to 2034

Table 44: Western Europe Market Volume (Units) Forecast by Power Capacity, 2019 to 2034

Table 45: Western Europe Market Value (US$ Million) Forecast by Application, 2019 to 2034

Table 46: Western Europe Market Volume (Units) Forecast by Application, 2019 to 2034

Table 47: Western Europe Market Value (US$ Million) Forecast by End-use, 2019 to 2034

Table 48: Western Europe Market Volume (Units) Forecast by End-use, 2019 to 2034

Table 49: Eastern Europe Market Value (US$ Million) Forecast by Country, 2019 to 2034

Table 50: Eastern Europe Market Volume (Units) Forecast by Country, 2019 to 2034

Table 51: Eastern Europe Market Value (US$ Million) Forecast by Product Type, 2019 to 2034

Table 52: Eastern Europe Market Volume (Units) Forecast by Product Type, 2019 to 2034

Table 53: Eastern Europe Market Value (US$ Million) Forecast by Loading Device, 2019 to 2034

Table 54: Eastern Europe Market Volume (Units) Forecast by Loading Device, 2019 to 2034

Table 55: Eastern Europe Market Value (US$ Million) Forecast by Power Capacity, 2019 to 2034

Table 56: Eastern Europe Market Volume (Units) Forecast by Power Capacity, 2019 to 2034

Table 57: Eastern Europe Market Value (US$ Million) Forecast by Application, 2019 to 2034

Table 58: Eastern Europe Market Volume (Units) Forecast by Application, 2019 to 2034

Table 59: Eastern Europe Market Value (US$ Million) Forecast by End-use, 2019 to 2034

Table 60: Eastern Europe Market Volume (Units) Forecast by End-use, 2019 to 2034

Table 61: South Asia and Pacific Market Value (US$ Million) Forecast by Country, 2019 to 2034

Table 62: South Asia and Pacific Market Volume (Units) Forecast by Country, 2019 to 2034

Table 63: South Asia and Pacific Market Value (US$ Million) Forecast by Product Type, 2019 to 2034

Table 64: South Asia and Pacific Market Volume (Units) Forecast by Product Type, 2019 to 2034

Table 65: South Asia and Pacific Market Value (US$ Million) Forecast by Loading Device, 2019 to 2034

Table 66: South Asia and Pacific Market Volume (Units) Forecast by Loading Device, 2019 to 2034

Table 67: South Asia and Pacific Market Value (US$ Million) Forecast by Power Capacity, 2019 to 2034

Table 68: South Asia and Pacific Market Volume (Units) Forecast by Power Capacity, 2019 to 2034

Table 69: South Asia and Pacific Market Value (US$ Million) Forecast by Application, 2019 to 2034

Table 70: South Asia and Pacific Market Volume (Units) Forecast by Application, 2019 to 2034

Table 71: South Asia and Pacific Market Value (US$ Million) Forecast by End-use, 2019 to 2034

Table 72: South Asia and Pacific Market Volume (Units) Forecast by End-use, 2019 to 2034

Table 73: East Asia Market Value (US$ Million) Forecast by Country, 2019 to 2034

Table 74: East Asia Market Volume (Units) Forecast by Country, 2019 to 2034

Table 75: East Asia Market Value (US$ Million) Forecast by Product Type, 2019 to 2034

Table 76: East Asia Market Volume (Units) Forecast by Product Type, 2019 to 2034

Table 77: East Asia Market Value (US$ Million) Forecast by Loading Device, 2019 to 2034

Table 78: East Asia Market Volume (Units) Forecast by Loading Device, 2019 to 2034

Table 79: East Asia Market Value (US$ Million) Forecast by Power Capacity, 2019 to 2034

Table 80: East Asia Market Volume (Units) Forecast by Power Capacity, 2019 to 2034

Table 81: East Asia Market Value (US$ Million) Forecast by Application, 2019 to 2034

Table 82: East Asia Market Volume (Units) Forecast by Application, 2019 to 2034

Table 83: East Asia Market Value (US$ Million) Forecast by End-use, 2019 to 2034

Table 84: East Asia Market Volume (Units) Forecast by End-use, 2019 to 2034

Table 85: Middle East and Africa Market Value (US$ Million) Forecast by Country, 2019 to 2034

Table 86: Middle East and Africa Market Volume (Units) Forecast by Country, 2019 to 2034

Table 87: Middle East and Africa Market Value (US$ Million) Forecast by Product Type, 2019 to 2034

Table 88: Middle East and Africa Market Volume (Units) Forecast by Product Type, 2019 to 2034

Table 89: Middle East and Africa Market Value (US$ Million) Forecast by Loading Device, 2019 to 2034

Table 90: Middle East and Africa Market Volume (Units) Forecast by Loading Device, 2019 to 2034

Table 91: Middle East and Africa Market Value (US$ Million) Forecast by Power Capacity, 2019 to 2034

Table 92: Middle East and Africa Market Volume (Units) Forecast by Power Capacity, 2019 to 2034

Table 93: Middle East and Africa Market Value (US$ Million) Forecast by Application, 2019 to 2034

Table 94: Middle East and Africa Market Volume (Units) Forecast by Application, 2019 to 2034

Table 95: Middle East and Africa Market Value (US$ Million) Forecast by End-use, 2019 to 2034

Table 96: Middle East and Africa Market Volume (Units) Forecast by End-use, 2019 to 2034

List of Charts

Figure 1: Global Market Value (US$ Million) by Product Type, 2024 to 2034

Figure 2: Global Market Value (US$ Million) by Loading Device, 2024 to 2034

Figure 3: Global Market Value (US$ Million) by Power Capacity, 2024 to 2034

Figure 4: Global Market Value (US$ Million) by Application, 2024 to 2034

Figure 5: Global Market Value (US$ Million) by End-use, 2024 to 2034

Figure 6: Global Market Value (US$ Million) by Region, 2024 to 2034

Figure 7: Global Market Value (US$ Million) Analysis by Region, 2019 to 2034

Figure 8: Global Market Volume (Units) Analysis by Region, 2019 to 2034

Figure 9: Global Market Value Share (%) and BPS Analysis by Region, 2024 to 2034

Figure 10: Global Market Y-o-Y Growth (%) Projections by Region, 2024 to 2034

Figure 11: Global Market Value (US$ Million) Analysis by Product Type, 2019 to 2034

Figure 12: Global Market Volume (Units) Analysis by Product Type, 2019 to 2034

Figure 13: Global Market Value Share (%) and BPS Analysis by Product Type, 2024 to 2034

Figure 14: Global Market Y-o-Y Growth (%) Projections by Product Type, 2024 to 2034

Figure 15: Global Market Value (US$ Million) Analysis by Loading Device, 2019 to 2034

Figure 16: Global Market Volume (Units) Analysis by Loading Device, 2019 to 2034

Figure 17: Global Market Value Share (%) and BPS Analysis by Loading Device, 2024 to 2034

Figure 18: Global Market Y-o-Y Growth (%) Projections by Loading Device, 2024 to 2034

Figure 19: Global Market Value (US$ Million) Analysis by Power Capacity, 2019 to 2034

Figure 20: Global Market Volume (Units) Analysis by Power Capacity, 2019 to 2034

Figure 21: Global Market Value Share (%) and BPS Analysis by Power Capacity, 2024 to 2034

Figure 22: Global Market Y-o-Y Growth (%) Projections by Power Capacity, 2024 to 2034

Figure 23: Global Market Value (US$ Million) Analysis by Application, 2019 to 2034

Figure 24: Global Market Volume (Units) Analysis by Application, 2019 to 2034

Figure 25: Global Market Value Share (%) and BPS Analysis by Application, 2024 to 2034

Figure 26: Global Market Y-o-Y Growth (%) Projections by Application, 2024 to 2034

Figure 27: Global Market Value (US$ Million) Analysis by End-use, 2019 to 2034

Figure 28: Global Market Volume (Units) Analysis by End-use, 2019 to 2034

Figure 29: Global Market Value Share (%) and BPS Analysis by End-use, 2024 to 2034

Figure 30: Global Market Y-o-Y Growth (%) Projections by End-use, 2024 to 2034

Figure 31: Global Market Attractiveness by Product Type, 2024 to 2034

Figure 32: Global Market Attractiveness by Loading Device, 2024 to 2034

Figure 33: Global Market Attractiveness by Power Capacity, 2024 to 2034

Figure 34: Global Market Attractiveness by Application, 2024 to 2034

Figure 35: Global Market Attractiveness by End-use, 2024 to 2034

Figure 36: Global Market Attractiveness by Region, 2024 to 2034

Figure 37: North America Market Value (US$ Million) by Product Type, 2024 to 2034

Figure 38: North America Market Value (US$ Million) by Loading Device, 2024 to 2034

Figure 39: North America Market Value (US$ Million) by Power Capacity, 2024 to 2034

Figure 40: North America Market Value (US$ Million) by Application, 2024 to 2034

Figure 41: North America Market Value (US$ Million) by End-use, 2024 to 2034

Figure 42: North America Market Value (US$ Million) by Country, 2024 to 2034

Figure 43: North America Market Value (US$ Million) Analysis by Country, 2019 to 2034

Figure 44: North America Market Volume (Units) Analysis by Country, 2019 to 2034

Figure 45: North America Market Value Share (%) and BPS Analysis by Country, 2024 to 2034

Figure 46: North America Market Y-o-Y Growth (%) Projections by Country, 2024 to 2034

Figure 47: North America Market Value (US$ Million) Analysis by Product Type, 2019 to 2034

Figure 48: North America Market Volume (Units) Analysis by Product Type, 2019 to 2034

Figure 49: North America Market Value Share (%) and BPS Analysis by Product Type, 2024 to 2034

Figure 50: North America Market Y-o-Y Growth (%) Projections by Product Type, 2024 to 2034

Figure 51: North America Market Value (US$ Million) Analysis by Loading Device, 2019 to 2034

Figure 52: North America Market Volume (Units) Analysis by Loading Device, 2019 to 2034

Figure 53: North America Market Value Share (%) and BPS Analysis by Loading Device, 2024 to 2034

Figure 54: North America Market Y-o-Y Growth (%) Projections by Loading Device, 2024 to 2034

Figure 55: North America Market Value (US$ Million) Analysis by Power Capacity, 2019 to 2034

Figure 56: North America Market Volume (Units) Analysis by Power Capacity, 2019 to 2034

Figure 57: North America Market Value Share (%) and BPS Analysis by Power Capacity, 2024 to 2034

Figure 58: North America Market Y-o-Y Growth (%) Projections by Power Capacity, 2024 to 2034

Figure 59: North America Market Value (US$ Million) Analysis by Application, 2019 to 2034

Figure 60: North America Market Volume (Units) Analysis by Application, 2019 to 2034

Figure 61: North America Market Value Share (%) and BPS Analysis by Application, 2024 to 2034

Figure 62: North America Market Y-o-Y Growth (%) Projections by Application, 2024 to 2034

Figure 63: North America Market Value (US$ Million) Analysis by End-use, 2019 to 2034

Figure 64: North America Market Volume (Units) Analysis by End-use, 2019 to 2034

Figure 65: North America Market Value Share (%) and BPS Analysis by End-use, 2024 to 2034

Figure 66: North America Market Y-o-Y Growth (%) Projections by End-use, 2024 to 2034

Figure 67: North America Market Attractiveness by Product Type, 2024 to 2034

Figure 68: North America Market Attractiveness by Loading Device, 2024 to 2034

Figure 69: North America Market Attractiveness by Power Capacity, 2024 to 2034

Figure 70: North America Market Attractiveness by Application, 2024 to 2034

Figure 71: North America Market Attractiveness by End-use, 2024 to 2034

Figure 72: North America Market Attractiveness by Country, 2024 to 2034

Figure 73: Latin America Market Value (US$ Million) by Product Type, 2024 to 2034

Figure 74: Latin America Market Value (US$ Million) by Loading Device, 2024 to 2034

Figure 75: Latin America Market Value (US$ Million) by Power Capacity, 2024 to 2034

Figure 76: Latin America Market Value (US$ Million) by Application, 2024 to 2034

Figure 77: Latin America Market Value (US$ Million) by End-use, 2024 to 2034

Figure 78: Latin America Market Value (US$ Million) by Country, 2024 to 2034

Figure 79: Latin America Market Value (US$ Million) Analysis by Country, 2019 to 2034

Figure 80: Latin America Market Volume (Units) Analysis by Country, 2019 to 2034

Figure 81: Latin America Market Value Share (%) and BPS Analysis by Country, 2024 to 2034

Figure 82: Latin America Market Y-o-Y Growth (%) Projections by Country, 2024 to 2034

Figure 83: Latin America Market Value (US$ Million) Analysis by Product Type, 2019 to 2034

Figure 84: Latin America Market Volume (Units) Analysis by Product Type, 2019 to 2034

Figure 85: Latin America Market Value Share (%) and BPS Analysis by Product Type, 2024 to 2034

Figure 86: Latin America Market Y-o-Y Growth (%) Projections by Product Type, 2024 to 2034

Figure 87: Latin America Market Value (US$ Million) Analysis by Loading Device, 2019 to 2034

Figure 88: Latin America Market Volume (Units) Analysis by Loading Device, 2019 to 2034

Figure 89: Latin America Market Value Share (%) and BPS Analysis by Loading Device, 2024 to 2034

Figure 90: Latin America Market Y-o-Y Growth (%) Projections by Loading Device, 2024 to 2034

Figure 91: Latin America Market Value (US$ Million) Analysis by Power Capacity, 2019 to 2034

Figure 92: Latin America Market Volume (Units) Analysis by Power Capacity, 2019 to 2034

Figure 93: Latin America Market Value Share (%) and BPS Analysis by Power Capacity, 2024 to 2034

Figure 94: Latin America Market Y-o-Y Growth (%) Projections by Power Capacity, 2024 to 2034

Figure 95: Latin America Market Value (US$ Million) Analysis by Application, 2019 to 2034

Figure 96: Latin America Market Volume (Units) Analysis by Application, 2019 to 2034

Figure 97: Latin America Market Value Share (%) and BPS Analysis by Application, 2024 to 2034

Figure 98: Latin America Market Y-o-Y Growth (%) Projections by Application, 2024 to 2034

Figure 99: Latin America Market Value (US$ Million) Analysis by End-use, 2019 to 2034

Figure 100: Latin America Market Volume (Units) Analysis by End-use, 2019 to 2034

Figure 101: Latin America Market Value Share (%) and BPS Analysis by End-use, 2024 to 2034

Figure 102: Latin America Market Y-o-Y Growth (%) Projections by End-use, 2024 to 2034

Figure 103: Latin America Market Attractiveness by Product Type, 2024 to 2034

Figure 104: Latin America Market Attractiveness by Loading Device, 2024 to 2034

Figure 105: Latin America Market Attractiveness by Power Capacity, 2024 to 2034

Figure 106: Latin America Market Attractiveness by Application, 2024 to 2034

Figure 107: Latin America Market Attractiveness by End-use, 2024 to 2034

Figure 108: Latin America Market Attractiveness by Country, 2024 to 2034

Figure 109: Western Europe Market Value (US$ Million) by Product Type, 2024 to 2034

Figure 110: Western Europe Market Value (US$ Million) by Loading Device, 2024 to 2034

Figure 111: Western Europe Market Value (US$ Million) by Power Capacity, 2024 to 2034

Figure 112: Western Europe Market Value (US$ Million) by Application, 2024 to 2034

Figure 113: Western Europe Market Value (US$ Million) by End-use, 2024 to 2034

Figure 114: Western Europe Market Value (US$ Million) by Country, 2024 to 2034

Figure 115: Western Europe Market Value (US$ Million) Analysis by Country, 2019 to 2034

Figure 116: Western Europe Market Volume (Units) Analysis by Country, 2019 to 2034

Figure 117: Western Europe Market Value Share (%) and BPS Analysis by Country, 2024 to 2034

Figure 118: Western Europe Market Y-o-Y Growth (%) Projections by Country, 2024 to 2034

Figure 119: Western Europe Market Value (US$ Million) Analysis by Product Type, 2019 to 2034

Figure 120: Western Europe Market Volume (Units) Analysis by Product Type, 2019 to 2034

Figure 121: Western Europe Market Value Share (%) and BPS Analysis by Product Type, 2024 to 2034

Figure 122: Western Europe Market Y-o-Y Growth (%) Projections by Product Type, 2024 to 2034

Figure 123: Western Europe Market Value (US$ Million) Analysis by Loading Device, 2019 to 2034

Figure 124: Western Europe Market Volume (Units) Analysis by Loading Device, 2019 to 2034

Figure 125: Western Europe Market Value Share (%) and BPS Analysis by Loading Device, 2024 to 2034

Figure 126: Western Europe Market Y-o-Y Growth (%) Projections by Loading Device, 2024 to 2034

Figure 127: Western Europe Market Value (US$ Million) Analysis by Power Capacity, 2019 to 2034

Figure 128: Western Europe Market Volume (Units) Analysis by Power Capacity, 2019 to 2034

Figure 129: Western Europe Market Value Share (%) and BPS Analysis by Power Capacity, 2024 to 2034

Figure 130: Western Europe Market Y-o-Y Growth (%) Projections by Power Capacity, 2024 to 2034

Figure 131: Western Europe Market Value (US$ Million) Analysis by Application, 2019 to 2034

Figure 132: Western Europe Market Volume (Units) Analysis by Application, 2019 to 2034

Figure 133: Western Europe Market Value Share (%) and BPS Analysis by Application, 2024 to 2034

Figure 134: Western Europe Market Y-o-Y Growth (%) Projections by Application, 2024 to 2034

Figure 135: Western Europe Market Value (US$ Million) Analysis by End-use, 2019 to 2034

Figure 136: Western Europe Market Volume (Units) Analysis by End-use, 2019 to 2034

Figure 137: Western Europe Market Value Share (%) and BPS Analysis by End-use, 2024 to 2034

Figure 138: Western Europe Market Y-o-Y Growth (%) Projections by End-use, 2024 to 2034

Figure 139: Western Europe Market Attractiveness by Product Type, 2024 to 2034

Figure 140: Western Europe Market Attractiveness by Loading Device, 2024 to 2034

Figure 141: Western Europe Market Attractiveness by Power Capacity, 2024 to 2034

Figure 142: Western Europe Market Attractiveness by Application, 2024 to 2034

Figure 143: Western Europe Market Attractiveness by End-use, 2024 to 2034

Figure 144: Western Europe Market Attractiveness by Country, 2024 to 2034

Figure 145: Eastern Europe Market Value (US$ Million) by Product Type, 2024 to 2034

Figure 146: Eastern Europe Market Value (US$ Million) by Loading Device, 2024 to 2034

Figure 147: Eastern Europe Market Value (US$ Million) by Power Capacity, 2024 to 2034

Figure 148: Eastern Europe Market Value (US$ Million) by Application, 2024 to 2034

Figure 149: Eastern Europe Market Value (US$ Million) by End-use, 2024 to 2034

Figure 150: Eastern Europe Market Value (US$ Million) by Country, 2024 to 2034

Figure 151: Eastern Europe Market Value (US$ Million) Analysis by Country, 2019 to 2034

Figure 152: Eastern Europe Market Volume (Units) Analysis by Country, 2019 to 2034

Figure 153: Eastern Europe Market Value Share (%) and BPS Analysis by Country, 2024 to 2034

Figure 154: Eastern Europe Market Y-o-Y Growth (%) Projections by Country, 2024 to 2034

Figure 155: Eastern Europe Market Value (US$ Million) Analysis by Product Type, 2019 to 2034

Figure 156: Eastern Europe Market Volume (Units) Analysis by Product Type, 2019 to 2034

Figure 157: Eastern Europe Market Value Share (%) and BPS Analysis by Product Type, 2024 to 2034

Figure 158: Eastern Europe Market Y-o-Y Growth (%) Projections by Product Type, 2024 to 2034

Figure 159: Eastern Europe Market Value (US$ Million) Analysis by Loading Device, 2019 to 2034

Figure 160: Eastern Europe Market Volume (Units) Analysis by Loading Device, 2019 to 2034

Figure 161: Eastern Europe Market Value Share (%) and BPS Analysis by Loading Device, 2024 to 2034

Figure 162: Eastern Europe Market Y-o-Y Growth (%) Projections by Loading Device, 2024 to 2034

Figure 163: Eastern Europe Market Value (US$ Million) Analysis by Power Capacity, 2019 to 2034

Figure 164: Eastern Europe Market Volume (Units) Analysis by Power Capacity, 2019 to 2034

Figure 165: Eastern Europe Market Value Share (%) and BPS Analysis by Power Capacity, 2024 to 2034

Figure 166: Eastern Europe Market Y-o-Y Growth (%) Projections by Power Capacity, 2024 to 2034

Figure 167: Eastern Europe Market Value (US$ Million) Analysis by Application, 2019 to 2034

Figure 168: Eastern Europe Market Volume (Units) Analysis by Application, 2019 to 2034

Figure 169: Eastern Europe Market Value Share (%) and BPS Analysis by Application, 2024 to 2034

Figure 170: Eastern Europe Market Y-o-Y Growth (%) Projections by Application, 2024 to 2034

Figure 171: Eastern Europe Market Value (US$ Million) Analysis by End-use, 2019 to 2034

Figure 172: Eastern Europe Market Volume (Units) Analysis by End-use, 2019 to 2034

Figure 173: Eastern Europe Market Value Share (%) and BPS Analysis by End-use, 2024 to 2034

Figure 174: Eastern Europe Market Y-o-Y Growth (%) Projections by End-use, 2024 to 2034

Figure 175: Eastern Europe Market Attractiveness by Product Type, 2024 to 2034

Figure 176: Eastern Europe Market Attractiveness by Loading Device, 2024 to 2034

Figure 177: Eastern Europe Market Attractiveness by Power Capacity, 2024 to 2034

Figure 178: Eastern Europe Market Attractiveness by Application, 2024 to 2034

Figure 179: Eastern Europe Market Attractiveness by End-use, 2024 to 2034

Figure 180: Eastern Europe Market Attractiveness by Country, 2024 to 2034

Figure 181: South Asia and Pacific Market Value (US$ Million) by Product Type, 2024 to 2034

Figure 182: South Asia and Pacific Market Value (US$ Million) by Loading Device, 2024 to 2034

Figure 183: South Asia and Pacific Market Value (US$ Million) by Power Capacity, 2024 to 2034

Figure 184: South Asia and Pacific Market Value (US$ Million) by Application, 2024 to 2034

Figure 185: South Asia and Pacific Market Value (US$ Million) by End-use, 2024 to 2034

Figure 186: South Asia and Pacific Market Value (US$ Million) by Country, 2024 to 2034

Figure 187: South Asia and Pacific Market Value (US$ Million) Analysis by Country, 2019 to 2034

Figure 188: South Asia and Pacific Market Volume (Units) Analysis by Country, 2019 to 2034

Figure 189: South Asia and Pacific Market Value Share (%) and BPS Analysis by Country, 2024 to 2034

Figure 190: South Asia and Pacific Market Y-o-Y Growth (%) Projections by Country, 2024 to 2034

Figure 191: South Asia and Pacific Market Value (US$ Million) Analysis by Product Type, 2019 to 2034

Figure 192: South Asia and Pacific Market Volume (Units) Analysis by Product Type, 2019 to 2034

Figure 193: South Asia and Pacific Market Value Share (%) and BPS Analysis by Product Type, 2024 to 2034

Figure 194: South Asia and Pacific Market Y-o-Y Growth (%) Projections by Product Type, 2024 to 2034

Figure 195: South Asia and Pacific Market Value (US$ Million) Analysis by Loading Device, 2019 to 2034

Figure 196: South Asia and Pacific Market Volume (Units) Analysis by Loading Device, 2019 to 2034

Figure 197: South Asia and Pacific Market Value Share (%) and BPS Analysis by Loading Device, 2024 to 2034

Figure 198: South Asia and Pacific Market Y-o-Y Growth (%) Projections by Loading Device, 2024 to 2034

Figure 199: South Asia and Pacific Market Value (US$ Million) Analysis by Power Capacity, 2019 to 2034

Figure 200: South Asia and Pacific Market Volume (Units) Analysis by Power Capacity, 2019 to 2034

Figure 201: South Asia and Pacific Market Value Share (%) and BPS Analysis by Power Capacity, 2024 to 2034

Figure 202: South Asia and Pacific Market Y-o-Y Growth (%) Projections by Power Capacity, 2024 to 2034

Figure 203: South Asia and Pacific Market Value (US$ Million) Analysis by Application, 2019 to 2034

Figure 204: South Asia and Pacific Market Volume (Units) Analysis by Application, 2019 to 2034

Figure 205: South Asia and Pacific Market Value Share (%) and BPS Analysis by Application, 2024 to 2034

Figure 206: South Asia and Pacific Market Y-o-Y Growth (%) Projections by Application, 2024 to 2034

Figure 207: South Asia and Pacific Market Value (US$ Million) Analysis by End-use, 2019 to 2034

Figure 208: South Asia and Pacific Market Volume (Units) Analysis by End-use, 2019 to 2034

Figure 209: South Asia and Pacific Market Value Share (%) and BPS Analysis by End-use, 2024 to 2034

Figure 210: South Asia and Pacific Market Y-o-Y Growth (%) Projections by End-use, 2024 to 2034

Figure 211: South Asia and Pacific Market Attractiveness by Product Type, 2024 to 2034

Figure 212: South Asia and Pacific Market Attractiveness by Loading Device, 2024 to 2034

Figure 213: South Asia and Pacific Market Attractiveness by Power Capacity, 2024 to 2034

Figure 214: South Asia and Pacific Market Attractiveness by Application, 2024 to 2034

Figure 215: South Asia and Pacific Market Attractiveness by End-use, 2024 to 2034

Figure 216: South Asia and Pacific Market Attractiveness by Country, 2024 to 2034

Figure 217: East Asia Market Value (US$ Million) by Product Type, 2024 to 2034

Figure 218: East Asia Market Value (US$ Million) by Loading Device, 2024 to 2034

Figure 219: East Asia Market Value (US$ Million) by Power Capacity, 2024 to 2034

Figure 220: East Asia Market Value (US$ Million) by Application, 2024 to 2034

Figure 221: East Asia Market Value (US$ Million) by End-use, 2024 to 2034

Figure 222: East Asia Market Value (US$ Million) by Country, 2024 to 2034

Figure 223: East Asia Market Value (US$ Million) Analysis by Country, 2019 to 2034

Figure 224: East Asia Market Volume (Units) Analysis by Country, 2019 to 2034

Figure 225: East Asia Market Value Share (%) and BPS Analysis by Country, 2024 to 2034

Figure 226: East Asia Market Y-o-Y Growth (%) Projections by Country, 2024 to 2034

Figure 227: East Asia Market Value (US$ Million) Analysis by Product Type, 2019 to 2034

Figure 228: East Asia Market Volume (Units) Analysis by Product Type, 2019 to 2034

Figure 229: East Asia Market Value Share (%) and BPS Analysis by Product Type, 2024 to 2034

Figure 230: East Asia Market Y-o-Y Growth (%) Projections by Product Type, 2024 to 2034

Figure 231: East Asia Market Value (US$ Million) Analysis by Loading Device, 2019 to 2034

Figure 232: East Asia Market Volume (Units) Analysis by Loading Device, 2019 to 2034

Figure 233: East Asia Market Value Share (%) and BPS Analysis by Loading Device, 2024 to 2034

Figure 234: East Asia Market Y-o-Y Growth (%) Projections by Loading Device, 2024 to 2034

Figure 235: East Asia Market Value (US$ Million) Analysis by Power Capacity, 2019 to 2034

Figure 236: East Asia Market Volume (Units) Analysis by Power Capacity, 2019 to 2034

Figure 237: East Asia Market Value Share (%) and BPS Analysis by Power Capacity, 2024 to 2034

Figure 238: East Asia Market Y-o-Y Growth (%) Projections by Power Capacity, 2024 to 2034

Figure 239: East Asia Market Value (US$ Million) Analysis by Application, 2019 to 2034

Figure 240: East Asia Market Volume (Units) Analysis by Application, 2019 to 2034

Figure 241: East Asia Market Value Share (%) and BPS Analysis by Application, 2024 to 2034

Figure 242: East Asia Market Y-o-Y Growth (%) Projections by Application, 2024 to 2034

Figure 243: East Asia Market Value (US$ Million) Analysis by End-use, 2019 to 2034

Figure 244: East Asia Market Volume (Units) Analysis by End-use, 2019 to 2034

Figure 245: East Asia Market Value Share (%) and BPS Analysis by End-use, 2024 to 2034

Figure 246: East Asia Market Y-o-Y Growth (%) Projections by End-use, 2024 to 2034

Figure 247: East Asia Market Attractiveness by Product Type, 2024 to 2034

Figure 248: East Asia Market Attractiveness by Loading Device, 2024 to 2034

Figure 249: East Asia Market Attractiveness by Power Capacity, 2024 to 2034

Figure 250: East Asia Market Attractiveness by Application, 2024 to 2034

Figure 251: East Asia Market Attractiveness by End-use, 2024 to 2034

Figure 252: East Asia Market Attractiveness by Country, 2024 to 2034

Figure 253: Middle East and Africa Market Value (US$ Million) by Product Type, 2024 to 2034

Figure 254: Middle East and Africa Market Value (US$ Million) by Loading Device, 2024 to 2034

Figure 255: Middle East and Africa Market Value (US$ Million) by Power Capacity, 2024 to 2034

Figure 256: Middle East and Africa Market Value (US$ Million) by Application, 2024 to 2034

Figure 257: Middle East and Africa Market Value (US$ Million) by End-use, 2024 to 2034

Figure 258: Middle East and Africa Market Value (US$ Million) by Country, 2024 to 2034

Figure 259: Middle East and Africa Market Value (US$ Million) Analysis by Country, 2019 to 2034

Figure 260: Middle East and Africa Market Volume (Units) Analysis by Country, 2019 to 2034

Figure 261: Middle East and Africa Market Value Share (%) and BPS Analysis by Country, 2024 to 2034

Figure 262: Middle East and Africa Market Y-o-Y Growth (%) Projections by Country, 2024 to 2034

Figure 263: Middle East and Africa Market Value (US$ Million) Analysis by Product Type, 2019 to 2034

Figure 264: Middle East and Africa Market Volume (Units) Analysis by Product Type, 2019 to 2034

Figure 265: Middle East and Africa Market Value Share (%) and BPS Analysis by Product Type, 2024 to 2034

Figure 266: Middle East and Africa Market Y-o-Y Growth (%) Projections by Product Type, 2024 to 2034

Figure 267: Middle East and Africa Market Value (US$ Million) Analysis by Loading Device, 2019 to 2034

Figure 268: Middle East and Africa Market Volume (Units) Analysis by Loading Device, 2019 to 2034

Figure 269: Middle East and Africa Market Value Share (%) and BPS Analysis by Loading Device, 2024 to 2034

Figure 270: Middle East and Africa Market Y-o-Y Growth (%) Projections by Loading Device, 2024 to 2034

Figure 271: Middle East and Africa Market Value (US$ Million) Analysis by Power Capacity, 2019 to 2034

Figure 272: Middle East and Africa Market Volume (Units) Analysis by Power Capacity, 2019 to 2034

Figure 273: Middle East and Africa Market Value Share (%) and BPS Analysis by Power Capacity, 2024 to 2034

Figure 274: Middle East and Africa Market Y-o-Y Growth (%) Projections by Power Capacity, 2024 to 2034

Figure 275: Middle East and Africa Market Value (US$ Million) Analysis by Application, 2019 to 2034

Figure 276: Middle East and Africa Market Volume (Units) Analysis by Application, 2019 to 2034

Figure 277: Middle East and Africa Market Value Share (%) and BPS Analysis by Application, 2024 to 2034

Figure 278: Middle East and Africa Market Y-o-Y Growth (%) Projections by Application, 2024 to 2034

Figure 279: Middle East and Africa Market Value (US$ Million) Analysis by End-use, 2019 to 2034

Figure 280: Middle East and Africa Market Volume (Units) Analysis by End-use, 2019 to 2034

Figure 281: Middle East and Africa Market Value Share (%) and BPS Analysis by End-use, 2024 to 2034

Figure 282: Middle East and Africa Market Y-o-Y Growth (%) Projections by End-use, 2024 to 2034

Figure 283: Middle East and Africa Market Attractiveness by Product Type, 2024 to 2034

Figure 284: Middle East and Africa Market Attractiveness by Loading Device, 2024 to 2034

Figure 285: Middle East and Africa Market Attractiveness by Power Capacity, 2024 to 2034

Figure 286: Middle East and Africa Market Attractiveness by Application, 2024 to 2034

Figure 287: Middle East and Africa Market Attractiveness by End-use, 2024 to 2034

Figure 288: Middle East and Africa Market Attractiveness by Country, 2024 to 2034

Recommendations

Industrial Automation

Advanced Energy Storage System Market

Published : January 2024

Industrial Automation

Absorption Chillers Market

Published : October 2022

Automotive

Turbofan Engines Market

Published : October 2022

Explore Industrial Automation Insights

View Reports