Men's Underwear Market
Market Insights on Men's Underwear covering sales outlook, demand forecast & up-to-date key trends
Men's Underwear Market by Material Type (Cotton, Wool, Silk, Polyester, Rayon, Linen, Nylon), Category (Regular Brief, Boxer Brief, Boxer Shorts, Trunks, Thongs), Sales Channel (Wholesalers/Distributors, Hypermarkets/ Supermarkets, Specialty Stores), Price Range, Size for 2021-2031
Men’s Underwear Market Snapshot
[300 Pages Report] As per newly released data by Future Market Insights (FMI), the demand in the men’s underwear market will grow at approximately ~4% CAGR between 2021 and 2031.
Attribute |
Details |
Men’s Underwear Market Size 2020 |
US$ ~10 Bn |
Value CAGR (2021-2031) |
~4% |
2020-2021 Year-Over-Year Growth |
~3% |
Men’s Underwear Market Top Players Share in 2021. |
~15%-20% |
In 2020, the overall sales of men’s underwear totalled US$ ~10 Bn .As per FMI, the men’s underwear market holds a share of ~1% in the overall apparel market.
Let us know your requirement to get
100% FREE customization
How Will Men’s Underwear Market Outlook for 2021-2031 Compare to 2016-2020?
The men’s underwear market is projected to exhibit a CAGR of over ~4% during the forecast period, owing to the rise in availability of a wide range of products based on designs and functionality such as regular wear and sportswear men’s underwear. Growing concerns among individuals regarding personal hygiene and cleanliness are driving the sales of men’s underwear.
Increasing awareness regarding health and fitness and personal hygiene among men is influencing them to spend on good quality undergarmets. Thanks to glittering promotional campaigns and endorsement by popular celebrities, sales within the men’s underwear market are consistently rise.
Apart from this, increasing disposable income, on-the-go lifestyle, improved living standards, and changing preferences of consumers will remain the chief growth drivers in the men’s underwear market.
According to FMI, the improving penetration of modern retail formats such as supermarkets, discount stores, and pharmacy stores is resulting in increasing product visibility. In addition to this, the availability of a large variety of products related to intimate apparel for men at discounted rates is fueling the online shopping trends, thus enabling the men’s underwear market growth.
Will the Growing Brand Preference Push Sales of Men’s Underwear?
The rising preferences for purchasing branded products owing to the growing disposable income has resulted in high demand for branded men’s underwear that offers premium fit and flexibility.
Moreover, major players in the market are investing in marketing their product line through various social media platforms and with celebrity endorsement, which will help companies create an impressive brand image thus gaining competitive edge and prospects for growing sales.
Find your sweet spots for generating winning opportunities in this market.
Talk to AnalystHow is Evolving Customer Lifestyle Helping Men’s Underwear Market Gain Traction?
The global men’s underwear market is likely to be driven by the evolving customer lifestyle and high participation of individuals in outdoor recreational activities, which can further lead to a rise in demand for flexible and supportive sports mens’s underwear.
Moreover, the growing participation of individuals in gym and various sports activities will encourage them to spend more on better quality apparel to perform their best. Against this backdrop the demand for more comfortable men’s underwear is expected to grow in the coming years.
Country-wise Insights
Why is Sales Increasing in the U.S. Men’s Underwear Market?
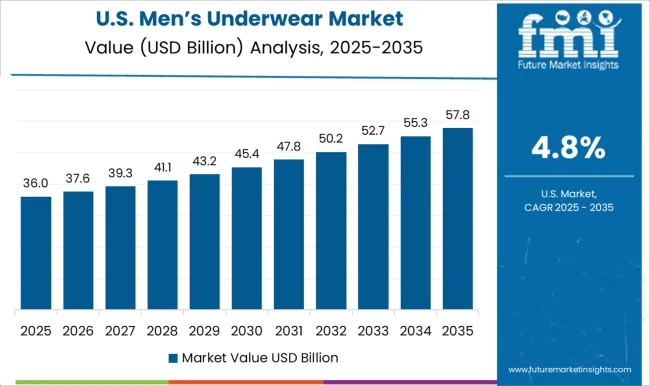
Within North America, the US is likely to dominate the men’s underwear industry. According to FMI, the demand for men’s underwear within the U.S. is expected to increase at a CAGR of over ~3% between 2021 and 2031.
The US men’s underwear market is highly competitive owing to the presence of a relatively high number of global and local intimate apparel manufacturers. The market is characterized by a high intensity of brand loyalty as customers look forward to fashionable and trendy men’s underwear. In addition, customers are generally reluctant to switch to newer brands emerging in the market.
Will Rising Awareness Regarding Health & Fitness Drive Men’s Underwear Sales in UK?
The men’s underwear market in the UK is projected to grow at a CAGR of over ~5%. Awareness regarding health and fitness among individuals to counter the prevalence of lifestyle concerns such as obesity, fluctuation of blood pressure, and others is rising.
As men in the UK increasingly focus on leading an active lifestyle, the demand for comfortable innerwear will rise to them to perform their best while participating in any physical activities. Moreover, the country has initiated its focus on HEPA (Health-enhancing physical activity) across sectors, which is enhancing the growth of fitness among individuals and is thus, driving the sales of men’s underwear.
Will Men’s Underwear Sales Grow in Thailand?
The men’s underwear market in Thailand is projected to register a CAGR of over ~3% during the forecast period. The development in the product line of men’s underwear, rise in the use of innovative and better fabrics that help reduce moisture and regulate temperature is helping the demand to grow in the country.
What is Supporting the UAE Men’s Underwear Market Growth?
The UAE is a highly lucrative market for the men’s underwear, majorly because of the presence of various global leading brands, who have adopted various growthstrategies in order to expand their business in the country. Moreover, the rising trend of online shopping among and the availability of high-quality retail spaces are creating opportunity for the players to grow their business drastically.

A unified Market Research Subscription Platform, built for today's disparate research needs.
Category-wise Insights
Which Material Type is Expected to Dominate the Men’s Underwear Market?
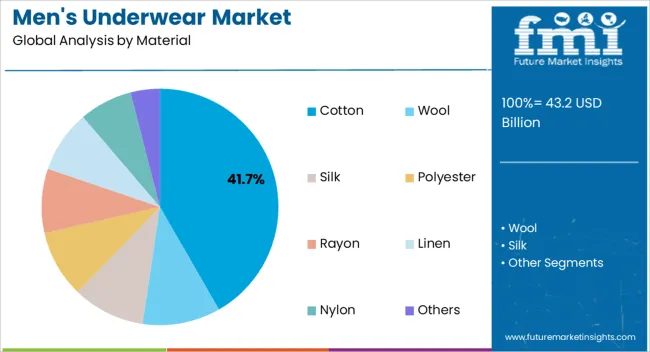
In terms of material type, cotton is likely to witness the highest demand among all. The segment is expected to register a CAGR of over ~2%. The reason behind such high interest for cotton underwear is attributable to the basic properties of cotton being highly comfortable, lightweight, soft and high absorbency against moisture that improves the overall feel.
What Category of Men’s Underwear holds the Maximum Share in the Market?
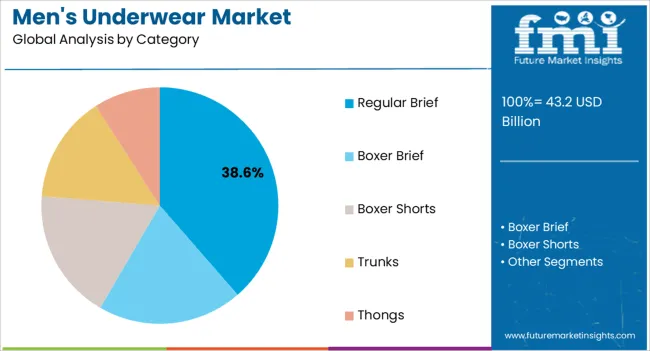
As per the analysis, the boxer briefs segment is expected to register a CAGR of over ~3% during the assessment period. The rising spending capacity, coupled with changing lifestyle of consumers are anticipated to fuel demand for boxer briefs during the forecast period.
What Size of Men’s Underwear Accounts for Maximum Sales?
On the basis of the size of men’s underwear, XXL is projected to be the fastest-growing size during the forecast period, exhibiting a CAGR of over ~5%. This is because of the rise in prevalence of obesity among individuals. Higher inclination for indoor activities and easy availability of a huge variety of food through doorstep delivery are affecting the health and fitness of an individual.
What Price-Range Underwears Will Account for Maximum Sales?
Men’s underwear ranging between US$ 10 – US$ 20 are projected to contribute maximum to the industry. The rise in the number of players in the industry and the growing interest of individuals for new designs, comfortability, and colors of men’s underwear is growing the competition and thus, players are launching products at an affordable rate with new designs to grow customer base and expand business globally.
Multi-brand Stores to Remain Preferred Sales Channel in Men’s Underwear Market
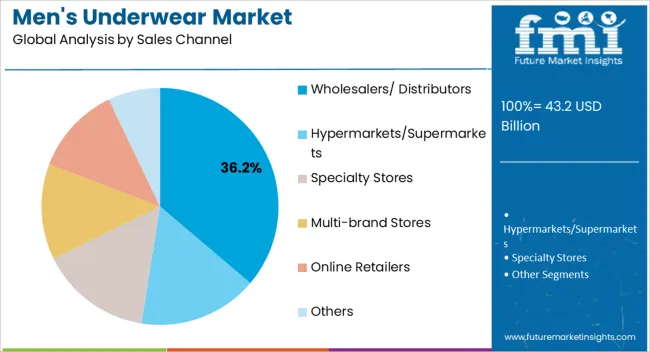
On the basis of sales channel, sales via multi-brand stores are likely to increase at a CAGR of ~3%, over the forecast period. Such stores provide a large variety of product lines to the customer and thus, help them pick the desired product.
Moreover, customers prefer to feel and understand the material of apparel before making a purchase, and such multi-brand stores provide them with the opportunity to select from various available brands.
Competitive Landscape
Leading players operating in the global men’s underwear market are highly driven by the evolving fashion industry and it has resulted in causing substantial changes in the apparel industry, further, driving sales in the men’s underwear market.
For instance:
- In 2017, Knobby Underwear launched an innovative quad stretch mesh fabric, which is a perfect blend of spandex and polymer. The unique characteristic of the product is the ultra-light and soft fabric that easily absorbs sweat and keeps the body fresh and cool.
- In 2021, Shark Tank menswear brand Buttercloth launched the new product line of first underwear with cooling icy cotton fabric. Along, with the world’s most comfortable shirt, the brand is expanding its product portfolio in redefining comfort and cool underwear.
Scope of Report
Attribute |
Details |
Forecast Period |
2021-2031 |
Historical Data Available for |
2016-2020 |
Market Analysis |
USD Million for Value |
Key Regions Covered |
North America, Latin America, Europe, East Asia, South Asia, Oceania, and MEA. |
Key Countries Covered |
US, Canada, Germany, U.K., France, Italy, Spain, Russia, China, Japan, South Korea, India, Thailand, Malaysia, Indonesia, Australia, New Zealand, GCC Countries, Turkey, Northern Africa, and South Africa. |
Key Segments Covered |
Material Type, Category, Size, Age Group, Price Range, Sales Channel, and Region. |
Key Companies Profiled |
|
Report Coverage |
Market Forecast, Company Share Analysis, Competition Intelligence, DROT Analysis, Market Dynamics and Challenges, and Strategic Growth Initiatives |
Customization & Pricing |
Available upon Request |
Frequently Asked Questions
The global men’s underwear market reached a valuation of US$ ~10 Bn in 2020.
The global men’s underwear market grew at ~3% CAGR between 2016 and 2020.
Focus on offering maximum comfort, new designs, and expansion of product offerings in men’s underwear is the key trend in the market.
Leading players operating in the global men’s underwear market comprise Phillips-Van Heusen Corporation, Ralph Lauren Corporation, Jockey International Inc., American Eagle Outfitters, Iconix Brand Group Inc., L.C. Penney Corporation Inc., and RibbedTee Company among others.
The East Asia men’s underwear market is projected to grow at ~3% CAGR over the forecast period.
Leading players in the global men’s underwear market are estimated to account for approximately ~15%-20% of the total market share.
The men’s underwear market in Europe holds a notable market share and is projected to expand with a CAGR of over ~2% in 2020, over the forecast period.
Table of Content
1. Executive Summary
1.1. Global Market Outlook
1.2. Demand Side Trends
1.3. Supply Side Trends
1.4. Material Evolution Analysis
1.5. FMI Analysis and Recommendations
2. Market Overview
2.1. Market Taxonomy
2.2. Market Definition
3. Key Market Trends
3.1. Key Trends Impacting In the Market
3.1.1. Popularity of Water Sports
3.1.2. Accessories As Add-Ons
3.1.3. Sustainability in Men’s Underwear
3.1.4. Rise in Demand for Fashionable Men’s Underwear
3.1.5. Luxury Brands Shift Their Attention to Asia
3.2. Material Innovation Trends
3.2.1. Development of Technology in Production
3.2.2. Companies Increasingly Spending on R&D and Stepping Up Innovation
3.2.3. Growing Consumer Interest in Multifunctional Materials
3.2.4. Prominent Players are Now Diversifying Into other Profitable Segments
3.2.5. Companies are Focusing on Strengthening the Premium Market Leadership
3.3. Future Prospects of Electronics Industry
3.3.1. Factors Fuelling Growth
3.3.2. Influx of Brands
3.3.3. Innovative Sales & Marketing Strategies
3.3.4. New Launches
4. Impact of Covid-19 on Market
4.1. Impact of Covid-19 on Industry
4.2. Sales Projection, Q1-Q4 2020 During Covid-19 Pandemic
4.3. Pre Covid-19 Market Forecast v/s Post covid-19 Market Forecast
5. Covid-19 Impact On Retail Industry
5.1. Coronavirus Impact Matrix
5.2. Consumers View Travel and Tourism as Having High Virus Risk
5.3. Sales Increased Dramatically Across Most Categories; Paper Materials, Home Care and Frozen Foods Spiked in all Countries
5.4. Europe Consumers Impact – Winning and Losing Segment Spending
5.5. Consumers Shifting Toward Spending Online Shopping
6. Brand Mapping Analysis
6.1. Price v/s Material
6.2. Value for Money
6.3. Top of Mind Brands
6.4. Brand Portfolio-by Key Players
6.5. Brand Loyalty Mapping
6.6. Consumer Spending Pattern Overview
7. Global Market Demand Analysis 2016-2020 and Forecast, 2021-2031
7.1. Historical Market Volume (Units) Analysis, 2016-2020
7.2. Current and Future Market Volume (Units) Projections, 2021-2031
7.2.1. Y-o-Y Growth Trend Analysis
7.2.2. Absolute $ Opportunity Analysis
8. Global Market- Pricing Analysis
8.1. Regional Pricing Analysis By Material Type
8.2. Pricing Break-up
8.2.1. Manufacturer Level Pricing
8.2.2. Distributor Level Pricing
8.3. Global Average Pricing Analysis Benchmark
9. Global Market Demand (in Value or Size in US$ Mn) Analysis 2016-2020 and Forecast, 2021-2031
9.1. Historical Market Value (US$ Mn) Analysis, 2016-2020
9.2. Current and Future Market Value (US$ Mn) Projections, 2021-2031
9.2.1. Y-o-Y Growth Trend Analysis
9.2.2. Absolute $ Opportunity Analysis
10. Market Background
10.1. Global Apparel Industry Outlook
10.2. Macro-Economic Factors
10.2.1. Global GDP Growth Outlook
10.2.2. Global Industry Value Added
10.2.3. Consumer Buying Behaviour Analysis
10.2.4. Global Consumer Spending Outlook
10.2.5. Global Manufacturing Industry Outlook
10.2.6. Retail Sector GVA and Growth
10.2.7. Primary Reasons For Visiting the Beach
10.2.8. Rise in Water Sports Activities Globally
10.3. Forecast Factors - Relevance & Impact
10.3.1. Top Companies Historical Growth
10.3.2. Increasing GDP Per Capita
10.3.3. Global Industry Production Outlook
10.3.4. Apparel Industry Contribution to GDP Outlook
10.3.5. Manufacturing Sector Gross Value Added
10.3.6. Urbanization Outlook
10.3.7. Consumer Price Index
10.4. Industry Value and Supply Chain Analysis
10.4.1. Profit Margin Analysis at each Sales point
10.4.2. List & role of key participants
10.4.2.1. Manufacturers
10.4.2.2. Distributors/Retailers
10.5. PESTLE Analysis of Market
10.6. Porter’s Five Force
10.7. Market Dynamics
10.7.1. Drivers
10.7.2. Restraints
10.7.3. Opportunity Analysis
11. Global Market Analysis 2016-2020 and Forecast 2021-2031, by Material Type
11.1. Introduction / Key Findings
11.2. Historical Market Size (US$ Mn) and Volume Analysis By Material Type, 2016 - 2020
11.3. Current and Future Market Size (US$ Mn) and Volume Analysis and Forecast By Material Type, 2021 - 2031
11.3.1. Cotton
11.3.2. Wool
11.3.3. Silk
11.3.4. Polyester
11.3.5. Rayon
11.3.6. Linen
11.3.7. Nylon
11.3.8. Others
11.4. Market Attractiveness Analysis By Material Type
12. Global Market Analysis 2016-2020 and Forecast 2021-2031, by Category
12.1. Introduction / Key Findings
12.2. Historical Market Size (US$ Mn) and Volume Analysis By Category, 2016 - 2020
12.3. Current and Future Market Size (US$ Mn) and Volume Analysis and Forecast By Category, 2021 - 2031
12.3.1. Regular Brief
12.3.2. Boxer Brief
12.3.3. Boxer Shorts
12.3.4. Trunks
12.3.5. Thongs
12.4. Market Attractiveness Analysis By Category
13. Global Market Analysis 2016-2020 and Forecast 2021-2031, by Size
13.1. Introduction / Key Findings
13.2. Historical Market Size (US$ Mn) and Volume Analysis By Size, 2016 - 2020
13.3. Current and Future Market Size (US$ Mn) and Volume Analysis and Forecast By Size, 2021 - 2031
13.3.1. XS
13.3.2. S
13.3.3. M
13.3.4. L
13.3.5. XL
13.3.6. XXL
13.3.7. XXXL
13.4. Market Attractiveness Analysis By Size
14. Global Market Analysis 2016-2020 and Forecast 2021-2031, by Age Group
14.1. Introduction / Key Findings
14.2. Historical Market Size (US$ Mn) and Volume Analysis By Age Group, 2016 - 2020
14.3. Current and Future Market Size (US$ Mn) and Volume Analysis and Forecast By Age Group, 2021 - 2031
14.3.1. 15-25
14.3.2. 26-35
14.3.3. 36-45
14.3.4. 46-55
14.3.5. 56-65
14.3.6. 65+
14.4. Market Attractiveness Analysis By Age Group
15. Global Market Analysis 2016-2020 and Forecast 2021-2031, by Price Range
15.1. Introduction / Key Findings
15.2. Historical Market Size (US$ Mn) and Volume Analysis By Price Range, 2016 - 2020
15.3. Current and Future Market Size (US$ Mn) and Volume Analysis and Forecast By Price Range, 2021 - 2031
15.3.1. Below US$10
15.3.2. US$ 10 - US$ 20
15.3.3. US$ 20 – US$ 30
15.3.4. US$ 30 & Above
15.4. Market Attractiveness Analysis By Price Range
16. Global Market Analysis 2016-2020 and Forecast 2021-2031, by Sales Channel
16.1. Introduction / Key Findings
16.2. Historical Market Size (US$ Mn) and Volume Analysis By Sales Channel, 2016 - 2020
16.3. Current and Future Market Size (US$ Mn) and Volume Analysis and Forecast By Sales Channel, 2021 – 2031
16.3.1. Wholesalers/ Distributors
16.3.2. Hypermarkets/Supermarkets
16.3.3. Specialty Stores
16.3.4. Multi-brand Stores
16.3.5. Online Retailers
16.3.6. Others
16.4. Market Attractiveness Analysis By Sales Channel
17. Global Market Analysis 2016-2020 and Forecast 2021-2031, by Region
17.1. Introduction
17.2. Historical Market Size (US$ Mn) and Volume Analysis By Region, 2016 - 2020
17.3. Current Market Size (US$ Mn) and Volume Analysis and Forecast By Region, 2021 - 2031
17.3.1. North America
17.3.2. Latin America
17.3.3. Europe
17.3.4. South Asia
17.3.5. East Asia
17.3.6. Oceania
17.3.7. Middle East & Africa
17.4. Market Attractiveness Analysis By Region
18. North America Market Analysis 2016-2020 and Forecast 2021-2031
18.1. Introduction
18.2. Pricing Analysis
18.3. Historical Market Size (US$ Mn) and Volume Trend Analysis By Market Taxonomy, 2016 - 2020
18.4. Market Size (US$ Mn) and Volume Forecast By Market Taxonomy, 2021 - 2031
18.4.1. By Country
18.4.1.1. U.S.
18.4.1.2. Canada
18.4.2. By Material Type
18.4.3. By Category
18.4.4. By Size
18.4.5. By Age Group
18.4.6. By Price Range
18.4.7. By Sales Channel
18.5. Market Attractiveness Analysis
18.5.1. By Country
18.5.2. By Material Type
18.5.3. By Category
18.5.4. By Size
18.5.5. By Age Group
18.5.6. By Price Range
18.5.7. By Sales Channel
18.6. Drivers and Restraints - Impact Analysis
19. Latin America Market 2016-2020 and Forecast 2021-2031
19.1. Introduction
19.2. Pricing Analysis
19.3. Historical Market Size (US$ Mn) Trend Analysis by Market Taxonomy, 2016 - 2020
19.4. Market Size (US$ Mn) Forecast by Market Taxonomy, 2021 - 2031
19.4.1. By Country
19.4.1.1. Brazil
19.4.1.2. Mexico
19.4.1.3. Argentina
19.4.1.4. Rest of Latin America
19.4.2. By Material Type
19.4.3. By Category
19.4.4. By Size
19.4.5. By Age Group
19.4.6. By Price Range
19.4.7. By Sales Channel
19.5. Market Attractiveness Analysis
19.5.1. By Country
19.5.2. By Material Type
19.5.3. By Category
19.5.4. By Size
19.5.5. By Age Group
19.5.6. By Price Range
19.5.7. By Sales Channel
19.6. Drivers and Restraints - Impact Analysis
20. Europe Market 2016-2020 and Forecast 2021-2031
20.1. Introduction
20.2. Pricing Analysis
20.3. Historical Market Size (US$ Mn) Trend Analysis by Market Taxonomy, 2016 - 2020
20.4. Market Size (US$ Mn) Forecast by Market Taxonomy, 2021 - 2031
20.4.1. By Country
20.4.1.1. Germany
20.4.1.2. Italy
20.4.1.3. France
20.4.1.4. U.K.
20.4.1.5. Spain
20.4.1.6. Russia
20.4.1.7. Rest of Europe
20.4.2. By Material Type
20.4.3. By Category
20.4.4. By Size
20.4.5. By Age Group
20.4.6. By Price Range
20.4.7. By Sales Channel
20.5. Market Attractiveness Analysis
20.5.1. By Country
20.5.2. By Material Type
20.5.3. By Category
20.5.4. By Size
20.5.5. By Age Group
20.5.6. By Price Range
20.5.7. By Sales Channel
20.6. Drivers and Restraints - Impact Analysis
21. South Asia Market Analysis 2016-2020 and Forecast 2021-2031
21.1. Introduction
21.2. Pricing Analysis
21.3. Historical Market Size (US$ Mn) and Volume Trend Analysis By Market Taxonomy, 2016 - 2020
21.4. Market Size (US$ Mn) and Volume Forecast By Market Taxonomy, 2021 - 2031
21.4.1. By Country
21.4.1.1. India
21.4.1.2. Thailand
21.4.1.3. Indonesia
21.4.1.4. Malaysia
21.4.1.5. Rest of South Asia
21.4.2. By Material Type
21.4.3. By Category
21.4.4. By Size
21.4.5. By Age Group
21.4.6. By Price Range
21.4.7. By Sales Channel
21.5. Market Attractiveness Analysis
21.5.1. By Country
21.5.2. By Material Type
21.5.3. By Category
21.5.4. By Size
21.5.5. By Age Group
21.5.6. By Price Range
21.5.7. By Sales Channel
21.6. Drivers and Restraints - Impact Analysis
22. East Asia Market Analysis 2016-2020 and Forecast 2021-2031
22.1. Introduction
22.2. Pricing Analysis
22.3. Historical Market Size (US$ Mn) and Volume Trend Analysis By Market Taxonomy, 2016 - 2020
22.4. Market Size (US$ Mn) and Volume Forecast By Market Taxonomy, 2021 - 2031
22.4.1. By Country
22.4.1.1. China
22.4.1.2. Japan
22.4.1.3. South Korea
22.4.2. By Material Type
22.4.3. By Category
22.4.4. By Size
22.4.5. By Age Group
22.4.6. By Price Range
22.4.7. By Sales Channel
22.5. Market Attractiveness Analysis
22.5.1. By Country
22.5.2. By Material Type
22.5.3. By Category
22.5.4. By Size
22.5.5. By Age Group
22.5.6. By Price Range
22.5.7. By Sales Channel
22.6. Drivers and Restraints - Impact Analysis
23. Oceania Market 2016-2020 and Forecast 2021-2031
23.1. Introduction
23.2. Pricing Analysis
23.3. Historical Market Size (US$ Mn) Trend Analysis by Market Taxonomy, 2016 - 2020
23.4. Market Size (US$ Mn) Forecast by Market Taxonomy, 2021 - 2031
23.4.1. By Country
23.4.1.1. Australia
23.4.1.2. New Zealand
23.4.2. By Material Type
23.4.3. By Category
23.4.4. By Size
23.4.5. By Age Group
23.4.6. By Price Range
23.4.7. By Sales Channel
23.5. Market Attractiveness Analysis
23.5.1. By Country
23.5.2. By Material Type
23.5.3. By Category
23.5.4. By Size
23.5.5. By Age Group
23.5.6. By Price Range
23.5.7. By Sales Channel
23.6. Drivers and Restraints - Impact Analysis
24. Middle East & Africa Market Analysis 2016-2020 and Forecast 2021-2031
24.1. Introduction
24.2. Pricing Analysis
24.3. Historical Market Size (US$ Mn) and Volume Trend Analysis By Market Taxonomy, 2016 - 2020
24.4. Market Size (US$ Mn) and Volume Forecast By Market Taxonomy, 2021 - 2031
24.4.1. By Country
24.4.1.1. GCC Countries
24.4.1.2. South Africa
24.4.1.3. Northern Africa
24.4.1.4. Rest of Middle East and Africa
24.4.2. By Material Type
24.4.3. By Category
24.4.4. By Size
24.4.5. By Age Group
24.4.6. By Price Range
24.4.7. By Sales Channel
24.5. Market Attractiveness Analysis
24.5.1. By Country
24.5.2. By Material Type
24.5.3. By Category
24.5.4. By Size
24.5.5. By Age Group
24.5.6. By Price Range
24.5.7. By Sales Channel
24.6. Drivers and Restraints - Impact Analysis
25. Market Structure Analysis
25.1. Market Analysis by Tier of Companies (Men’s Underwear)
25.2. Market Concentration
25.3. Market Share Analysis of Top Players
25.4. Market Presence Analysis
25.4.1. By Regional footprint of Players
25.4.2. Material foot print by Players
25.4.2.1. Channel Foot Print by Players
26. Competition Analysis
26.1. Competition Dashboard
26.2. Pricing Analysis by Competition
26.3. Competition Benchmarking
26.4. Competition Deep Dive
26.4.1. Hanesbrands Inc.
26.4.1.1. Overview
26.4.1.2. Material Portfolio
26.4.1.3. Profitability by Market Segments (Material/Channel/Region)
26.4.1.4. Sales Footprint
26.4.1.5. Strategy Overview
26.4.1.5.1. Marketing Strategy
26.4.1.5.2. Material Strategy
26.4.1.5.3. Channel Strategy
26.4.2. Philips-Van Heusen Corporation
26.4.2.1. Overview
26.4.2.2. Material Portfolio
26.4.2.3. Profitability by Market Segments (Material/Channel/Region)
26.4.2.4. Sales Footprint
26.4.2.5. Strategy Overview
26.4.2.5.1. Marketing Strategy
26.4.2.5.2. Material Strategy
26.4.2.5.3. Channel Strategy
26.4.3. Ralph Lauren Corporation
26.4.3.1. Overview
26.4.3.2. Material Portfolio
26.4.3.3. Profitability by Market Segments (Material/Channel/Region)
26.4.3.4. Sales Footprint
26.4.3.5. Strategy Overview
26.4.3.5.1. Marketing Strategy
26.4.3.5.2. Material Strategy
26.4.3.5.3. Channel Strategy
26.4.4. Jockey International Inc.
26.4.4.1. Overview
26.4.4.2. Material Portfolio
26.4.4.3. Profitability by Market Segments (Material/Channel/Region)
26.4.4.4. Sales Footprint
26.4.4.5. Strategy Overview
26.4.4.5.1. Marketing Strategy
26.4.4.5.2. Material Strategy
26.4.4.5.3. Channel Strategy
26.4.5. American Eagle Outfitters Inc
26.4.5.1. Overview
26.4.5.2. Material Portfolio
26.4.5.3. Profitability by Market Segments (Material/Channel/Region)
26.4.5.4. Sales Footprint
26.4.5.5. Strategy Overview
26.4.5.5.1. Marketing Strategy
26.4.5.5.2. Material Strategy
26.4.5.5.3. Channel Strategy
26.4.6. Iconix Brand Group Inc.
26.4.6.1. Overview
26.4.6.2. Material Portfolio
26.4.6.3. Profitability by Market Segments (Material/Channel/Region)
26.4.6.4. Sales Footprint
26.4.6.5. Strategy Overview
26.4.6.5.1. Marketing Strategy
26.4.6.5.2. Material Strategy
26.4.6.5.3. Channel Strategy
26.4.7. J.C. Penney Corporation Inc.
26.4.7.1. Overview
26.4.7.2. Material Portfolio
26.4.7.3. Profitability by Market Segments (Material/Channel/Region)
26.4.7.4. Sales Footprint
26.4.7.5. Strategy Overview
26.4.7.5.1. Marketing Strategy
26.4.7.5.2. Material Strategy
26.4.7.5.3. Channel Strategy
26.4.8. Under Armour, Inc.
26.4.8.1. Overview
26.4.8.2. Material Portfolio
26.4.8.3. Profitability by Market Segments (Material/Channel/Region)
26.4.8.4. Sales Footprint
26.4.8.5. Strategy Overview
26.4.8.5.1. Marketing Strategy
26.4.8.5.2. Material Strategy
26.4.8.5.3. Channel Strategy
26.4.9. RibbedTee Company
26.4.9.1. Overview
26.4.9.2. Material Portfolio
26.4.9.3. Profitability by Market Segments (Material/Channel/Region)
26.4.9.4. Sales Footprint
26.4.9.5. Strategy Overview
26.4.9.5.1. Marketing Strategy
26.4.9.5.2. Material Strategy
26.4.9.5.3. Channel Strategy
26.4.10. Ramblers Far, Inc.
26.4.10.1. Overview
26.4.10.2. Material Portfolio
26.4.10.3. Profitability by Market Segments (Material/Channel/Region)
26.4.10.4. Sales Footprint
26.4.10.5. Strategy Overview
26.4.10.5.1. Marketing Strategy
26.4.10.5.2. Material Strategy
26.4.10.5.3. Channel Strategy
26.4.11. Levi Strauss & Co.
26.4.11.1. Overview
26.4.11.2. Material Portfolio
26.4.11.3. Profitability by Market Segments (Material/Channel/Region)
26.4.11.4. Sales Footprint
26.4.11.5. Strategy Overview
26.4.11.5.1. Marketing Strategy
26.4.11.5.2. Material Strategy
26.4.11.5.3. Channel Strategy
26.4.12. Perry Ellis International Inc.
26.4.12.1. Overview
26.4.12.2. Material Portfolio
26.4.12.3. Profitability by Market Segments (Material/Channel/Region)
26.4.12.4. Sales Footprint
26.4.12.5. Strategy Overview
26.4.12.5.1. Marketing Strategy
26.4.12.5.2. Material Strategy
26.4.12.5.3. Channel Strategy
26.4.13. Naked Brand Group Inc.
26.4.13.1. Overview
26.4.13.2. Material Portfolio
26.4.13.3. Profitability by Market Segments (Material/Channel/Region)
26.4.13.4. Sales Footprint
26.4.13.5. Strategy Overview
26.4.13.5.1. Marketing Strategy
26.4.13.5.2. Material Strategy
26.4.13.5.3. Channel Strategy
26.4.14. Others (As Per Request)
26.4.14.1. Overview
26.4.14.2. Material Portfolio
26.4.14.3. Profitability by Market Segments (Material/Channel/Region)
26.4.14.4. Sales Footprint
26.4.14.5. Strategy Overview
26.4.14.5.1. Marketing Strategy
26.4.14.5.2. Material Strategy
26.4.14.5.3. Channel Strategy
27. Assumptions and Acronyms Used
28. Research Methodology
Let us know your requirement to get
100% FREE customization
List of Tables
Table 1: Global Market Value (US$ Mn) Forecast, By Material Type, 2016-2031
Table 2: Global Market Volume ('000 Units) Forecast, By Material Type, 2016-2031
Table 3: Global Market Value (US$ Mn) Forecast, By Category, 2016-2031
Table 4: Global Market Volume ('000 Units) Forecast, By Category, 2016-2031
Table 5: Global Market Value (US$ Mn) Forecast, By Age Group, 2016-2031
Table 6: Global Market Volume ('000 Units) Forecast, By Age Group, 2016-2031
Table 7: Global Market Value (US$ Mn) Forecast, By Price Range, 2016-2031
Table 8: Global Market Volume ('000 Units) Forecast, By Price Range, 2016-2031
Table 9: Global Market Value (US$ Mn) Forecast, By Sales Channel, 2016-2031
Table 10: Global Market Volume ('000 Units) Forecast, By Sales Channel, 2016-2031
Table 11: Global Market Value (US$ Mn) Forecast, By Region, 2016-2031
Table 12: Global Market Volume ('000 Units) Forecast, By Region, 2016-2031
Table 13: North America Market Value (US$ Mn) Forecast, By Material Type, 2016-2031
Table 14: North America Market Volume ('000 Units) Forecast, By Material Type, 2016-2031
Table 15: North America Market Value (US$ Mn) Forecast, By Category, 2016-2031
Table 16: North America Market Volume ('000 Units) Forecast, By Category, 2016-2031
Table 17: North America Market Value (US$ Mn) Forecast, By Age Group, 2016-2031
Table 18: North America Market Volume ('000 Units) Forecast, By Age Group, 2016-2031
Table 19: North America Market Value (US$ Mn) Forecast, By Price Range, 2016-2031
Table 20: North America Market Volume ('000 Units) Forecast, By Price Range, 2016-2031
Table 21: North America Market Value (US$ Mn) Forecast, By Sales Channel, 2016-2031
Table 22: North America Market Volume ('000 Units) Forecast, By Sales Channel, 2016-2031
Table 23: North America Market Value (US$ Mn) Forecast, By Country, 2016-2031
Table 24: North America Market Volume ('000 Units) Forecast, By Country, 2016-2031
Table 25: Latin America Market Value (US$ Mn) Forecast, By Material Type, 2016-2031
Table 26: Latin America Market Volume ('000 Units) Forecast, By Material Type, 2016-2031
Table 27: Latin America Market Value (US$ Mn) Forecast, By Category, 2016-2031
Table 28: Latin America Market Volume ('000 Units) Forecast, By Category, 2016-2031
Table 29: Latin America Market Value (US$ Mn) Forecast, By Age Group, 2016-2031
Table 30: Latin America Market Volume ('000 Units) Forecast, By Age Group, 2016-2031
Table 31: Latin America Market Value (US$ Mn) Forecast, By Price Range, 2016-2031
Table 32: Latin America Market Volume ('000 Units) Forecast, By Price Range, 2016-2031
Table 33: Latin America Market Value (US$ Mn) Forecast, By Sales Channel, 2016-2031
Table 34: Latin America Market Volume ('000 Units) Forecast, By Sales Channel, 2016-2031
Table 35: Latin America Market Value (US$ Mn) Forecast, By Country, 2016-2031
Table 36: Latin America Market Volume ('000 Units) Forecast, By Country, 2016-2031
Table 37: Europe Market Value (US$ Mn) Forecast, By Material Type, 2016-2031
Table 38: Europe Market Volume ('000 Units) Forecast, By Material Type, 2016-2031
Table 39: Europe Market Value (US$ Mn) Forecast, By Category, 2016-2031
Table 40: Europe Market Volume ('000 Units) Forecast, By Category, 2016-2031
Table 41: Europe Market Value (US$ Mn) Forecast, By Age Group, 2016-2031
Table 42: Europe Market Volume ('000 Units) Forecast, By Age Group, 2016-2031
Table 43: Europe Market Value (US$ Mn) Forecast, By Price Range, 2016-2031
Table 44: Europe Market Volume ('000 Units) Forecast, By Price Range, 2016-2031
Table 45: Europe Market Value (US$ Mn) Forecast, By Sales Channel, 2016-2031
Table 46: Europe Market Volume ('000 Units) Forecast, By Sales Channel, 2016-2031
Table 47: Europe Market Value (US$ Mn) Forecast, By Country, 2016-2031
Table 48: Europe Market Volume ('000 Units) Forecast, By Country, 2016-2031
Table 49: South Asia Market Value (US$ Mn) Forecast, By Material Type, 2016-2031
Table 50: South Asia Market Volume ('000 Units) Forecast, By Material Type, 2016-2031
Table 51: South Asia Market Value (US$ Mn) Forecast, By Category, 2016-2031
Table 52: South Asia Market Volume ('000 Units) Forecast, By Category, 2016-2031
Table 53: South Asia Market Value (US$ Mn) Forecast, By Age Group, 2016-2031
Table 54: South Asia Market Volume ('000 Units) Forecast, By Age Group, 2016-2031
Table 55: South Asia Market Value (US$ Mn) Forecast, By Price Range, 2016-2031
Table 56: South Asia Market Volume ('000 Units) Forecast, By Price Range, 2016-2031
Table 57: South Asia Market Value (US$ Mn) Forecast, By Sales Channel, 2016-2031
Table 58: South Asia Market Volume ('000 Units) Forecast, By Sales Channel, 2016-2031
Table 59: South Asia Market Value (US$ Mn) Forecast, By Country, 2016-2031
Table 60: South Asia Market Volume ('000 Units) Forecast, By Country, 2016-2031
Table 61: East Asia Market Value (US$ Mn) Forecast, By Material Type, 2016-2031
Table 62: East Asia Market Volume ('000 Units) Forecast, By Material Type, 2016-2031
Table 63: East Asia Market Value (US$ Mn) Forecast, By Category, 2016-2031
Table 64: East Asia Market Volume ('000 Units) Forecast, By Category, 2016-2031
Table 65: East Asia Market Value (US$ Mn) Forecast, By Age Group, 2016-2031
Table 66: East Asia Market Volume ('000 Units) Forecast, By Age Group, 2016-2031
Table 67: East Asia Market Value (US$ Mn) Forecast, By Price Range, 2016-2031
Table 68: East Asia Market Volume ('000 Units) Forecast, By Price Range, 2016-2031
Table 69: East Asia Market Value (US$ Mn) Forecast, By Sales Channel, 2016-2031
Table 70: East Asia Market Volume ('000 Units) Forecast, By Sales Channel, 2016-2031
Table 71: East Asia Market Value (US$ Mn) Forecast, By Country, 2016-2031
Table 72: East Asia Market Volume ('000 Units) Forecast, By Country, 2016-2031
Table 73: Oceania Market Value (US$ Mn) Forecast, By Material Type, 2016-2031
Table 74: Oceania Market Volume ('000 Units) Forecast, By Material Type, 2016-2031
Table 75: Oceania Market Value (US$ Mn) Forecast, By Category, 2016-2031
Table 76: Oceania Market Volume ('000 Units) Forecast, By Category, 2016-2031
Table 77: Oceania Market Value (US$ Mn) Forecast, By Age Group, 2016-2031
Table 78: Oceania Market Volume ('000 Units) Forecast, By Age Group, 2016-2031
Table 79: Oceania Market Value (US$ Mn) Forecast, By Price Range, 2016-2031
Table 80: Oceania Market Volume ('000 Units) Forecast, By Price Range, 2016-2031
Table 81: Oceania Market Value (US$ Mn) Forecast, By Sales Channel, 2016-2031
Table 82: Oceania Market Volume ('000 Units) Forecast, By Sales Channel, 2016-2031
Table 83: Oceania Market Value (US$ Mn) Forecast, By Country, 2016-2031
Table 84: Oceania Market Volume ('000 Units) Forecast, By Country, 2016-2031
Table 85: Middle East and Africa Market Value (US$ Mn) Forecast, By Material Type, 2016-2031
Table 86: Middle East and Africa Market Volume ('000 Units) Forecast, By Material Type, 2016-2031
Table 87: Middle East and Africa Market Value (US$ Mn) Forecast, By Category, 2016-2031
Table 88: Middle East and Africa Market Volume ('000 Units) Forecast, By Category, 2016-2031
Table 89: Middle East and Africa Market Value (US$ Mn) Forecast, By Age Group, 2016-2031
Table 90: Middle East and Africa Market Volume ('000 Units) Forecast, By Age Group, 2016-2031
Table 91: Middle East and Africa Market Value (US$ Mn) Forecast, By Price Range, 2016-2031
Table 92: Middle East and Africa Market Volume ('000 Units) Forecast, By Price Range, 2016-2031
Table 93: Middle East and Africa Market Value (US$ Mn) Forecast, By Sales Channel, 2016-2031
Table 94: Middle East and Africa Market Volume ('000 Units) Forecast, By Sales Channel, 2016-2031
Table 95: Middle East and Africa Market Value (US$ Mn) Forecast, By Country, 2016-2031
Table 96: Middle East and Africa Market Volume ('000 Units) Forecast, By Country, 2016-2031
Find your sweet spots for generating winning opportunities in this market.
Talk to AnalystList of Charts
Figure 1: Global Market Value (US$ Mn) and Volume ('000 Units) Analysis, 2016-2020
Figure 2: Global Market Value (US$ Mn) and Volume ('000 Units) Forecast, 2021-2031
Figure 3: Global Market Analysis, 2016-2020
Figure 4: Global Market Forecast, 2021-2031
Figure 5: Global Market Absolute $ Opportunity Value (US$ Mn), 2021-2031
Figure 6: Global Market Value (US$ Mn) Analysis, By Material Type, 2016-2031
Figure 7: Global Market Volume ('000 Units) Analysis, By Material Type, 2016-2031
Figure 8: Global Market Share and BPS Analysis, By Material Type, 2021 & 2031
Figure 9: Global Market Y-o-Y Growth (%) Projections, By Material Type, 2021-2031
Figure 10: Global Market Attractiveness, By Material Type, 2016-2031
Figure 11: Global Market Value (US$ Mn) Analysis, By Category, 2016-2031
Figure 12: Global Market Volume ('000 Units) Analysis, By Category, 2016-2031
Figure 13: Global Market Share and BPS Analysis, By Category, 2021 & 2031
Figure 14: Global Market Y-o-Y Growth (%) Projections, By Category, 2021-2031
Figure 15: Global Market Attractiveness, By Category, 2016-2031
Figure 16: Global Market Value (US$ Mn) Analysis, By Age Group, 2016-2031
Figure 17: Global Market Volume ('000 Units) Analysis, By Age Group, 2016-2031
Figure 18: Global Market Share and BPS Analysis, By Age Group, 2021 & 2031
Figure 19: Global Market Y-o-Y Growth (%) Projections, By Age Group, 2021-2031
Figure 20: Global Market Attractiveness, By Age Group, 2016-2031
Figure 21: Global Market Value (US$ Mn) Analysis, By Price Range, 2016-2031
Figure 22: Global Market Volume ('000 Units) Analysis, By Price Range, 2016-2031
Figure 23: Global Market Share and BPS Analysis, By Price Range, 2021 & 2031
Figure 24: Global Market Y-o-Y Growth (%) Projections, By Price Range, 2021-2031
Figure 25: Global Market Attractiveness, By Price Range, 2016-2031
Figure 26: Global Market Value (US$ Mn) Analysis, By Sales Channel, 2016-2031
Figure 27: Global Market Volume ('000 Units) Analysis, By Sales Channel, 2016-2031
Figure 28: Global Market Share and BPS Analysis, By Sales Channel, 2021 & 2031
Figure 29: Global Market Y-o-Y Growth (%) Projections, By Sales Channel, 2021-2031
Figure 30: Global Market Attractiveness, By Sales Channel, 2016-2031
Figure 31: Global Market Value (US$ Mn) Analysis, By Region, 2016-2031
Figure 32: Global Market Volume ('000 Units) Analysis, By Region, 2016-2031
Figure 33: Global Market Share and BPS Analysis, By Region, 2021 & 2031
Figure 34: Global Market Y-o-Y Growth (%) Projections, By Region, 2021-2031
Figure 35: Global Market Attractiveness, By Region, 2016-2031
Figure 36: North America Market Value (US$ Mn) Analysis, By Material Type, 2016-2031
Figure 37: North America Market Volume ('000 Units) Analysis, By Material Type, 2016-2031
Figure 38: North America Market Share and BPS Analysis, By Material Type, 2021 & 2031
Figure 39: North America Market Y-o-Y Growth (%) Projections, By Material Type, 2021-2031
Figure 40: North America Market Attractiveness, By Material Type, 2016-2031
Figure 41: North America Market Value (US$ Mn) Analysis, By Category, 2016-2031
Figure 42: North America Market Volume ('000 Units) Analysis, By Category, 2016-2031
Figure 43: North America Market Share and BPS Analysis, By Category, 2021 & 2031
Figure 44: North America Market Y-o-Y Growth (%) Projections, By Category, 2021-2031
Figure 45: North America Market Attractiveness, By Category, 2016-2031
Figure 46: North America Market Value (US$ Mn) Analysis, By Age Group, 2016-2031
Figure 47: North America Market Volume ('000 Units) Analysis, By Age Group, 2016-2031
Figure 48: North America Market Share and BPS Analysis, By Age Group, 2021 & 2031
Figure 49: North America Market Y-o-Y Growth (%) Projections, By Age Group, 2021-2031
Figure 50: North America Market Attractiveness, By Age Group, 2016-2031
Figure 51: North America Market Value (US$ Mn) Analysis, By Price Range, 2016-2031
Figure 52: North America Market Volume ('000 Units) Analysis, By Price Range, 2016-2031
Figure 53: North America Market Share and BPS Analysis, By Price Range, 2021 & 2031
Figure 54: North America Market Y-o-Y Growth (%) Projections, By Price Range, 2021-2031
Figure 55: North America Market Attractiveness, By Price Range, 2016-2031
Figure 56: North America Market Value (US$ Mn) Analysis, By Sales Channel, 2016-2031
Figure 57: North America Market Volume ('000 Units) Analysis, By Sales Channel, 2016-2031
Figure 58: North America Market Share and BPS Analysis, By Sales Channel, 2021 & 2031
Figure 59: North America Market Y-o-Y Growth (%) Projections, By Sales Channel, 2021-2031
Figure 60: North America Market Attractiveness, By Sales Channel, 2016-2031
Figure 61: North America Market Value (US$ Mn) Analysis, By Country, 2016-2031
Figure 62: North America Market Volume ('000 Units) Analysis, By Country, 2016-2031
Figure 63: North America Market Share and BPS Analysis, By Country, 2021 & 2031
Figure 64: North America Market Y-o-Y Growth (%) Projections, By Country, 2021-2031
Figure 65: North America Market Attractiveness, By Country, 2016-2031
Figure 66: Latin America Market Value (US$ Mn) Analysis, By Material Type, 2016-2031
Figure 67: Latin America Market Volume ('000 Units) Analysis, By Material Type, 2016-2031
Figure 68: Latin America Market Share and BPS Analysis, By Material Type, 2021 & 2031
Figure 69: Latin America Market Y-o-Y Growth (%) Projections, By Material Type, 2021-2031
Figure 70: Latin America Market Attractiveness, By Material Type, 2016-2031
Figure 71: Latin America Market Value (US$ Mn) Analysis, By Category, 2016-2031
Figure 72: Latin America Market Volume ('000 Units) Analysis, By Category, 2016-2031
Figure 73: Latin America Market Share and BPS Analysis, By Category, 2021 & 2031
Figure 74: Latin America Market Y-o-Y Growth (%) Projections, By Category, 2021-2031
Figure 75: Latin America Market Attractiveness, By Category, 2016-2031
Figure 76: Latin America Market Value (US$ Mn) Analysis, By Age Group, 2016-2031
Figure 77: Latin America Market Volume ('000 Units) Analysis, By Age Group, 2016-2031
Figure 78: Latin America Market Share and BPS Analysis, By Age Group, 2021 & 2031
Figure 79: Latin America Market Y-o-Y Growth (%) Projections, By Age Group, 2021-2031
Figure 80: Latin America Market Attractiveness, By Age Group, 2016-2031
Figure 81: Latin America Market Value (US$ Mn) Analysis, By Price Range, 2016-2031
Figure 82: Latin America Market Volume ('000 Units) Analysis, By Price Range, 2016-2031
Figure 83: Latin America Market Share and BPS Analysis, By Price Range, 2021 & 2031
Figure 84: Latin America Market Y-o-Y Growth (%) Projections, By Price Range, 2021-2031
Figure 85: Latin America Market Attractiveness, By Price Range, 2016-2031
Figure 86: Latin America Market Value (US$ Mn) Analysis, By Sales Channel, 2016-2031
Figure 87: Latin America Market Volume ('000 Units) Analysis, By Sales Channel, 2016-2031
Figure 88: Latin America Market Share and BPS Analysis, By Sales Channel, 2021 & 2031
Figure 89: Latin America Market Y-o-Y Growth (%) Projections, By Sales Channel, 2021-2031
Figure 90: Latin America Market Attractiveness, By Sales Channel, 2016-2031
Figure 91: Latin America Market Value (US$ Mn) Analysis, By Country, 2016-2031
Figure 92: Latin America Market Volume ('000 Units) Analysis, By Country, 2016-2031
Figure 93: Latin America Market Share and BPS Analysis, By Country, 2021 & 2031
Figure 94: Latin America Market Y-o-Y Growth (%) Projections, By Country, 2021-2031
Figure 95: Latin America Market Attractiveness, By Country, 2016-2031
Figure 96: Europe Market Value (US$ Mn) Analysis, By Material Type, 2016-2031
Figure 97: Europe Market Volume ('000 Units) Analysis, By Material Type, 2016-2031
Figure 98: Europe Market Share and BPS Analysis, By Material Type, 2021 & 2031
Figure 99: Europe Market Y-o-Y Growth (%) Projections, By Material Type, 2021-2031
Figure 100: Europe Market Attractiveness, By Material Type, 2016-2031
Figure 101: Europe Market Value (US$ Mn) Analysis, By Category, 2016-2031
Figure 102: Europe Market Volume ('000 Units) Analysis, By Category, 2016-2031
Figure 103: Europe Market Share and BPS Analysis, By Category, 2021 & 2031
Figure 104: Europe Market Y-o-Y Growth (%) Projections, By Category, 2021-2031
Figure 105: Europe Market Attractiveness, By Category, 2016-2031
Figure 106: Europe Market Value (US$ Mn) Analysis, By Age Group, 2016-2031
Figure 107: Europe Market Volume ('000 Units) Analysis, By Age Group, 2016-2031
Figure 108: Europe Market Share and BPS Analysis, By Age Group, 2021 & 2031
Figure 109: Europe Market Y-o-Y Growth (%) Projections, By Age Group, 2021-2031
Figure 110: Europe Market Attractiveness, By Age Group, 2016-2031
Figure 111: Europe Market Value (US$ Mn) Analysis, By Price Range, 2016-2031
Figure 112: Europe Market Volume ('000 Units) Analysis, By Price Range, 2016-2031
Figure 113: Europe Market Share and BPS Analysis, By Price Range, 2021 & 2031
Figure 114: Europe Market Y-o-Y Growth (%) Projections, By Price Range, 2021-2031
Figure 115: Europe Market Attractiveness, By Price Range, 2016-2031
Figure 116: Europe Market Value (US$ Mn) Analysis, By Sales Channel, 2016-2031
Figure 117: Europe Market Volume ('000 Units) Analysis, By Sales Channel, 2016-2031
Figure 118: Europe Market Share and BPS Analysis, By Sales Channel, 2021 & 2031
Figure 119: Europe Market Y-o-Y Growth (%) Projections, By Sales Channel, 2021-2031
Figure 120: Europe Market Attractiveness, By Sales Channel, 2016-2031
Figure 121: Europe Market Value (US$ Mn) Analysis, By Country, 2016-2031
Figure 122: Europe Market Volume ('000 Units) Analysis, By Country, 2016-2031
Figure 123: Europe Market Share and BPS Analysis, By Country, 2021 & 2031
Figure 124: Europe Market Y-o-Y Growth (%) Projections, By Country, 2021-2031
Figure 125: Europe Market Attractiveness, By Country, 2016-2031
Figure 126: South Asia Market Value (US$ Mn) Analysis, By Material Type, 2016-2031
Figure 127: South Asia Market Volume ('000 Units) Analysis, By Material Type, 2016-2031
Figure 128: South Asia Market Share and BPS Analysis, By Material Type, 2021 & 2031
Figure 129: South Asia Market Y-o-Y Growth (%) Projections, By Material Type, 2021-2031
Figure 130: South Asia Market Attractiveness, By Material Type, 2016-2031
Figure 131: South Asia Market Value (US$ Mn) Analysis, By Category, 2016-2031
Figure 132: South Asia Market Volume ('000 Units) Analysis, By Category, 2016-2031
Figure 133: South Asia Market Share and BPS Analysis, By Category, 2021 & 2031
Figure 134: South Asia Market Y-o-Y Growth (%) Projections, By Category, 2021-2031
Figure 135: South Asia Market Attractiveness, By Category, 2016-2031
Figure 136: South Asia Market Value (US$ Mn) Analysis, By Age Group, 2016-2031
Figure 137: South Asia Market Volume ('000 Units) Analysis, By Age Group, 2016-2031
Figure 138: South Asia Market Share and BPS Analysis, By Age Group, 2021 & 2031
Figure 139: South Asia Market Y-o-Y Growth (%) Projections, By Age Group, 2021-2031
Figure 140: South Asia Market Attractiveness, By Age Group, 2016-2031
Figure 141: South Asia Market Value (US$ Mn) Analysis, By Price Range, 2016-2031
Figure 142: South Asia Market Volume ('000 Units) Analysis, By Price Range, 2016-2031
Figure 143: South Asia Market Share and BPS Analysis, By Price Range, 2021 & 2031
Figure 144: South Asia Market Y-o-Y Growth (%) Projections, By Price Range, 2021-2031
Figure 145: South Asia Market Attractiveness, By Price Range, 2016-2031
Figure 146: South Asia Market Value (US$ Mn) Analysis, By Sales Channel, 2016-2031
Figure 147: South Asia Market Volume ('000 Units) Analysis, By Sales Channel, 2016-2031
Figure 148: South Asia Market Share and BPS Analysis, By Sales Channel, 2021 & 2031
Figure 149: South Asia Market Y-o-Y Growth (%) Projections, By Sales Channel, 2021-2031
Figure 150: South Asia Market Attractiveness, By Sales Channel, 2016-2031
Figure 151: South Asia Market Value (US$ Mn) Analysis, By Country, 2016-2031
Figure 152: South Asia Market Volume ('000 Units) Analysis, By Country, 2016-2031
Figure 153: South Asia Market Share and BPS Analysis, By Country, 2021 & 2031
Figure 154: South Asia Market Y-o-Y Growth (%) Projections, By Country, 2021-2031
Figure 155: South Asia Market Attractiveness, By Country, 2016-2031
Figure 156: East Asia Market Value (US$ Mn) Analysis, By Material Type, 2016-2031
Figure 157: East Asia Market Volume ('000 Units) Analysis, By Material Type, 2016-2031
Figure 158: East Asia Market Share and BPS Analysis, By Material Type, 2021 & 2031
Figure 159: East Asia Market Y-o-Y Growth (%) Projections, By Material Type, 2021-2031
Figure 160: East Asia Market Attractiveness, By Material Type, 2016-2031
Figure 161: East Asia Market Value (US$ Mn) Analysis, By Category, 2016-2031
Figure 162: East Asia Market Volume ('000 Units) Analysis, By Category, 2016-2031
Figure 163: East Asia Market Share and BPS Analysis, By Category, 2021 & 2031
Figure 164: East Asia Market Y-o-Y Growth (%) Projections, By Category, 2021-2031
Figure 165: East Asia Market Attractiveness, By Category, 2016-2031
Figure 166: East Asia Market Value (US$ Mn) Analysis, By Age Group, 2016-2031
Figure 167: East Asia Market Volume ('000 Units) Analysis, By Age Group, 2016-2031
Figure 168: East Asia Market Share and BPS Analysis, By Age Group, 2021 & 2031
Figure 169: East Asia Market Y-o-Y Growth (%) Projections, By Age Group, 2021-2031
Figure 170: East Asia Market Attractiveness, By Age Group, 2016-2031
Figure 171: East Asia Market Value (US$ Mn) Analysis, By Price Range, 2016-2031
Figure 172: East Asia Market Volume ('000 Units) Analysis, By Price Range, 2016-2031
Figure 173: East Asia Market Share and BPS Analysis, By Price Range, 2021 & 2031
Figure 174: East Asia Market Y-o-Y Growth (%) Projections, By Price Range, 2021-2031
Figure 175: East Asia Market Attractiveness, By Price Range, 2016-2031
Figure 176: East Asia Market Value (US$ Mn) Analysis, By Sales Channel, 2016-2031
Figure 177: East Asia Market Volume ('000 Units) Analysis, By Sales Channel, 2016-2031
Figure 178: East Asia Market Share and BPS Analysis, By Sales Channel, 2021 & 2031
Figure 179: East Asia Market Y-o-Y Growth (%) Projections, By Sales Channel, 2021-2031
Figure 180: East Asia Market Attractiveness, By Sales Channel, 2016-2031
Figure 181: East Asia Market Value (US$ Mn) Analysis, By Country, 2016-2031
Figure 182: East Asia Market Volume ('000 Units) Analysis, By Country, 2016-2031
Figure 183: East Asia Market Share and BPS Analysis, By Country, 2021 & 2031
Figure 184: East Asia Market Y-o-Y Growth (%) Projections, By Country, 2021-2031
Figure 185: East Asia Market Attractiveness, By Country, 2016-2031
Figure 186: Oceania Market Value (US$ Mn) Analysis, By Material Type, 2016-2031
Figure 187: Oceania Market Volume ('000 Units) Analysis, By Material Type, 2016-2031
Figure 188: Oceania Market Share and BPS Analysis, By Material Type, 2021 & 2031
Figure 189: Oceania Market Y-o-Y Growth (%) Projections, By Material Type, 2021-2031
Figure 190: Oceania Market Attractiveness, By Material Type, 2016-2031
Figure 191: Oceania Market Value (US$ Mn) Analysis, By Category, 2016-2031
Figure 192: Oceania Market Volume ('000 Units) Analysis, By Category, 2016-2031
Figure 193: Oceania Market Share and BPS Analysis, By Category, 2021 & 2031
Figure 194: Oceania Market Y-o-Y Growth (%) Projections, By Category, 2021-2031
Figure 195: Oceania Market Attractiveness, By Category, 2016-2031
Figure 196: Oceania Market Value (US$ Mn) Analysis, By Age Group, 2016-2031
Figure 197: Oceania Market Volume ('000 Units) Analysis, By Age Group, 2016-2031
Figure 198: Oceania Market Share and BPS Analysis, By Age Group, 2021 & 2031
Figure 199: Oceania Market Y-o-Y Growth (%) Projections, By Age Group, 2021-2031
Figure 200: Oceania Market Attractiveness, By Age Group, 2016-2031
Figure 201: Oceania Market Value (US$ Mn) Analysis, By Price Range, 2016-2031
Figure 202: Oceania Market Volume ('000 Units) Analysis, By Price Range, 2016-2031
Figure 203: Oceania Market Share and BPS Analysis, By Price Range, 2021 & 2031
Figure 204: Oceania Market Y-o-Y Growth (%) Projections, By Price Range, 2021-2031
Figure 205: Oceania Market Attractiveness, By Price Range, 2016-2031
Figure 206: Oceania Market Value (US$ Mn) Analysis, By Sales Channel, 2016-2031
Figure 207: Oceania Market Volume ('000 Units) Analysis, By Sales Channel, 2016-2031
Figure 208: Oceania Market Share and BPS Analysis, By Sales Channel, 2021 & 2031
Figure 209: Oceania Market Y-o-Y Growth (%) Projections, By Sales Channel, 2021-2031
Figure 210: Oceania Market Attractiveness, By Sales Channel, 2016-2031
Figure 211: Oceania Market Value (US$ Mn) Analysis, By Country, 2016-2031
Figure 212: Oceania Market Volume ('000 Units) Analysis, By Country, 2016-2031
Figure 213: Oceania Market Share and BPS Analysis, By Country, 2021 & 2031
Figure 214: Oceania Market Y-o-Y Growth (%) Projections, By Country, 2021-2031
Figure 215: Oceania Market Attractiveness, By Country, 2016-2031
Figure 216: Middle East and Africa Market Value (US$ Mn) Analysis, By Material Type, 2016-2031
Figure 217: Middle East and Africa Market Volume ('000 Units) Analysis, By Material Type, 2016-2031
Figure 218: Middle East and Africa Market Share and BPS Analysis, By Material Type, 2021 & 2031
Figure 219: Middle East and Africa Market Y-o-Y Growth (%) Projections, By Material Type, 2021-2031
Figure 220: Middle East and Africa Market Attractiveness, By Material Type, 2016-2031
Figure 221: Middle East and Africa Market Value (US$ Mn) Analysis, By Category, 2016-2031
Figure 222: Middle East and Africa Market Volume ('000 Units) Analysis, By Category, 2016-2031
Figure 223: Middle East and Africa Market Share and BPS Analysis, By Category, 2021 & 2031
Figure 224: Middle East and Africa Market Y-o-Y Growth (%) Projections, By Category, 2021-2031
Figure 225: Middle East and Africa Market Attractiveness, By Category, 2016-2031
Figure 226: Middle East and Africa Market Value (US$ Mn) Analysis, By Age Group, 2016-2031
Figure 227: Middle East and Africa Market Volume ('000 Units) Analysis, By Age Group, 2016-2031
Figure 228: Middle East and Africa Market Share and BPS Analysis, By Age Group, 2021 & 2031
Figure 229: Middle East and Africa Market Y-o-Y Growth (%) Projections, By Age Group, 2021-2031
Figure 230: Middle East and Africa Market Attractiveness, By Age Group, 2016-2031
Figure 231: Middle East and Africa Market Value (US$ Mn) Analysis, By Price Range, 2016-2031
Figure 232: Middle East and Africa Market Volume ('000 Units) Analysis, By Price Range, 2016-2031
Figure 233: Middle East and Africa Market Share and BPS Analysis, By Price Range, 2021 & 2031
Figure 234: Middle East and Africa Market Y-o-Y Growth (%) Projections, By Price Range, 2021-2031
Figure 235: Middle East and Africa Market Attractiveness, By Price Range, 2016-2031
Figure 236: Middle East and Africa Market Value (US$ Mn) Analysis, By Sales Channel, 2016-2031
Figure 237: Middle East and Africa Market Volume ('000 Units) Analysis, By Sales Channel, 2016-2031
Figure 238: Middle East and Africa Market Share and BPS Analysis, By Sales Channel, 2021 & 2031
Figure 239: Middle East and Africa Market Y-o-Y Growth (%) Projections, By Sales Channel, 2021-2031
Figure 240: Middle East and Africa Market Attractiveness, By Sales Channel, 2016-2031
Figure 241: Middle East and Africa Market Value (US$ Mn) Analysis, By Country, 2016-2031
Figure 242: Middle East and Africa Market Volume ('000 Units) Analysis, By Country, 2016-2031
Figure 243: Middle East and Africa Market Share and BPS Analysis, By Country, 2021 & 2031
Figure 244: Middle East and Africa Market Y-o-Y Growth (%) Projections, By Country, 2021-2031
Figure 245: Middle East and Africa Market Attractiveness, By Country, 2016-2031
Need specific information?
Request CustomizationExplore Consumer Product Insights
View Reports