Reports

- Global Locations -

Headquarters

Future Market Insights, Inc.

Christiana Corporate, 200
Continental Drive, Suite 401,
Newark, Delaware - 19713,
United States

T: +1-845-579-5705

Americas

Future Market Insights, Inc.

616 Corporate Way, Suite 2-9018,
Valley Cottage, NY 10989, United States

T: +1-347-918-3531

MEA

Future Market Insights

1602-6 Jumeirah Bay X2 Tower, Plot No: JLT-PH2-X2A,
Jumeirah Lakes Towers, Dubai,
United Arab Emirates

Europe

Future Market Insights

3rd Floor, 207 Regent Street,
W1B 3HH London
United Kingdom

T: + 44 (0) 20 8123 9659
D: +44 (0) 20 3287 4268

Asia Pacific

Future Market Insights

IndiaLand Global Tech Park, Unit UG-1, Behind Grand HighStreet, Phase 1, Hinjawadi, MH, Pune – 411057, India

Valencene Market Outlook (2023 to 2033)

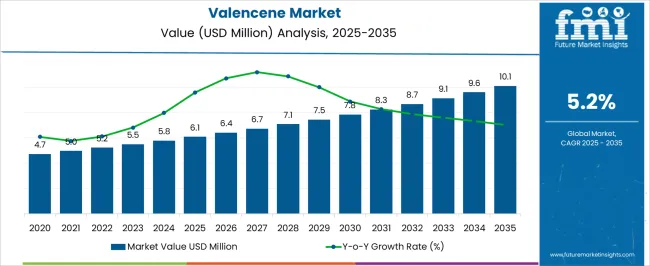
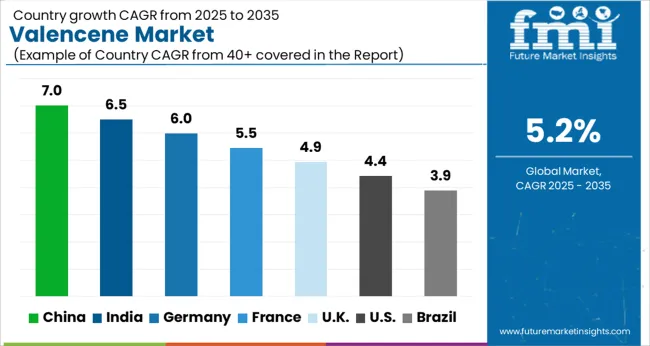
During the projected period, the global valencene market is expected to grow at a CAGR of 5.2%. The market value is anticipated to increase from US$ 5.5 Million in 2023 to US$ 9.2 Million by 2033.

Valencene is a natural compound found in Valencia oranges and is used as a flavoring agent in the food & beverage industry. Rising demand for natural food & beverage ingredients and growing awareness about various health benefits of valencene are the major factors driving sales in the global market.

However, the high cost of valencene and stringent regulations regarding its use are restraining growth in this market to some extent. Valencene is used in various applications such as beverages, desserts, savory dishes, and others.

Moreover, valencene is considered to be the primary flavor compound in the popular citrus beverage named Orangina. It is also used as a flavoring agent in a wide variety of food and beverage products, including soft drinks, hard candies, ice creams, and chewing gums.

The market is expected to grow significantly in the next ten years. The compound is already being used in a wide range of products, and its popularity is only expected to increase. There are numerous opportunities for key companies that produce valencene-based products, and the market is set to expand with the easy availability of such products.

On the other hand, there are several factors that may limit its use in food applications. One major issue is its low solubility in water. This means that it cannot be used as a direct flavoring agent in products such as soft drinks or juices.

Instead, it must be added to the product in the form of an oil or emulsion. This can increase the cost of production and may also affect the final flavor of the product. Another factor that can limit the use of valencene is its relatively high boiling point. This means that it can easily be lost during processing, thereby leading to a loss of flavor.

Furthermore, one of the most popular current trends in the market is the use of valencene in natural flavoring. The compound has a unique orange flavor that can be used to enhance the taste of many foods and beverages. It is also becoming increasingly popular as an ingredient in cosmetics and skin care products due to its pleasant scent and skin-loving properties.

Another current trend is the use of valencene as a dietary supplement. The compound has many health benefits, including supporting cardiovascular health, reducing inflammation, and boosting immunity. Valencene supplements are becoming increasingly popular among people who are looking for various ways to improve their overall health and well-being.

Attributes Key Insights
Global Valencene Market Estimated Size (2023E) US$ 5.5 Million
Projected Market Valuation (2033F) US$ 9.2 Million
Value-based CAGR (2023 to 2033) 5.2%

Don't pay for what you don't need

Customize your report by selecting specific countries or regions and save 30%!

2017 to 2022 Global Valencene Market Outlook Compared to 2023 to 2033 Demand Forecast

The global market is expected to reach US$ 9.2 Million by 2033. The market is anticipated to register a CAGR of 5.2% over the forecast period. Increasing demand for natural and organic ingredients in the personal care and cosmetics industry is expected to drive the market over the forecast period.

Valencene is an important fragrance ingredient used in a wide range of personal care and cosmetics products such as skin care, hair care, and fragrances. It is derived from Valencia oranges and has a fresh, citrusy aroma. The compound has antimicrobial and antioxidant properties that would make it an ideal ingredient for personal care formulations.

Valencene Market

Market-o-nomics - Highlighting the Key Trends

A number of influential factors have been identified to stir the soup in the market. Apart from the proliferating aspects prevailing in the market, analysts at FMI have also analyzed the restraining elements, lucrative opportunities, and upcoming threats that can pose a challenge to the progression of the market.

The drivers, restraints, opportunities, and threats (DROTs) identified are as follows:

DRIVERS

  • As valencene features a host of promising anti-inflammatory and antioxidant properties, it can be used for the treatment of conditions like cancer.
  • Increasing the use of valencene in bug sprays, owing to its ability to act as a powerful insecticide, would drive the market.

RESTRAINTS

  • Topical use of valencene can lead to a slight risk of skin reactivity, as with many other essential oils, which may hamper sales.
  • Blending chemotherapy drugs with valencene, as well as other terpenes may produce a synergistic effect.

OPPORTUNITIES

  • Key companies are set to infuse valencene in olive oils and other food ingredients to offer an extra layer of flavor.
  • As valencene has proved to reduce the inflammatory response, potentially supporting the body’s immune response, researchers are trying to use it for making medicines.

THREATS

  • The easy availability of various substitutes like linalool or beta-caryophyllene can inhibit growth in the market.
  • The sourness in valencene can often lead to issues with bones and swelling in joints, which may obstruct demand.
Nandini Roy Choudhury

Principal Consultant

Talk to Analyst

Find your sweet spots for generating winning opportunities in this market.

Country-wise Insights

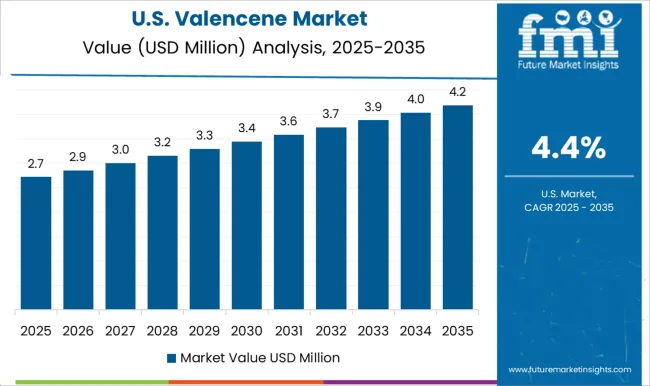
Why are Sales of Valencene Growing at a Rapid Pace in the USA?

Increasing Demand for Orange Juice in the USA to Spur Sales of Valencene Terpene

Valencene is a type of citrus fruit that is grown in the Mediterranean region. It is used to make orange juice, lemonade, and other citrus drinks. In North American countries like the USA, valencene is used to make orange juice and other citrus drinks. It is also expected to be used extensively in perfumes and cosmetics.

Valencene is often affected by the climate in the USA It needs warm weather and a lot of sunlight to grow. If the weather is too cold or if there is not enough sunlight, valencene will not grow well across the USA This factor may affect the market negatively in the evaluation period.

How are Leading Valencene Manufacturers Distributing their Products in India?

High Sales of Cocktails, Wine, and Beer in India to Drive the Demand for Valencene Synthase

Valencene has a woody, citrusy aroma and is used as a flavoring agent in food and beverages. In India, valencene is used in several different ways. It is mainly used as a flavor enhancer in food and beverages.

Valencene is usually added to various foods and drinks to enhance its flavors. Some of the foods that valencene is often added to include soups, stews, sauces, and marinades. Valencene is also used as a flavoring agent in alcoholic beverages such as beer, wine, and cocktails. The country is expected to use the ingredient in medicines due to its anti-inflammatory and antibacterial properties.
What is the Outlook of Germany in the Space of Valencene across Europe?

Investments by Germany in Spanish Orange Growers to Bolster Sales of Valencene Aroma

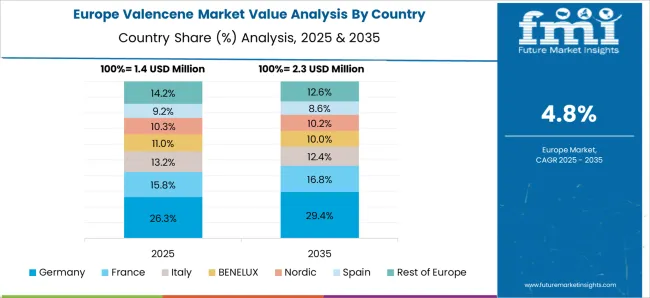
Germany dominated the Europe market in the historical period. In recent years, however, Spain has been the leading producer of valencene. This is due to the fact that Spain's climate is more conducive to the growth of Valencia oranges, which are used to produce valencene.

Germany has responded to this change in market dynamics by investing in Spanish orange growers. This has allowed them to control a large portion of the Europe market for valencene. In addition, Germany has been working on developing new methods of producing valencene, which would spur sales.

Category-wise Insights

Which is the Leading Application of Valencene across the Globe?

Launch of Unique Orange Flavored Food and Beverages to Propel Sales of Valencene Strains

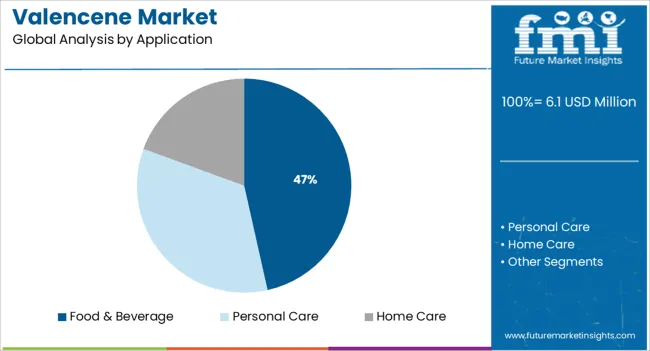
Based on application, the food and beverage segment is anticipated to remain at the forefront in the next ten years. Increasing demand for orange-flavored food and beverages, especially among kids and young adults is estimated to bolster sales in the global market. In January 2022, for instance, Jameson launched Jameson Orange: An Irish Whiskey infused with citrus flavors to solidify its place in the flavored whiskey category. The launch of similar products by renowned food and beverage companies to attract a large client base is anticipated to push growth.
Get the data you need at a Fraction of the cost

Personalize your report by choosing insights you need
and save 40%!

Competitive Landscape

The global market is growing at a moderate rate and is expected to continue doing so during the forecast period. Key companies in the market are striving to keep up with the increasing demand for natural flavors from the food and beverage industry worldwide. They are thus focusing on in-depth research and development activities to come up with unique product lines.

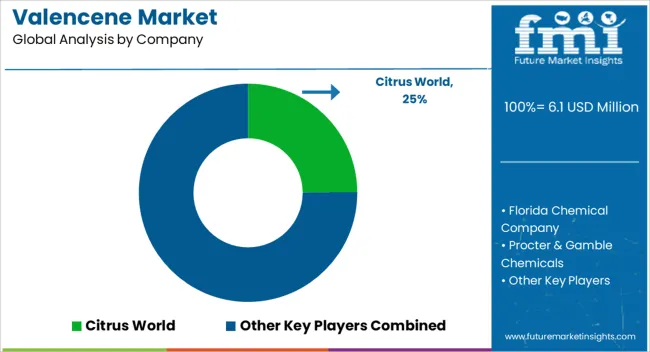
The global market is highly fragmented with the presence of a large number of small and medium-sized manufacturers. Some of the key players in the market are Citrus World, Florida Chemical Company, Procter & Gamble Chemicals, Symrise AG, Isobionics, Evolva, Vishal essential oils and chemicals, Cvista, and Panta Manufacturing Company among others.

For instance,

  • In September 2020, Isobionics, an innovative developer of flavor and fragrance ingredients announced that its valencene is the first biotech-based valencene that was approved for the Japanese market as a food additive. The approval was granted by the Ministry of Health, Labour, and Welfare in Tokyo in August 2020.

Scope of the Valencene Market Report

Attribute Details
Estimated Market Size (2023) US$ 5.5 Million
Projected Market Valuation (2033) US$ 9.2 Million
Value-based CAGR (2023 to 2033) 5.2%
Forecast Period 2023 to 2033
Historical Data Available for 2017 to 2022
Market Analysis Value (US$ Million)
Key Regions Covered
  • North America
  • Latin America
  • Europe
  • Asia Pacific
  • Oceania
  • Middle East and Africa(MEA)
Key Countries Covered
  • USA
  • Canada
  • Mexico
  • Germany
  • United Kingdom
  • France
  • Italy
  • Spain
  • China
  • Japan
  • India
  • South Korea
  • Australia
  • Brazil
  • Argentina
  • South Africa
  • United Arab Emirates(UAE)
Key Segments Covered
  • Purity Grade
  • Application
  • Distribution Channel
  • Region
Key Companies Profiled
  • Citrus World
  • Florida Chemical Company
  • Procter & Gamble Chemicals
  • Symrise AG.
  • Isobionics
  • Evolva
  • Vishal essential oils and chemicals
  • Cvista
  • Panta manufacturing company
Report Coverage Market Forecast, Company Share Analysis, Competitive Landscape, Drivers, Restraints, Opportunities and Threats Analysis, Market Dynamics and Challenges, and Strategic Growth Initiatives

Valencene Market Outlook by Category

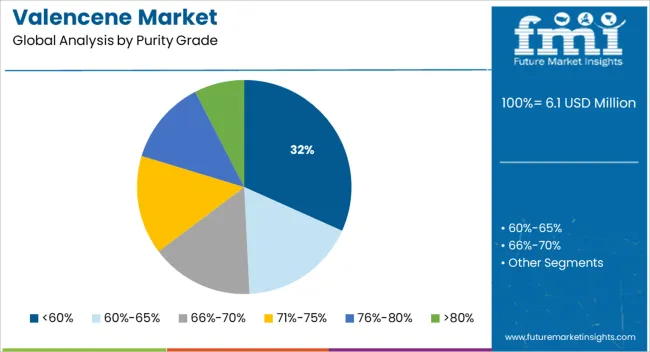
By Purity Grade:

  • <60%
  • 60%-65%
  • 66%-70%
  • 71%-75%
  • 76%-80%
  • >80%

By Application:

  • Food & Beverage
  • Personal Care
  • Home Care

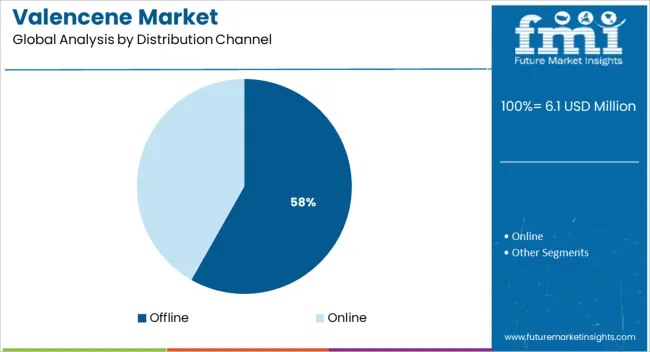
By Distribution Channel:

  • Online
  • Offline

By Region:

  • North America
  • Latin America
  • Europe
  • East Asia
  • South Asia
  • Oceania
  • Middle East and Africa(MEA)

Frequently Asked Questions

How big is the global market for valencene?

The global market for valencene is expected to reach a valuation of US$ 5.5 Mn by the end of 2023.

At what rate is the market for valencene expected to rise in the next ten years?

The market for valencene is expected to rise at a CAGR of 5.6% in the next ten years.

What is the outlook of North America in the market for valencene?

The North America valencene market is expected to register a 38% CAGR between 2023 and 2033.

Which are the key countries driving the demand for valencene?

The U.S., China, Canada, Germany, and Mexico are the key countries driving the demand for valencene.

At what rate will the market for valencene grow in China?

The market for valencene in China is projected to grow at a CAGR of 5.8% during the forecast period.

At what rate will the demand for valencene grow in the U.K.?

The demand for valencene is projected to grow at a CAGR of 6% in the U.K during the evaluation period.

At what rate will the demand for valencene grow in India?

The demand for valencene is projected to grow at a CAGR of 4.2% in India during the expected time frame.

At what rate will the demand for valencene surge in Europe?

The demand for valencene in Europe is expected to grow at 6.1% CAGR in 2023.

At what rate will sales of valencene grow in Japan?

Sales of valencene in Japan are expected to grow at 2.3% CAGR in 2023.

Table of Content

1. Executive Summary | Valencene Market

    1.1. Global Market Outlook

    1.2. Demand-side Trends

    1.3. Supply-side Trends

    1.4. Technology Roadmap Analysis

    1.5. Analysis and Recommendations

2. Market Overview

    2.1. Market Coverage / Taxonomy

    2.2. Market Definition / Scope / Limitations

3. Market Background

    3.1. Market Dynamics

        3.1.1. Drivers

        3.1.2. Restraints

        3.1.3. Opportunity

        3.1.4. Trends

    3.2. Scenario Forecast

        3.2.1. Demand in Optimistic Scenario

        3.2.2. Demand in Likely Scenario

        3.2.3. Demand in Conservative Scenario

    3.3. Product launches & Recent Developments

    3.4. Product Life Cycle Analysis

    3.5. Value Chain Analysis

        3.5.1. Supply Side Participants and their Roles

            3.5.1.1. Producers

            3.5.1.2. Mid-Level Participants (Traders/ Agents/ Brokers)

            3.5.1.3. Wholesalers and Distributors

        3.5.2. % of Operating Margin Analysis

        3.5.3. List of Raw Material Suppliers

        3.5.4. List of Existing and Potential Buyers

    3.6. Global Market - Pricing Analysis

        3.6.1. Price Point Assessment by Region

        3.6.2. Price Point Assessment by Product Type

        3.6.3. Price Forecast till 2033

        3.6.4. Factors affecting pricing

    3.7. Forecast Factors - Relevance & Impact

    3.8. PESTLE and Porter’s Analysis

    3.9. Regulatory Landscape

        3.9.1. Packaging & Labelling Regulations

        3.9.2. Certifications and Certifying Agency Overview

        3.9.3. Import/Export Policies

    3.10. Regional Parent Market Outlook

    3.11. Production and Consumption Statistics

    3.12. Import and Export Statistics

    3.13. Consumers Survey Analysis

    3.14. Macro-Economic Factors

    3.15. Product Claims & Nutritional Information scanned by Buyers

4. Global Market Analysis 2017 to 2022 and Forecast, 2023 to 2033

    4.1. Historical Market Size Value (US$ Million) & Volume (KG) Analysis, 2017 to 2022

    4.2. Current and Future Market Size Value (US$ Million) & Volume (KG) Projections, 2023 to 2033

        4.2.1. Y-o-Y Growth Trend Analysis

        4.2.2. Absolute $ Opportunity Analysis

5. Global Market Analysis 2017 to 2022 and Forecast 2023 to 2033, By Purity grade

    5.1. Introduction / Key Findings

    5.2. Historical Market Size Value (US$ Million) & Volume (KG) Analysis By Purity grade, 2017 to 2022

    5.3. Current and Future Market Size Value (US$ Million) & Volume (KG) Analysis and Forecast By Purity grade, 2023 to 2033

        5.3.1. <60%

        5.3.2. 60%-65%

        5.3.3. 66%-70%

        5.3.4. 71%-75%

        5.3.5. 76%-80%

        5.3.6. >80%

    5.4. Y-o-Y Growth Trend Analysis By Purity grade, 2017 to 2022

    5.5. Absolute $ Opportunity Analysis By Purity grade, 2023 to 2033

6. Global Market Analysis 2017 to 2022 and Forecast 2023 to 2033, By Application

    6.1. Introduction / Key Findings

    6.2. Historical Market Size Value (US$ Million) & Volume (KG) Analysis By Application, 2017 to 2022

    6.3. Current and Future Market Size Value (US$ Million) & Volume (KG) Analysis and Forecast By Application, 2023 to 2033

        6.3.1. Food & Beverage

        6.3.2. Personal Care

        6.3.3. Home Care

    6.4. Y-o-Y Growth Trend Analysis By Application, 2017 to 2022

    6.5. Absolute $ Opportunity Analysis By Application, 2023 to 2033

7. Global Market Analysis 2017 to 2022 and Forecast 2023 to 2033, By Distribution Channel

    7.1. Introduction / Key Findings

    7.2. Historical Market Size Value (US$ Million) & Volume (KG) Analysis By Distribution Channel, 2017 to 2022

    7.3. Current and Future Market Size Value (US$ Million) & Volume (KG) Analysis and Forecast By Distribution Channel, 2023 to 2033

        7.3.1. Offline

        7.3.2. Online

    7.4. Y-o-Y Growth Trend Analysis By Distribution Channel, 2017 to 2022

    7.5. Absolute $ Opportunity Analysis By Distribution Channel, 2023 to 2033

8. Global Market Analysis 2017 to 2022 and Forecast 2023 to 2033, By Region

    8.1. Introduction

    8.2. Historical Market Size Value (US$ Million) & Volume (KG) Analysis By Region, 2017 to 2022

    8.3. Current Market Size Value (US$ Million) & Volume (KG) Analysis and Forecast By Region, 2023 to 2033

        8.3.1. North America

        8.3.2. Latin America

        8.3.3. Europe

        8.3.4. East Asia

        8.3.5. South Asia

        8.3.6. Oceania

        8.3.7. Middle East and Africa(MEA)

    8.4. Market Attractiveness Analysis By Region

9. North America Market Analysis 2017 to 2022 and Forecast 2023 to 2033, By Country

    9.1. Historical Market Size Value (US$ Million) & Volume (KG) Trend Analysis By Market Taxonomy, 2017 to 2022

    9.2. Market Size Value (US$ Million) & Volume (KG) Forecast By Market Taxonomy, 2023 to 2033

        9.2.1. By Country

            9.2.1.1. USA

            9.2.1.2. Canada

        9.2.2. By Purity grade

        9.2.3. By Application

        9.2.4. By Distribution

    9.3. Market Attractiveness Analysis

        9.3.1. By Country

        9.3.2. By Purity grade

        9.3.3. By Application

        9.3.4. By Distribution

    9.4. Key Takeaways

10. Latin America Market Analysis 2017 to 2022 and Forecast 2023 to 2033, By Country

    10.1. Historical Market Size Value (US$ Million) & Volume (KG) Trend Analysis By Market Taxonomy, 2017 to 2022

    10.2. Market Size Value (US$ Million) & Volume (KG) Forecast By Market Taxonomy, 2023 to 2033

        10.2.1. By Country

            10.2.1.1. Brazil

            10.2.1.2. Mexico

            10.2.1.3. Argentina

            10.2.1.4. Chile

            10.2.1.5. Peru

            10.2.1.6. Rest of Latin America

        10.2.2. By Purity grade

        10.2.3. By Application

        10.2.4. By Distribution

    10.3. Market Attractiveness Analysis

        10.3.1. By Country

        10.3.2. By Purity grade

        10.3.3. By Application

        10.3.4. By Distribution

    10.4. Key Takeaways

11. Europe Market Analysis 2017 to 2022 and Forecast 2023 to 2033, By Country

    11.1. Historical Market Size Value (US$ Million) & Volume (KG) Trend Analysis By Market Taxonomy, 2017 to 2022

    11.2. Market Size Value (US$ Million) & Volume (KG) Forecast By Market Taxonomy, 2023 to 2033

        11.2.1. By Country

            11.2.1.1. Germany

            11.2.1.2. Italy

            11.2.1.3. France

            11.2.1.4. United Kingdom

            11.2.1.5. Spain

            11.2.1.6. Russia

            11.2.1.7. BENELUX

            11.2.1.8. Poland

            11.2.1.9. Nordic Countries

            11.2.1.10. Rest of Europe

        11.2.2. By Purity grade

        11.2.3. By Application

        11.2.4. By Distribution

    11.3. Market Attractiveness Analysis

        11.3.1. By Country

        11.3.2. By Purity grade

        11.3.3. By Application

        11.3.4. By Distribution

    11.4. Key Takeaways

12. East Asia Market Analysis 2017 to 2022 and Forecast 2023 to 2033, By Country

    12.1. Historical Market Size Value (US$ Million) & Volume (KG) Trend Analysis By Market Taxonomy, 2017 to 2022

    12.2. Market Size Value (US$ Million) & Volume (KG) Forecast By Market Taxonomy, 2023 to 2033

        12.2.1. By Country

            12.2.1.1. China

            12.2.1.2. Japan

            12.2.1.3. South Korea

        12.2.2. By Purity grade

        12.2.3. By Application

        12.2.4. By Distribution

    12.3. Market Attractiveness Analysis

        12.3.1. By Country

        12.3.2. By Purity grade

        12.3.3. By Application

        12.3.4. By Distribution

    12.4. Key Takeaways

13. South Asia Market Analysis 2017 to 2022 and Forecast 2023 to 2033, By Country

    13.1. Historical Market Size Value (US$ Million) & Volume (KG) Trend Analysis By Market Taxonomy, 2017 to 2022

    13.2. Market Size Value (US$ Million) & Volume (KG) Forecast By Market Taxonomy, 2023 to 2033

        13.2.1. By Country

            13.2.1.1. India

            13.2.1.2. Thailand

            13.2.1.3. Malaysia

            13.2.1.4. Indonesia

            13.2.1.5. Singapore

            13.2.1.6. Rest of South Asia

        13.2.2. By Purity grade

        13.2.3. By Application

        13.2.4. By Distribution

    13.3. Market Attractiveness Analysis

        13.3.1. By Country

        13.3.2. By Purity grade

        13.3.3. By Application

        13.3.4. By Distribution

    13.4. Key Takeaways

14. Oceania Market Analysis 2017 to 2022 and Forecast 2023 to 2033, By Country

    14.1. Historical Market Size Value (US$ Million) & Volume (KG) Trend Analysis By Market Taxonomy, 2017 to 2022

    14.2. Market Size Value (US$ Million) & Volume (KG) Forecast By Market Taxonomy, 2023 to 2033

        14.2.1. By Country

            14.2.1.1. Australia

            14.2.1.2. New Zealand

        14.2.2. By Purity grade

        14.2.3. By Application

        14.2.4. By Distribution

    14.3. Market Attractiveness Analysis

        14.3.1. By Country

        14.3.2. By Purity grade

        14.3.3. By Application

        14.3.4. By Distribution

    14.4. Key Takeaways

15. MEA Market Analysis 2017 to 2022 and Forecast 2023 to 2033, By Country

    15.1. Historical Market Size Value (US$ Million) & Volume (KG) Trend Analysis By Market Taxonomy, 2017 to 2022

    15.2. Market Size Value (US$ Million) & Volume (KG) Forecast By Market Taxonomy, 2023 to 2033

        15.2.1. By Country

            15.2.1.1. GCC Countries

            15.2.1.2. South Africa

            15.2.1.3. Central Africa

            15.2.1.4. North Africa

        15.2.2. By Purity grade

        15.2.3. By Application

        15.2.4. By Distribution

    15.3. Market Attractiveness Analysis

        15.3.1. By Country

        15.3.2. By Purity grade

        15.3.3. By Application

        15.3.4. By Distribution

    15.4. Key Takeaways

16. Key Countries Market Analysis

    16.1. USA

        16.1.1. Pricing Analysis

        16.1.2. Market Share Analysis, 2022

            16.1.2.1. By Purity grade

            16.1.2.2. By Application

            16.1.2.3. By Distribution

    16.2. Canada

        16.2.1. Pricing Analysis

        16.2.2. Market Share Analysis, 2022

            16.2.2.1. By Purity grade

            16.2.2.2. By Application

            16.2.2.3. By Distribution

    16.3. Brazil

        16.3.1. Pricing Analysis

        16.3.2. Market Share Analysis, 2022

            16.3.2.1. By Purity grade

            16.3.2.2. By Application

            16.3.2.3. By Distribution

    16.4. Mexico

        16.4.1. Pricing Analysis

        16.4.2. Market Share Analysis, 2022

            16.4.2.1. By Purity grade

            16.4.2.2. By Application

            16.4.2.3. By Distribution

    16.5. Argentina

        16.5.1. Pricing Analysis

        16.5.2. Market Share Analysis, 2022

            16.5.2.1. By Purity grade

            16.5.2.2. By Application

            16.5.2.3. By Distribution

    16.6. Chile

        16.6.1. Pricing Analysis

        16.6.2. Market Share Analysis, 2022

            16.6.2.1. By Purity grade

            16.6.2.2. By Application

            16.6.2.3. By Distribution

    16.7. Peru

        16.7.1. Pricing Analysis

        16.7.2. Market Share Analysis, 2022

            16.7.2.1. By Purity grade

            16.7.2.2. By Application

            16.7.2.3. By Distribution

    16.8. Germany

        16.8.1. Pricing Analysis

        16.8.2. Market Share Analysis, 2022

            16.8.2.1. By Purity grade

            16.8.2.2. By Application

            16.8.2.3. By Distribution

    16.9. Italy

        16.9.1. Pricing Analysis

        16.9.2. Market Share Analysis, 2022

            16.9.2.1. By Purity grade

            16.9.2.2. By Application

            16.9.2.3. By Distribution

    16.10. France

        16.10.1. Pricing Analysis

        16.10.2. Market Share Analysis, 2022

            16.10.2.1. By Purity grade

            16.10.2.2. By Application

            16.10.2.3. By Distribution

    16.11. Spain

        16.11.1. Pricing Analysis

        16.11.2. Market Share Analysis, 2022

            16.11.2.1. By Purity grade

            16.11.2.2. By Application

            16.11.2.3. By Distribution

    16.12. United Kingdom

        16.12.1. Pricing Analysis

        16.12.2. Market Share Analysis, 2022

            16.12.2.1. By Purity grade

            16.12.2.2. By Application

            16.12.2.3. By Distribution

    16.13. Russia

        16.13.1. Pricing Analysis

        16.13.2. Market Share Analysis, 2022

            16.13.2.1. By Purity grade

            16.13.2.2. By Application

            16.13.2.3. By Distribution

    16.14. Poland

        16.14.1. Pricing Analysis

        16.14.2. Market Share Analysis, 2022

            16.14.2.1. By Purity grade

            16.14.2.2. By Application

            16.14.2.3. By Distribution

    16.15. BENELUX

        16.15.1. Pricing Analysis

        16.15.2. Market Share Analysis, 2022

            16.15.2.1. By Purity grade

            16.15.2.2. By Application

            16.15.2.3. By Distribution

    16.16. Nordic Countries

        16.16.1. Pricing Analysis

        16.16.2. Market Share Analysis, 2022

            16.16.2.1. By Purity grade

            16.16.2.2. By Application

            16.16.2.3. By Distribution

    16.17. China

        16.17.1. Pricing Analysis

        16.17.2. Market Share Analysis, 2022

            16.17.2.1. By Purity grade

            16.17.2.2. By Application

            16.17.2.3. By Distribution

    16.18. Japan

        16.18.1. Pricing Analysis

        16.18.2. Market Share Analysis, 2022

            16.18.2.1. By Purity grade

            16.18.2.2. By Application

            16.18.2.3. By Distribution

    16.19. South Korea

        16.19.1. Pricing Analysis

        16.19.2. Market Share Analysis, 2022

            16.19.2.1. By Purity grade

            16.19.2.2. By Application

            16.19.2.3. By Distribution

    16.20. India

        16.20.1. Pricing Analysis

        16.20.2. Market Share Analysis, 2022

            16.20.2.1. By Purity grade

            16.20.2.2. By Application

            16.20.2.3. By Distribution

    16.21. Thailand

        16.21.1. Pricing Analysis

        16.21.2. Market Share Analysis, 2022

            16.21.2.1. By Purity grade

            16.21.2.2. By Application

            16.21.2.3. By Distribution

    16.22. Indonesia

        16.22.1. Pricing Analysis

        16.22.2. Market Share Analysis, 2022

            16.22.2.1. By Purity grade

            16.22.2.2. By Application

            16.22.2.3. By Distribution

    16.23. Malaysia

        16.23.1. Pricing Analysis

        16.23.2. Market Share Analysis, 2022

            16.23.2.1. By Purity grade

            16.23.2.2. By Application

            16.23.2.3. By Distribution

    16.24. Singapore

        16.24.1. Pricing Analysis

        16.24.2. Market Share Analysis, 2022

            16.24.2.1. By Purity grade

            16.24.2.2. By Application

            16.24.2.3. By Distribution

    16.25. Australia

        16.25.1. Pricing Analysis

        16.25.2. Market Share Analysis, 2022

            16.25.2.1. By Purity grade

            16.25.2.2. By Application

            16.25.2.3. By Distribution

    16.26. New Zealand

        16.26.1. Pricing Analysis

        16.26.2. Market Share Analysis, 2022

            16.26.2.1. By Purity grade

            16.26.2.2. By Application

            16.26.2.3. By Distribution

    16.27. GCC Countries

        16.27.1. Pricing Analysis

        16.27.2. Market Share Analysis, 2022

            16.27.2.1. By Purity grade

            16.27.2.2. By Application

            16.27.2.3. By Distribution

    16.28. South Africa

        16.28.1. Pricing Analysis

        16.28.2. Market Share Analysis, 2022

            16.28.2.1. By Purity grade

            16.28.2.2. By Application

            16.28.2.3. By Distribution

    16.29. North Africa

        16.29.1. Pricing Analysis

        16.29.2. Market Share Analysis, 2022

            16.29.2.1. By Purity grade

            16.29.2.2. By Application

            16.29.2.3. By Distribution

    16.30. Central Africa

        16.30.1. Pricing Analysis

        16.30.2. Market Share Analysis, 2022

            16.30.2.1. By Purity grade

            16.30.2.2. By Application

            16.30.2.3. By Distribution

17. Market Structure Analysis

    17.1. Competition Dashboard

    17.2. Competition Benchmarking

    17.3. Market Share Analysis of Top Players

        17.3.1. By Regional

        17.3.2. By Purity grade

        17.3.3. By Application

        17.3.4. By Distribution

18. Competition Analysis

    18.1. Competition Deep Dive

        18.1.1. Citrus World

            18.1.1.1. Overview

            18.1.1.2. Product Portfolio

            18.1.1.3. Profitability by Market Segments (Product/Age /Sales Channel/Region)

            18.1.1.4. Sales Footprint

            18.1.1.5. Strategy Overview

                18.1.1.5.1. Marketing Strategy

                18.1.1.5.2. Product Strategy

                18.1.1.5.3. Channel Strategy

        18.1.2. Florida Chemical Company

            18.1.2.1. Overview

            18.1.2.2. Product Portfolio

            18.1.2.3. Profitability by Market Segments (Product/Age /Sales Channel/Region)

            18.1.2.4. Sales Footprint

            18.1.2.5. Strategy Overview

                18.1.2.5.1. Marketing Strategy

                18.1.2.5.2. Product Strategy

                18.1.2.5.3. Channel Strategy

        18.1.3. Procter & Gamble Chemicals

            18.1.3.1. Overview

            18.1.3.2. Product Portfolio

            18.1.3.3. Profitability by Market Segments (Product/Age /Sales Channel/Region)

            18.1.3.4. Sales Footprint

            18.1.3.5. Strategy Overview

                18.1.3.5.1. Marketing Strategy

                18.1.3.5.2. Product Strategy

                18.1.3.5.3. Channel Strategy

        18.1.4. Symrise AG.

            18.1.4.1. Overview

            18.1.4.2. Product Portfolio

            18.1.4.3. Profitability by Market Segments (Product/Age /Sales Channel/Region)

            18.1.4.4. Sales Footprint

            18.1.4.5. Strategy Overview

                18.1.4.5.1. Marketing Strategy

                18.1.4.5.2. Product Strategy

                18.1.4.5.3. Channel Strategy

        18.1.5. Isobionics

            18.1.5.1. Overview

            18.1.5.2. Product Portfolio

            18.1.5.3. Profitability by Market Segments (Product/Age /Sales Channel/Region)

            18.1.5.4. Sales Footprint

            18.1.5.5. Strategy Overview

                18.1.5.5.1. Marketing Strategy

                18.1.5.5.2. Product Strategy

                18.1.5.5.3. Channel Strategy

        18.1.6. Evolva

            18.1.6.1. Overview

            18.1.6.2. Product Portfolio

            18.1.6.3. Profitability by Market Segments (Product/Age /Sales Channel/Region)

            18.1.6.4. Sales Footprint

            18.1.6.5. Strategy Overview

                18.1.6.5.1. Marketing Strategy

                18.1.6.5.2. Product Strategy

                18.1.6.5.3. Channel Strategy

        18.1.7. Vishal essential oils and chemicals

            18.1.7.1. Overview

            18.1.7.2. Product Portfolio

            18.1.7.3. Profitability by Market Segments (Product/Age /Sales Channel/Region)

            18.1.7.4. Sales Footprint

            18.1.7.5. Strategy Overview

                18.1.7.5.1. Marketing Strategy

                18.1.7.5.2. Product Strategy

                18.1.7.5.3. Channel Strategy

        18.1.8. Cvista

            18.1.8.1. Overview

            18.1.8.2. Product Portfolio

            18.1.8.3. Profitability by Market Segments (Product/Age /Sales Channel/Region)

            18.1.8.4. Sales Footprint

            18.1.8.5. Strategy Overview

                18.1.8.5.1. Marketing Strategy

                18.1.8.5.2. Product Strategy

                18.1.8.5.3. Channel Strategy

        18.1.9. Panta manufacturing company

            18.1.9.1. Overview

            18.1.9.2. Product Portfolio

            18.1.9.3. Profitability by Market Segments (Product/Age /Sales Channel/Region)

            18.1.9.4. Sales Footprint

            18.1.9.5. Strategy Overview

                18.1.9.5.1. Marketing Strategy

                18.1.9.5.2. Product Strategy

                18.1.9.5.3. Channel Strategy

19. Assumptions & Acronyms Used

20. Research Methodology

Don't pay for what you don't need

Customize your report by selecting specific countries or regions and save 30%!

List of Tables

Table 1: Global Market Value (US$ Million) Forecast by Region, 2017 to 2033

Table 2: Global Market Volume (KG) Forecast by Region, 2017 to 2033

Table 3: Global Market Value (US$ Million) Forecast by Purity grade, 2017 to 2033

Table 4: Global Market Volume (KG) Forecast by Purity grade, 2017 to 2033

Table 5: Global Market Value (US$ Million) Forecast by Application, 2017 to 2033

Table 6: Global Market Volume (KG) Forecast by Application, 2017 to 2033

Table 7: Global Market Value (US$ Million) Forecast by Distribution, 2017 to 2033

Table 8: Global Market Volume (KG) Forecast by Distribution, 2017 to 2033

Table 9: North America Market Value (US$ Million) Forecast by Country, 2017 to 2033

Table 10: North America Market Volume (KG) Forecast by Country, 2017 to 2033

Table 11: North America Market Value (US$ Million) Forecast by Purity grade, 2017 to 2033

Table 12: North America Market Volume (KG) Forecast by Purity grade, 2017 to 2033

Table 13: North America Market Value (US$ Million) Forecast by Application, 2017 to 2033

Table 14: North America Market Volume (KG) Forecast by Application, 2017 to 2033

Table 15: North America Market Value (US$ Million) Forecast by Distribution, 2017 to 2033

Table 16: North America Market Volume (KG) Forecast by Distribution, 2017 to 2033

Table 17: Latin America Market Value (US$ Million) Forecast by Country, 2017 to 2033

Table 18: Latin America Market Volume (KG) Forecast by Country, 2017 to 2033

Table 19: Latin America Market Value (US$ Million) Forecast by Purity grade, 2017 to 2033

Table 20: Latin America Market Volume (KG) Forecast by Purity grade, 2017 to 2033

Table 21: Latin America Market Value (US$ Million) Forecast by Application, 2017 to 2033

Table 22: Latin America Market Volume (KG) Forecast by Application, 2017 to 2033

Table 23: Latin America Market Value (US$ Million) Forecast by Distribution, 2017 to 2033

Table 24: Latin America Market Volume (KG) Forecast by Distribution, 2017 to 2033

Table 25: Europe Market Value (US$ Million) Forecast by Country, 2017 to 2033

Table 26: Europe Market Volume (KG) Forecast by Country, 2017 to 2033

Table 27: Europe Market Value (US$ Million) Forecast by Purity grade, 2017 to 2033

Table 28: Europe Market Volume (KG) Forecast by Purity grade, 2017 to 2033

Table 29: Europe Market Value (US$ Million) Forecast by Application, 2017 to 2033

Table 30: Europe Market Volume (KG) Forecast by Application, 2017 to 2033

Table 31: Europe Market Value (US$ Million) Forecast by Distribution, 2017 to 2033

Table 32: Europe Market Volume (KG) Forecast by Distribution, 2017 to 2033

Table 33: East Asia Market Value (US$ Million) Forecast by Country, 2017 to 2033

Table 34: East Asia Market Volume (KG) Forecast by Country, 2017 to 2033

Table 35: East Asia Market Value (US$ Million) Forecast by Purity grade, 2017 to 2033

Table 36: East Asia Market Volume (KG) Forecast by Purity grade, 2017 to 2033

Table 37: East Asia Market Value (US$ Million) Forecast by Application, 2017 to 2033

Table 38: East Asia Market Volume (KG) Forecast by Application, 2017 to 2033

Table 39: East Asia Market Value (US$ Million) Forecast by Distribution, 2017 to 2033

Table 40: East Asia Market Volume (KG) Forecast by Distribution, 2017 to 2033

Table 41: South Asia Market Value (US$ Million) Forecast by Country, 2017 to 2033

Table 42: South Asia Market Volume (KG) Forecast by Country, 2017 to 2033

Table 43: South Asia Market Value (US$ Million) Forecast by Purity grade, 2017 to 2033

Table 44: South Asia Market Volume (KG) Forecast by Purity grade, 2017 to 2033

Table 45: South Asia Market Value (US$ Million) Forecast by Application, 2017 to 2033

Table 46: South Asia Market Volume (KG) Forecast by Application, 2017 to 2033

Table 47: South Asia Market Value (US$ Million) Forecast by Distribution, 2017 to 2033

Table 48: South Asia Market Volume (KG) Forecast by Distribution, 2017 to 2033

Table 49: Oceania Market Value (US$ Million) Forecast by Country, 2017 to 2033

Table 50: Oceania Market Volume (KG) Forecast by Country, 2017 to 2033

Table 51: Oceania Market Value (US$ Million) Forecast by Purity grade, 2017 to 2033

Table 52: Oceania Market Volume (KG) Forecast by Purity grade, 2017 to 2033

Table 53: Oceania Market Value (US$ Million) Forecast by Application, 2017 to 2033

Table 54: Oceania Market Volume (KG) Forecast by Application, 2017 to 2033

Table 55: Oceania Market Value (US$ Million) Forecast by Distribution, 2017 to 2033

Table 56: Oceania Market Volume (KG) Forecast by Distribution, 2017 to 2033

Table 57: MEA Market Value (US$ Million) Forecast by Country, 2017 to 2033

Table 58: MEA Market Volume (KG) Forecast by Country, 2017 to 2033

Table 59: MEA Market Value (US$ Million) Forecast by Purity grade, 2017 to 2033

Table 60: MEA Market Volume (KG) Forecast by Purity grade, 2017 to 2033

Table 61: MEA Market Value (US$ Million) Forecast by Application, 2017 to 2033

Table 62: MEA Market Volume (KG) Forecast by Application, 2017 to 2033

Table 63: MEA Market Value (US$ Million) Forecast by Distribution, 2017 to 2033

Table 64: MEA Market Volume (KG) Forecast by Distribution, 2017 to 2033
Nandini Roy Choudhury

Principal Consultant

Talk to Analyst

Find your sweet spots for generating winning opportunities in this market.

List of Charts

Figure 1: Global Market Value (US$ Million) by Purity grade, 2023 to 2033

Figure 2: Global Market Value (US$ Million) by Application, 2023 to 2033

Figure 3: Global Market Value (US$ Million) by Distribution, 2023 to 2033

Figure 4: Global Market Value (US$ Million) by Region, 2023 to 2033

Figure 5: Global Market Value (US$ Million) Analysis by Region, 2017 to 2033

Figure 6: Global Market Volume (KG) Analysis by Region, 2017 to 2033

Figure 7: Global Market Value Share (%) and BPS Analysis by Region, 2023 to 2033

Figure 8: Global Market Y-o-Y Growth (%) Projections by Region, 2023 to 2033

Figure 9: Global Market Value (US$ Million) Analysis by Purity grade, 2017 to 2033

Figure 10: Global Market Volume (KG) Analysis by Purity grade, 2017 to 2033

Figure 11: Global Market Value Share (%) and BPS Analysis by Purity grade, 2023 to 2033

Figure 12: Global Market Y-o-Y Growth (%) Projections by Purity grade, 2023 to 2033

Figure 13: Global Market Value (US$ Million) Analysis by Application, 2017 to 2033

Figure 14: Global Market Volume (KG) Analysis by Application, 2017 to 2033

Figure 15: Global Market Value Share (%) and BPS Analysis by Application, 2023 to 2033

Figure 16: Global Market Y-o-Y Growth (%) Projections by Application, 2023 to 2033

Figure 17: Global Market Value (US$ Million) Analysis by Distribution, 2017 to 2033

Figure 18: Global Market Volume (KG) Analysis by Distribution, 2017 to 2033

Figure 19: Global Market Value Share (%) and BPS Analysis by Distribution, 2023 to 2033

Figure 20: Global Market Y-o-Y Growth (%) Projections by Distribution, 2023 to 2033

Figure 21: Global Market Attractiveness by Purity grade, 2023 to 2033

Figure 22: Global Market Attractiveness by Application, 2023 to 2033

Figure 23: Global Market Attractiveness by Distribution, 2023 to 2033

Figure 24: Global Market Attractiveness by Region, 2023 to 2033

Figure 25: North America Market Value (US$ Million) by Purity grade, 2023 to 2033

Figure 26: North America Market Value (US$ Million) by Application, 2023 to 2033

Figure 27: North America Market Value (US$ Million) by Distribution, 2023 to 2033

Figure 28: North America Market Value (US$ Million) by Country, 2023 to 2033

Figure 29: North America Market Value (US$ Million) Analysis by Country, 2017 to 2033

Figure 30: North America Market Volume (KG) Analysis by Country, 2017 to 2033

Figure 31: North America Market Value Share (%) and BPS Analysis by Country, 2023 to 2033

Figure 32: North America Market Y-o-Y Growth (%) Projections by Country, 2023 to 2033

Figure 33: North America Market Value (US$ Million) Analysis by Purity grade, 2017 to 2033

Figure 34: North America Market Volume (KG) Analysis by Purity grade, 2017 to 2033

Figure 35: North America Market Value Share (%) and BPS Analysis by Purity grade, 2023 to 2033

Figure 36: North America Market Y-o-Y Growth (%) Projections by Purity grade, 2023 to 2033

Figure 37: North America Market Value (US$ Million) Analysis by Application, 2017 to 2033

Figure 38: North America Market Volume (KG) Analysis by Application, 2017 to 2033

Figure 39: North America Market Value Share (%) and BPS Analysis by Application, 2023 to 2033

Figure 40: North America Market Y-o-Y Growth (%) Projections by Application, 2023 to 2033

Figure 41: North America Market Value (US$ Million) Analysis by Distribution, 2017 to 2033

Figure 42: North America Market Volume (KG) Analysis by Distribution, 2017 to 2033

Figure 43: North America Market Value Share (%) and BPS Analysis by Distribution, 2023 to 2033

Figure 44: North America Market Y-o-Y Growth (%) Projections by Distribution, 2023 to 2033

Figure 45: North America Market Attractiveness by Purity grade, 2023 to 2033

Figure 46: North America Market Attractiveness by Application, 2023 to 2033

Figure 47: North America Market Attractiveness by Distribution, 2023 to 2033

Figure 48: North America Market Attractiveness by Country, 2023 to 2033

Figure 49: Latin America Market Value (US$ Million) by Purity grade, 2023 to 2033

Figure 50: Latin America Market Value (US$ Million) by Application, 2023 to 2033

Figure 51: Latin America Market Value (US$ Million) by Distribution, 2023 to 2033

Figure 52: Latin America Market Value (US$ Million) by Country, 2023 to 2033

Figure 53: Latin America Market Value (US$ Million) Analysis by Country, 2017 to 2033

Figure 54: Latin America Market Volume (KG) Analysis by Country, 2017 to 2033

Figure 55: Latin America Market Value Share (%) and BPS Analysis by Country, 2023 to 2033

Figure 56: Latin America Market Y-o-Y Growth (%) Projections by Country, 2023 to 2033

Figure 57: Latin America Market Value (US$ Million) Analysis by Purity grade, 2017 to 2033

Figure 58: Latin America Market Volume (KG) Analysis by Purity grade, 2017 to 2033

Figure 59: Latin America Market Value Share (%) and BPS Analysis by Purity grade, 2023 to 2033

Figure 60: Latin America Market Y-o-Y Growth (%) Projections by Purity grade, 2023 to 2033

Figure 61: Latin America Market Value (US$ Million) Analysis by Application, 2017 to 2033

Figure 62: Latin America Market Volume (KG) Analysis by Application, 2017 to 2033

Figure 63: Latin America Market Value Share (%) and BPS Analysis by Application, 2023 to 2033

Figure 64: Latin America Market Y-o-Y Growth (%) Projections by Application, 2023 to 2033

Figure 65: Latin America Market Value (US$ Million) Analysis by Distribution, 2017 to 2033

Figure 66: Latin America Market Volume (KG) Analysis by Distribution, 2017 to 2033

Figure 67: Latin America Market Value Share (%) and BPS Analysis by Distribution, 2023 to 2033

Figure 68: Latin America Market Y-o-Y Growth (%) Projections by Distribution, 2023 to 2033

Figure 69: Latin America Market Attractiveness by Purity grade, 2023 to 2033

Figure 70: Latin America Market Attractiveness by Application, 2023 to 2033

Figure 71: Latin America Market Attractiveness by Distribution, 2023 to 2033

Figure 72: Latin America Market Attractiveness by Country, 2023 to 2033

Figure 73: Europe Market Value (US$ Million) by Purity grade, 2023 to 2033

Figure 74: Europe Market Value (US$ Million) by Application, 2023 to 2033

Figure 75: Europe Market Value (US$ Million) by Distribution, 2023 to 2033

Figure 76: Europe Market Value (US$ Million) by Country, 2023 to 2033

Figure 77: Europe Market Value (US$ Million) Analysis by Country, 2017 to 2033

Figure 78: Europe Market Volume (KG) Analysis by Country, 2017 to 2033

Figure 79: Europe Market Value Share (%) and BPS Analysis by Country, 2023 to 2033

Figure 80: Europe Market Y-o-Y Growth (%) Projections by Country, 2023 to 2033

Figure 81: Europe Market Value (US$ Million) Analysis by Purity grade, 2017 to 2033

Figure 82: Europe Market Volume (KG) Analysis by Purity grade, 2017 to 2033

Figure 83: Europe Market Value Share (%) and BPS Analysis by Purity grade, 2023 to 2033

Figure 84: Europe Market Y-o-Y Growth (%) Projections by Purity grade, 2023 to 2033

Figure 85: Europe Market Value (US$ Million) Analysis by Application, 2017 to 2033

Figure 86: Europe Market Volume (KG) Analysis by Application, 2017 to 2033

Figure 87: Europe Market Value Share (%) and BPS Analysis by Application, 2023 to 2033

Figure 88: Europe Market Y-o-Y Growth (%) Projections by Application, 2023 to 2033

Figure 89: Europe Market Value (US$ Million) Analysis by Distribution, 2017 to 2033

Figure 90: Europe Market Volume (KG) Analysis by Distribution, 2017 to 2033

Figure 91: Europe Market Value Share (%) and BPS Analysis by Distribution, 2023 to 2033

Figure 92: Europe Market Y-o-Y Growth (%) Projections by Distribution, 2023 to 2033

Figure 93: Europe Market Attractiveness by Purity grade, 2023 to 2033

Figure 94: Europe Market Attractiveness by Application, 2023 to 2033

Figure 95: Europe Market Attractiveness by Distribution, 2023 to 2033

Figure 96: Europe Market Attractiveness by Country, 2023 to 2033

Figure 97: East Asia Market Value (US$ Million) by Purity grade, 2023 to 2033

Figure 98: East Asia Market Value (US$ Million) by Application, 2023 to 2033

Figure 99: East Asia Market Value (US$ Million) by Distribution, 2023 to 2033

Figure 100: East Asia Market Value (US$ Million) by Country, 2023 to 2033

Figure 101: East Asia Market Value (US$ Million) Analysis by Country, 2017 to 2033

Figure 102: East Asia Market Volume (KG) Analysis by Country, 2017 to 2033

Figure 103: East Asia Market Value Share (%) and BPS Analysis by Country, 2023 to 2033

Figure 104: East Asia Market Y-o-Y Growth (%) Projections by Country, 2023 to 2033

Figure 105: East Asia Market Value (US$ Million) Analysis by Purity grade, 2017 to 2033

Figure 106: East Asia Market Volume (KG) Analysis by Purity grade, 2017 to 2033

Figure 107: East Asia Market Value Share (%) and BPS Analysis by Purity grade, 2023 to 2033

Figure 108: East Asia Market Y-o-Y Growth (%) Projections by Purity grade, 2023 to 2033

Figure 109: East Asia Market Value (US$ Million) Analysis by Application, 2017 to 2033

Figure 110: East Asia Market Volume (KG) Analysis by Application, 2017 to 2033

Figure 111: East Asia Market Value Share (%) and BPS Analysis by Application, 2023 to 2033

Figure 112: East Asia Market Y-o-Y Growth (%) Projections by Application, 2023 to 2033

Figure 113: East Asia Market Value (US$ Million) Analysis by Distribution, 2017 to 2033

Figure 114: East Asia Market Volume (KG) Analysis by Distribution, 2017 to 2033

Figure 115: East Asia Market Value Share (%) and BPS Analysis by Distribution, 2023 to 2033

Figure 116: East Asia Market Y-o-Y Growth (%) Projections by Distribution, 2023 to 2033

Figure 117: East Asia Market Attractiveness by Purity grade, 2023 to 2033

Figure 118: East Asia Market Attractiveness by Application, 2023 to 2033

Figure 119: East Asia Market Attractiveness by Distribution, 2023 to 2033

Figure 120: East Asia Market Attractiveness by Country, 2023 to 2033

Figure 121: South Asia Market Value (US$ Million) by Purity grade, 2023 to 2033

Figure 122: South Asia Market Value (US$ Million) by Application, 2023 to 2033

Figure 123: South Asia Market Value (US$ Million) by Distribution, 2023 to 2033

Figure 124: South Asia Market Value (US$ Million) by Country, 2023 to 2033

Figure 125: South Asia Market Value (US$ Million) Analysis by Country, 2017 to 2033

Figure 126: South Asia Market Volume (KG) Analysis by Country, 2017 to 2033

Figure 127: South Asia Market Value Share (%) and BPS Analysis by Country, 2023 to 2033

Figure 128: South Asia Market Y-o-Y Growth (%) Projections by Country, 2023 to 2033

Figure 129: South Asia Market Value (US$ Million) Analysis by Purity grade, 2017 to 2033

Figure 130: South Asia Market Volume (KG) Analysis by Purity grade, 2017 to 2033

Figure 131: South Asia Market Value Share (%) and BPS Analysis by Purity grade, 2023 to 2033

Figure 132: South Asia Market Y-o-Y Growth (%) Projections by Purity grade, 2023 to 2033

Figure 133: South Asia Market Value (US$ Million) Analysis by Application, 2017 to 2033

Figure 134: South Asia Market Volume (KG) Analysis by Application, 2017 to 2033

Figure 135: South Asia Market Value Share (%) and BPS Analysis by Application, 2023 to 2033

Figure 136: South Asia Market Y-o-Y Growth (%) Projections by Application, 2023 to 2033

Figure 137: South Asia Market Value (US$ Million) Analysis by Distribution, 2017 to 2033

Figure 138: South Asia Market Volume (KG) Analysis by Distribution, 2017 to 2033

Figure 139: South Asia Market Value Share (%) and BPS Analysis by Distribution, 2023 to 2033

Figure 140: South Asia Market Y-o-Y Growth (%) Projections by Distribution, 2023 to 2033

Figure 141: South Asia Market Attractiveness by Purity grade, 2023 to 2033

Figure 142: South Asia Market Attractiveness by Application, 2023 to 2033

Figure 143: South Asia Market Attractiveness by Distribution, 2023 to 2033

Figure 144: South Asia Market Attractiveness by Country, 2023 to 2033

Figure 145: Oceania Market Value (US$ Million) by Purity grade, 2023 to 2033

Figure 146: Oceania Market Value (US$ Million) by Application, 2023 to 2033

Figure 147: Oceania Market Value (US$ Million) by Distribution, 2023 to 2033

Figure 148: Oceania Market Value (US$ Million) by Country, 2023 to 2033

Figure 149: Oceania Market Value (US$ Million) Analysis by Country, 2017 to 2033

Figure 150: Oceania Market Volume (KG) Analysis by Country, 2017 to 2033

Figure 151: Oceania Market Value Share (%) and BPS Analysis by Country, 2023 to 2033

Figure 152: Oceania Market Y-o-Y Growth (%) Projections by Country, 2023 to 2033

Figure 153: Oceania Market Value (US$ Million) Analysis by Purity grade, 2017 to 2033

Figure 154: Oceania Market Volume (KG) Analysis by Purity grade, 2017 to 2033

Figure 155: Oceania Market Value Share (%) and BPS Analysis by Purity grade, 2023 to 2033

Figure 156: Oceania Market Y-o-Y Growth (%) Projections by Purity grade, 2023 to 2033

Figure 157: Oceania Market Value (US$ Million) Analysis by Application, 2017 to 2033

Figure 158: Oceania Market Volume (KG) Analysis by Application, 2017 to 2033

Figure 159: Oceania Market Value Share (%) and BPS Analysis by Application, 2023 to 2033

Figure 160: Oceania Market Y-o-Y Growth (%) Projections by Application, 2023 to 2033

Figure 161: Oceania Market Value (US$ Million) Analysis by Distribution, 2017 to 2033

Figure 162: Oceania Market Volume (KG) Analysis by Distribution, 2017 to 2033

Figure 163: Oceania Market Value Share (%) and BPS Analysis by Distribution, 2023 to 2033

Figure 164: Oceania Market Y-o-Y Growth (%) Projections by Distribution, 2023 to 2033

Figure 165: Oceania Market Attractiveness by Purity grade, 2023 to 2033

Figure 166: Oceania Market Attractiveness by Application, 2023 to 2033

Figure 167: Oceania Market Attractiveness by Distribution, 2023 to 2033

Figure 168: Oceania Market Attractiveness by Country, 2023 to 2033

Figure 169: MEA Market Value (US$ Million) by Purity grade, 2023 to 2033

Figure 170: MEA Market Value (US$ Million) by Application, 2023 to 2033

Figure 171: MEA Market Value (US$ Million) by Distribution, 2023 to 2033

Figure 172: MEA Market Value (US$ Million) by Country, 2023 to 2033

Figure 173: MEA Market Value (US$ Million) Analysis by Country, 2017 to 2033

Figure 174: MEA Market Volume (KG) Analysis by Country, 2017 to 2033

Figure 175: MEA Market Value Share (%) and BPS Analysis by Country, 2023 to 2033

Figure 176: MEA Market Y-o-Y Growth (%) Projections by Country, 2023 to 2033

Figure 177: MEA Market Value (US$ Million) Analysis by Purity grade, 2017 to 2033

Figure 178: MEA Market Volume (KG) Analysis by Purity grade, 2017 to 2033

Figure 179: MEA Market Value Share (%) and BPS Analysis by Purity grade, 2023 to 2033

Figure 180: MEA Market Y-o-Y Growth (%) Projections by Purity grade, 2023 to 2033

Figure 181: MEA Market Value (US$ Million) Analysis by Application, 2017 to 2033

Figure 182: MEA Market Volume (KG) Analysis by Application, 2017 to 2033

Figure 183: MEA Market Value Share (%) and BPS Analysis by Application, 2023 to 2033

Figure 184: MEA Market Y-o-Y Growth (%) Projections by Application, 2023 to 2033

Figure 185: MEA Market Value (US$ Million) Analysis by Distribution, 2017 to 2033

Figure 186: MEA Market Volume (KG) Analysis by Distribution, 2017 to 2033

Figure 187: MEA Market Value Share (%) and BPS Analysis by Distribution, 2023 to 2033

Figure 188: MEA Market Y-o-Y Growth (%) Projections by Distribution, 2023 to 2033

Figure 189: MEA Market Attractiveness by Purity grade, 2023 to 2033

Figure 190: MEA Market Attractiveness by Application, 2023 to 2033

Figure 191: MEA Market Attractiveness by Distribution, 2023 to 2033

Figure 192: MEA Market Attractiveness by Country, 2023 to 2033

Recommendations

Food and Beverage

Flavored Butter And Oils Market

Published : August 2023

Food and Beverage

Chocolate Inclusions and Decorations Market

Published : July 2023

Food and Beverage

Flavor and Flavor Enhancers Market

Published : September 2022

Food and Beverage

Flavor Modulator Market

Published : June 2022

Explore Food and Beverage Insights

View Reports