Geosynthetics Market Size and Share Forecast Outlook 2025 to 2035

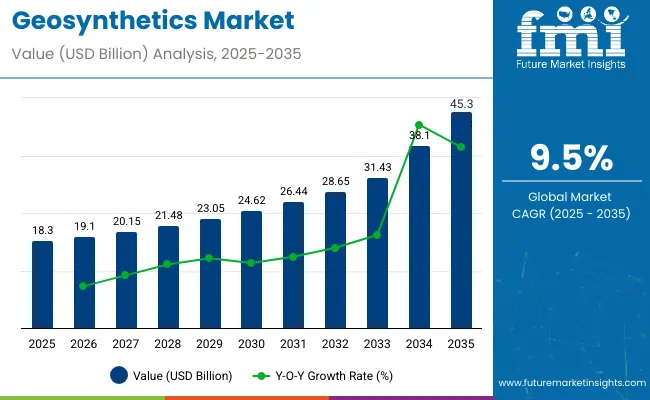
The global geosynthetics market is projected to be valued at USD 18.3 billion in 2025 and reach USD 45.3 billion by 2035, registering a compound annual growth rate (CAGR) of 9.5% over the forecast period. Demand growth is being shaped by infrastructure expansion, waste containment requirements, and increasing regulatory pressure on construction and environmental performance standards.
Quick Stats for the Geosynthetics Market

  • Industry Value (2025): USD 18.3 billion
  • Forecast Value (2035): USD 45.3 billion
  • Forecast CAGR: 9.5%
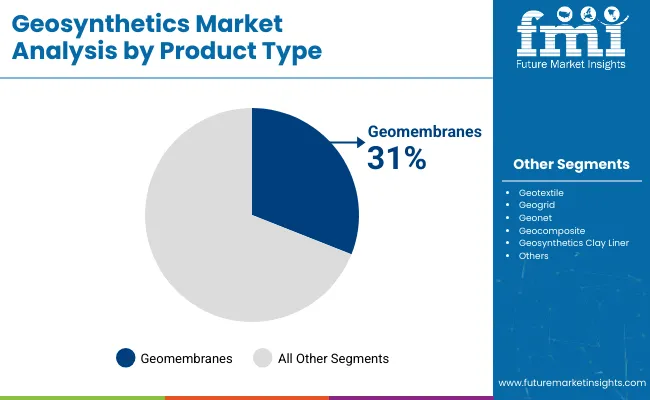
  • Leading Segment in 2025: Geomembranes (31%)
  • Key Growth Region: Infrastructure and Environmental Projects (China, India, EU)
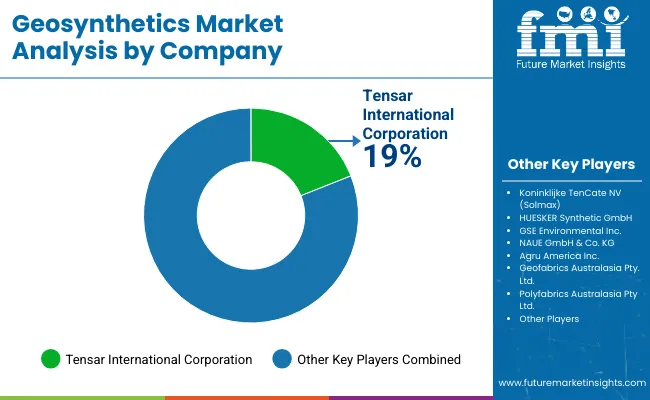
  • Top Key Players: Solmax (TenCate), HUESKER, GSE Environmental, NAUE, Tensar

Geosynthetics Market

Metrics Value
Industry Size (2025E) USD 18.3 Billion
Industry Value (2035F) USD 45.3 Billion
CAGR (2025 to 2035) 9.5%

Geosynthetics, including geotextiles, geomembranes, geogrids, and geonets, are being deployed across applications such as roadways, railways, landfills, mining, and coastal engineering. In transportation infrastructure, these products are being used to enhance soil stability and prevent erosion, enabling longer service life of paved and unpaved surfaces. The USA Department of Transportation (DOT) has issued technical guidance on the use of geotextiles in highway construction under FHWA specifications, supporting their adoption in federal and state-funded road projects.

In landfill construction, geosynthetics are being applied in base liners and capping systems to meet containment and leachate control requirements. According to data published by the Solid Waste Association of North America (SWANA), the adoption of geomembranes in landfill applications has grown in response to stricter state-level permitting requirements for municipal solid waste (MSW) facilities.

The construction sector in China and India is witnessing an expansion in the use of geosynthetics due to government investment in road building and erosion control. In 2023, the Ministry of Road Transport and Highways (MoRTH) in India endorsed the use of geotextiles under the Bharatmala project to stabilize slopes and improve drainage in hilly terrain. Similar initiatives have been launched in the European Union under the Green Infrastructure Strategy, encouraging the use of geosynthetics to meet flood control and soil reinforcement objectives.

In the oil and gas sector, geomembranes are being deployed in containment ponds and secondary spill prevention systems. Producers such as Solmax and Atarfil have reported increased demand from North American shale operators seeking to reduce surface water contamination risks.

Investments in product development by key manufacturers are supporting broader deployment. Manufacturers including TenCate, NAUE, and Fibertex have released new woven and non-woven geotextile products with improved permeability and tensile strength for high-load applications.

Demand is expected to remain supported by continued infrastructure investment, stricter environmental regulations, and broader adoption across civil engineering and waste containment projects.

Analyzing Geosynthetics Market by Top Investment Segments

Geomembranes to dominate product demand due to their critical role in containment, environmental protection, and infrastructure development

Geomembranes are estimated to account for approximately 31% of the global geosynthetics market share in 2025 and are projected to grow at a CAGR of 9.6% through 2035. These impermeable sheets are extensively used in landfill liners, mining leach pads, wastewater treatment facilities, and water reservoirs to prevent fluid migration and soil contamination.

The segment continues to benefit from stringent environmental regulations and global investments in waste management and water infrastructure. Advancements in multi-layered geomembrane structures and the integration of barrier-enhancing additives are further strengthening their use in long-term containment and geotechnical stability applications.
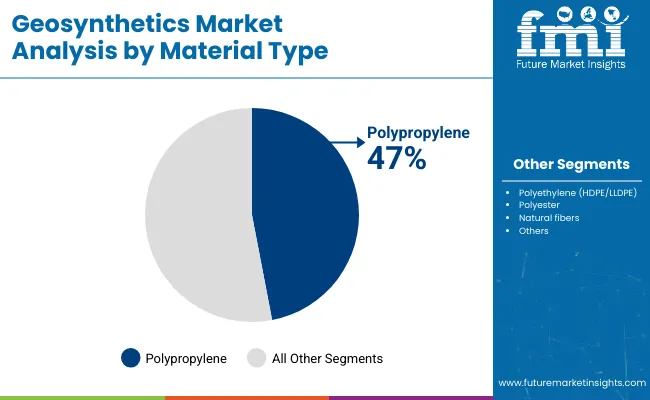
Polypropylene is expected to lead material adoption dgue to its balance of mechanical strength, chemical resistance, and cost-efficiency

Polypropylene is projected to hold approximately 47% of the global geosynthetics market share in 2025 and is expected to grow at a CAGR of 9.7% through 2035. This thermoplastic polymer is widely used in geotextiles, geogrids, and geocomposites due to its high tensile strength, UV resistance, and inert behavior in chemically aggressive environments.

Polypropylene-based geosynthetics are commonly applied in road construction, coastal protection, and erosion control systems. As infrastructure development accelerates in emerging economies and governments emphasize the use of long-life, sustainable materials, polypropylene remains the preferred choice for geotechnical engineering and civil construction projects.

Challenges and Opportunities

Challenge

Ever-Changing Prices of Raw Materials and Unstable Supply Chain

Potential challenges in the Geosynthetics Market include uneven raw material, strict rules & regulations and various quality in places. Geosynthetics are produced from polymeric materials, for example, polyethylene, polypropylene, etc., and their prices are associated with the price of crude oil, leading to the fluctuation of prices.

Besides that, strict environment legislation specific to plastic-based materials is a magnet for market growth, thereby pushing suppliers to create sustainable substitutes. Moreover, the industry faces challenges relating to uncoordinated international testing and performance certifications, posing challenges for global companies to navigate different and divergent regulations.

It is important for companies to conduct research to have bio-based geosynthetics as alternative solutions, optimize raw material procurement strategies and recommend uniform global standards that adequately streamline compliance processes.

Opportunity

Architectural Development and Green Building Initiatives

Geosynthetics Market the increasing need for geosynthetics in infrastructure projects and environmental sustainability creates new growth opportunities for the market. Geosynthetics are essential during the construction of structures as they are used for soil stabilization, drainage systems, control of erosion, protection of landfill, etc.

The increasing investments of governments across the globe in smart city development, transportation networks and water management projects will drive geosynthetics adoption. Linked to this, the movement towards sustainable construction materials has driven greater interest in geosynthetics, which can be produced from both recycled and biodegradable polymers.

In this evolving market, companies that innovate in product durability, green geosynthetics, and digital monitoring technologies for geotechnical applications will gain a competitive advantage.
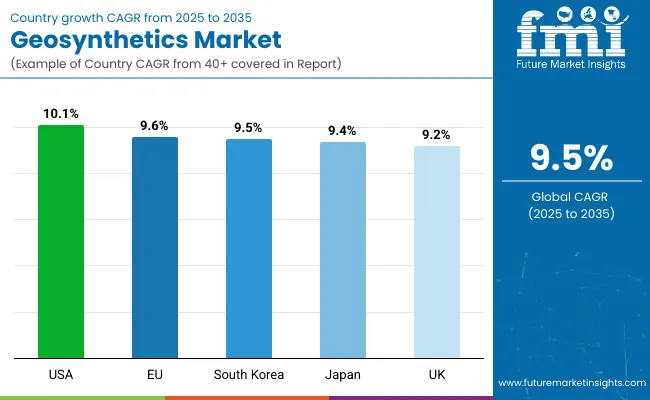
Country wise outlook

United States

The USA geosynthetics market is at a high growth phase owing to rising investments in modernization of infrastructures, broader environmental regulations, and greater demand for erosion control solutions. Increased spending for highway, flood management, and soil stabilization projects under the Bipartisan Infrastructure Law (BIL) will lead to an incremental growth in demand for geosynthetics such as geotextiles, geogrids and geomembranes.

Another driving factor is the waste management sector, wherein geosynthetics are used for landfill liners and hazardous waste containment and groundwater protection. Furthermore, coastal protection initiatives and climate resilience projects are creating new avenues for application of geosynthetics in shoreline stabilization reasons.

The USA market is projected to increase strongly with continued federal funding of sustainable infrastructure and innovation of high-performance geosynthetics.

Country CAGR (2025 to 2035)
USA 10.1%

United Kingdom

The United Kingdom geosynthetics market is projected to grow on account of increasing adoption of sustainable construction materials, rising applications for flood protection projects as well as growing use of geosynthetics in transportation infrastructure. Extensive soil, water and storage-based applications using advanced geosynthetics systems have also been recognized and recommended in the UK government's National Infrastructure Strategy throughout rail, road and urban draining projects.

The waste management sector has also experienced an increased adoption of geosynthetics, especially in landfill liners and capping systems. This will solely be used to reduce carbon footprints in construction like the United Kingdom thereby increasing the use of recycled and biodegradable geosynthetics materials.

Investment in green infrastructure and climate adaptation solutions are expected to grow steadily in the UK geosynthetics market.

Country CAGR (2025 to 2035)
UK 9.2%

European Union

The growth of the geosynthetics market in Europe is driven by stringent environmental regulations, increasing infrastructure projects, and growing use of geosynthetics for, erosion control and water management applications. Some of the prominent market-supported nations are based on Germany, Italy & France putting forth an exponential growth of geosynthetics applicative practices in road construction, railways, and coastal defence tasks.

EU initiatives like the circular economy action plan and green deal are pushing the use of a more sustainable, recyclablable geosynthetics particularly, in the waste management and construction sectors. As a pioneer in engineering and environmental sustainability, Germany is making significant investments in geogrids, geomembranes, and geocells to be used for slope stabilization, landfill protection, and flood mitigation.

The EU geosynthetics market is expected to perform well due to this market growth, as geosynthetics materials are getting advanced with each passing day with the increasing use in climate resilience projects.

Country CAGR (2025 to 2035)
European Union (EU) 9.6%

Japan

Growth of the Japanese geosynthetics industry is driven by increasing investment in disaster preparedness, upgrade of infrastructure, and environmental safeguards. Japan’s chronic earthquakes, typhoons, and landslides have driven the demand for geosynthetics in slope stabilization, embankment reinforcement, and coastal protection projects.

As part of urban development and smart city projects, geotextiles and geogrids are capturing their place in the Japanese construction industry by improving durability and minimizing maintenance costs. The country's emphasis on sustainable waste management is boosting geosynthetic use in landfill containment and wastewater treatment applications.

Japanese geosynthetics market will be growing steadily due to the continuous developments in earthquake resistant infrastructures and climate adaptation solutions.

Country CAGR (2025 to 2035)
Japan 9.4%

South Korea

The South Korea Geosynthetics market is growing at a steeper pace and to reach its full potential, the market is driven primarily by government investments in the infrastructure, increased applications in the mining and land reclamation and growing demand for sustainable construction solutions that reduce the environment.

Smart Infrastructure and Green New Deal initiatives from the South Korean government are helping to drive the use of geosynthetics for roads, tunnels and embankment reinforcement.

The mining industry, which relies heavily on geomembranes and geotextiles for tailings and environment solutions, is also a significant contributor. The growing industrial waste management also fuels the demand for geosynthetics liners and drainage solutions with better performances.

South Korean geosynthetics market is forecast to showcase their bright spot with continued infrastructure upgrades and climate resilience expands.

Country CAGR (2025 to 2035)
South Korea 9.5%

Competitive Outlook

Key players are introducing specialized product lines to serve infrastructure projects, providing cost-effective and durable solutions in geotextiles, geogrids, and erosion control. Manufacturers are focusing on quality control, maintaining local inventories, and offering responsive technical support to meet the growing needs of contractors and engineering firms. The market is also witnessing a shift towards applications in soil stabilization, separation, filtration, and reinforcement for road, rail, and coastal infrastructure projects.

  • In July 2024, Wrekin Products was reported to have launched Geoworks, a dedicated geosynthetics brand aimed at streamlining its offering of geotextiles, geogrids, and erosion control products. The product line was developed to support road, rail, and coastal infrastructure projects with cost-effective, durable geosynthetic solutions. It was stated that Geoworks would serve as a central brand identity across Wrekin’s civil engineering product portfolio.
  • In July 2024, GeoWorks was reported to have rolled out a comprehensive new range of geosynthetics, including woven and nonwoven geotextiles, geogrids, and drainage composites. The portfolio was tailored for applications in soil stabilization, separation, filtration, and reinforcement across infrastructure and environmental projects. It was stated that the brand emphasized quality control, UK-based inventory, and responsive technical support to meet contractor and engineering firm needs.

Companies

  • Koninklijke TenCate NV (Solmax)
  • Tensar International Corporation
  • HUESKER Synthetic GmbH
  • GSE Environmental Inc.
  • NAUE GmbH & Co. KG
  • Agru America Inc.
  • Geofabrics Australasia Pty. Ltd.
  • Polyfabrics Australasia Pty Ltd.
  • Global Synthetics Pty Ltd.
  • Enviro Geosynthetics Pvt. Ltd.

Key Segmentation

By Product Type:

  • Geotextile
  • Geomembrane
  • Geogrid
  • Geonet
  • Geocomposite
  • Geosynthetics Clay Liner
  • Others

By Material Type:

  • Polyethylene (HDPE/LLDPE)
  • Polypropylene (PP)
  • Polyester
  • Natural fibers
  • Others

By Primary Application:

  • Separation
  • Drainage & Filtration
  • Reinforcement
  • Containment

By End Use:

  • Roads (paved & unpaved)
  • Railways
  • Retaining walls
  • Waterworks and waste treatments
  • Landfill & erosion control
  • Others

By Region:

  • North America
  • Latin America
  • Western Europe
  • Eastern Europe
  • South Asia and Pacific
  • East Asia
  • Middle East and Africa

Table of Content

  1. Executive Summary
  2. Industry Introduction, including Taxonomy and Market Definition
  3. Market Trends and Success Factors, including Macro-economic Factors, Market Dynamics, and Recent Industry Developments
  4. Global Market Demand Analysis 2020 to 2024 and Forecast 2025 to 2035, including Historical Analysis and Future Projections
  5. Pricing Analysis
  6. Global Market Analysis 2020 to 2024 and Forecast 2025 to 2035
    • Product Type
    • Material Type
    • Primary Application
    • End Use
  7. Global Market Analysis 2020 to 2024 and Forecast 2025 to 2035, By Product Type
    • Geotextile
    • Geomembrane
    • Geogrid
    • Geonet
    • Geocomposite
    • Geosynthetics Clay Liner
    • Others
  8. Global Market Analysis 2020 to 2024 and Forecast 2025 to 2035, By Material Type
    • Polyethylene (HDPE/LLDPE)
    • Polypropylene (PP)
    • Polyester
    • Natural fibers
    • Others
  9. Global Market Analysis 2020 to 2024 and Forecast 2025 to 2035, By Primary Application
    • Separation
    • Drainage & Filtration
    • Reinforcement
    • Containment
  10. Global Market Analysis 2020 to 2024 and Forecast 2025 to 2035, By End Use
    • Roads (paved & unpaved)
    • Railways
    • Retaining walls
    • Waterworks and waste treatments
    • Landfill & erosion control
    • Others
  11. Global Market Analysis 2020 to 2024 and Forecast 2025 to 2035, By Region
    • North America
    • Latin America
    • Western Europe
    • Eastern Europe
    • East Asia
    • South Asia Pacific
    • Middle East and Africa
  12. North America Sales Analysis 2020 to 2024 and Forecast 2025 to 2035, by Key Segments and Countries
  13. Latin America Sales Analysis 2020 to 2024 and Forecast 2025 to 2035, by Key Segments and Countries
  14. Western Europe Sales Analysis 2020 to 2024 and Forecast 2025 to 2035, by Key Segments and Countries
  15. Eastern Europe Sales Analysis 2020 to 2024 and Forecast 2025 to 2035, by Key Segments and Countries
  16. East Asia Sales Analysis 2020 to 2024 and Forecast 2025 to 2035, by Key Segments and Countries
  17. South Asia Pacific Sales Analysis 2020 to 2024 and Forecast 2025 to 2035, by Key Segments and Countries
  18. Middle East and Africa Sales Analysis 2020 to 2024 and Forecast 2025 to 2035, by Key Segments and Countries
  19. Sales Forecast 2025 to 2035 by Product Type, Material Type, Primary Application, and End Use for 30 Countries
  20. Competition Outlook, including Market Structure Analysis, Company Share Analysis by Key Players, and Competition Dashboard
  21. Company Profile
    • AGRU Kunststofftechnik GmbH
    • Low & Bonar PLC
    • Tensar Corporation
    • Raven Industries, Inc.
    • Thrace Group
    • GSE Environmental Inc.
    • Officine Maccaferri S.p.A.
    • Koninklijke Ten Cate B.V.
    • HUESKER Synthetic GmbH
    • Solmax International Inc.

List of Tables

  • Table 1: Global Market Value (USD Million) Forecast by Region, 2020 to 2035
  • Table 2: Global Market Volume (Sq. Meter) Forecast by Region, 2020 to 2035
  • Table 3: Global Market Value (USD Million) Forecast by Product Type, 2020 to 2035
  • Table 4: Global Market Volume (Sq. Meter) Forecast by Product Type, 2020 to 2035
  • Table 5: Global Market Value (USD Million) Forecast by Material Type, 2020 to 2035
  • Table 6: Global Market Volume (Sq. Meter) Forecast by Material Type, 2020 to 2035
  • Table 7: Global Market Value (USD Million) Forecast by Primary Application, 2020 to 2035
  • Table 8: Global Market Volume (Sq. Meter) Forecast by Primary Application, 2020 to 2035
  • Table 9: Global Market Value (USD Million) Forecast by End-use, 2020 to 2035
  • Table 10: Global Market Volume (Sq. Meter) Forecast by End-use, 2020 to 2035
  • Table 11: North America Market Value (USD Million) Forecast by Country, 2020 to 2035
  • Table 12: North America Market Volume (Sq. Meter) Forecast by Country, 2020 to 2035
  • Table 13: North America Market Value (USD Million) Forecast by Product Type, 2020 to 2035
  • Table 14: North America Market Volume (Sq. Meter) Forecast by Product Type, 2020 to 2035
  • Table 15: North America Market Value (USD Million) Forecast by Material Type, 2020 to 2035
  • Table 16: North America Market Volume (Sq. Meter) Forecast by Material Type, 2020 to 2035
  • Table 17: North America Market Value (USD Million) Forecast by Primary Application, 2020 to 2035
  • Table 18: North America Market Volume (Sq. Meter) Forecast by Primary Application, 2020 to 2035
  • Table 19: North America Market Value (USD Million) Forecast by End-use, 2020 to 2035
  • Table 20: North America Market Volume (Sq. Meter) Forecast by End-use, 2020 to 2035
  • Table 21: Latin America Market Value (USD Million) Forecast by Country, 2020 to 2035
  • Table 22: Latin America Market Volume (Sq. Meter) Forecast by Country, 2020 to 2035
  • Table 23: Latin America Market Value (USD Million) Forecast by Product Type, 2020 to 2035
  • Table 24: Latin America Market Volume (Sq. Meter) Forecast by Product Type, 2020 to 2035
  • Table 25: Latin America Market Value (USD Million) Forecast by Material Type, 2020 to 2035
  • Table 26: Latin America Market Volume (Sq. Meter) Forecast by Material Type, 2020 to 2035
  • Table 27: Latin America Market Value (USD Million) Forecast by Primary Application, 2020 to 2035
  • Table 28: Latin America Market Volume (Sq. Meter) Forecast by Primary Application, 2020 to 2035
  • Table 29: Latin America Market Value (USD Million) Forecast by End-use, 2020 to 2035
  • Table 30: Latin America Market Volume (Sq. Meter) Forecast by End-use, 2020 to 2035
  • Table 31: Western Europe Market Value (USD Million) Forecast by Country, 2020 to 2035
  • Table 32: Western Europe Market Volume (Sq. Meter) Forecast by Country, 2020 to 2035
  • Table 33: Western Europe Market Value (USD Million) Forecast by Product Type, 2020 to 2035
  • Table 34: Western Europe Market Volume (Sq. Meter) Forecast by Product Type, 2020 to 2035
  • Table 35: Western Europe Market Value (USD Million) Forecast by Material Type, 2020 to 2035
  • Table 36: Western Europe Market Volume (Sq. Meter) Forecast by Material Type, 2020 to 2035
  • Table 37: Western Europe Market Value (USD Million) Forecast by Primary Application, 2020 to 2035
  • Table 38: Western Europe Market Volume (Sq. Meter) Forecast by Primary Application, 2020 to 2035
  • Table 39: Western Europe Market Value (USD Million) Forecast by End-use, 2020 to 2035
  • Table 40: Western Europe Market Volume (Sq. Meter) Forecast by End-use, 2020 to 2035
  • Table 41: Eastern Europe Market Value (USD Million) Forecast by Country, 2020 to 2035
  • Table 42: Eastern Europe Market Volume (Sq. Meter) Forecast by Country, 2020 to 2035
  • Table 43: Eastern Europe Market Value (USD Million) Forecast by Product Type, 2020 to 2035
  • Table 44: Eastern Europe Market Volume (Sq. Meter) Forecast by Product Type, 2020 to 2035
  • Table 45: Eastern Europe Market Value (USD Million) Forecast by Material Type, 2020 to 2035
  • Table 46: Eastern Europe Market Volume (Sq. Meter) Forecast by Material Type, 2020 to 2035
  • Table 47: Eastern Europe Market Value (USD Million) Forecast by Primary Application, 2020 to 2035
  • Table 48: Eastern Europe Market Volume (Sq. Meter) Forecast by Primary Application, 2020 to 2035
  • Table 49: Eastern Europe Market Value (USD Million) Forecast by End-use, 2020 to 2035
  • Table 50: Eastern Europe Market Volume (Sq. Meter) Forecast by End-use, 2020 to 2035
  • Table 51: South Asia and Pacific Market Value (USD Million) Forecast by Country, 2020 to 2035
  • Table 52: South Asia and Pacific Market Volume (Sq. Meter) Forecast by Country, 2020 to 2035
  • Table 53: South Asia and Pacific Market Value (USD Million) Forecast by Product Type, 2020 to 2035
  • Table 54: South Asia and Pacific Market Volume (Sq. Meter) Forecast by Product Type, 2020 to 2035
  • Table 55: South Asia and Pacific Market Value (USD Million) Forecast by Material Type, 2020 to 2035
  • Table 56: South Asia and Pacific Market Volume (Sq. Meter) Forecast by Material Type, 2020 to 2035
  • Table 57: South Asia and Pacific Market Value (USD Million) Forecast by Primary Application, 2020 to 2035
  • Table 58: South Asia and Pacific Market Volume (Sq. Meter) Forecast by Primary Application, 2020 to 2035
  • Table 59: South Asia and Pacific Market Value (USD Million) Forecast by End-use, 2020 to 2035
  • Table 60: South Asia and Pacific Market Volume (Sq. Meter) Forecast by End-use, 2020 to 2035
  • Table 61: East Asia Market Value (USD Million) Forecast by Country, 2020 to 2035
  • Table 62: East Asia Market Volume (Sq. Meter) Forecast by Country, 2020 to 2035
  • Table 63: East Asia Market Value (USD Million) Forecast by Product Type, 2020 to 2035
  • Table 64: East Asia Market Volume (Sq. Meter) Forecast by Product Type, 2020 to 2035
  • Table 65: East Asia Market Value (USD Million) Forecast by Material Type, 2020 to 2035
  • Table 66: East Asia Market Volume (Sq. Meter) Forecast by Material Type, 2020 to 2035
  • Table 67: East Asia Market Value (USD Million) Forecast by Primary Application, 2020 to 2035
  • Table 68: East Asia Market Volume (Sq. Meter) Forecast by Primary Application, 2020 to 2035
  • Table 69: East Asia Market Value (USD Million) Forecast by End-use, 2020 to 2035
  • Table 70: East Asia Market Volume (Sq. Meter) Forecast by End-use, 2020 to 2035
  • Table 71: Middle East and Africa Market Value (USD Million) Forecast by Country, 2020 to 2035
  • Table 72: Middle East and Africa Market Volume (Sq. Meter) Forecast by Country, 2020 to 2035
  • Table 73: Middle East and Africa Market Value (USD Million) Forecast by Product Type, 2020 to 2035
  • Table 74: Middle East and Africa Market Volume (Sq. Meter) Forecast by Product Type, 2020 to 2035
  • Table 75: Middle East and Africa Market Value (USD Million) Forecast by Material Type, 2020 to 2035
  • Table 76: Middle East and Africa Market Volume (Sq. Meter) Forecast by Material Type, 2020 to 2035
  • Table 77: Middle East and Africa Market Value (USD Million) Forecast by Primary Application, 2020 to 2035
  • Table 78: Middle East and Africa Market Volume (Sq. Meter) Forecast by Primary Application, 2020 to 2035
  • Table 79: Middle East and Africa Market Value (USD Million) Forecast by End-use, 2020 to 2035
  • Table 80: Middle East and Africa Market Volume (Sq. Meter) Forecast by End-use, 2020 to 2035

List of Figures

  • Figure 1: Global Market Value (USD Million) by Product Type, 2025 to 2035
  • Figure 2: Global Market Value (USD Million) by Material Type, 2025 to 2035
  • Figure 3: Global Market Value (USD Million) by Primary Application, 2025 to 2035
  • Figure 4: Global Market Value (USD Million) by End-use, 2025 to 2035
  • Figure 5: Global Market Value (USD Million) by Region, 2025 to 2035
  • Figure 6: Global Market Value (USD Million) Analysis by Region, 2020 to 2035
  • Figure 7: Global Market Volume (Sq. Meter) Analysis by Region, 2020 to 2035
  • Figure 8: Global Market Value Share (%) and BPS Analysis by Region, 2025 to 2035
  • Figure 9: Global Market Y-o-Y Growth (%) Projections by Region, 2025 to 2035
  • Figure 10: Global Market Value (USD Million) Analysis by Product Type, 2020 to 2035
  • Figure 11: Global Market Volume (Sq. Meter) Analysis by Product Type, 2020 to 2035
  • Figure 12: Global Market Value Share (%) and BPS Analysis by Product Type, 2025 to 2035
  • Figure 13: Global Market Y-o-Y Growth (%) Projections by Product Type, 2025 to 2035
  • Figure 14: Global Market Value (USD Million) Analysis by Material Type, 2020 to 2035
  • Figure 15: Global Market Volume (Sq. Meter) Analysis by Material Type, 2020 to 2035
  • Figure 16: Global Market Value Share (%) and BPS Analysis by Material Type, 2025 to 2035
  • Figure 17: Global Market Y-o-Y Growth (%) Projections by Material Type, 2025 to 2035
  • Figure 18: Global Market Value (USD Million) Analysis by Primary Application, 2020 to 2035
  • Figure 19: Global Market Volume (Sq. Meter) Analysis by Primary Application, 2020 to 2035
  • Figure 20: Global Market Value Share (%) and BPS Analysis by Primary Application, 2025 to 2035
  • Figure 21: Global Market Y-o-Y Growth (%) Projections by Primary Application, 2025 to 2035
  • Figure 22: Global Market Value (USD Million) Analysis by End-use, 2020 to 2035
  • Figure 23: Global Market Volume (Sq. Meter) Analysis by End-use, 2020 to 2035
  • Figure 24: Global Market Value Share (%) and BPS Analysis by End-use, 2025 to 2035
  • Figure 25: Global Market Y-o-Y Growth (%) Projections by End-use, 2025 to 2035
  • Figure 26: Global Market Attractiveness by Product Type, 2025 to 2035
  • Figure 27: Global Market Attractiveness by Material Type, 2025 to 2035
  • Figure 28: Global Market Attractiveness by Primary Application, 2025 to 2035
  • Figure 29: Global Market Attractiveness by End-use, 2025 to 2035
  • Figure 30: Global Market Attractiveness by Region, 2025 to 2035
  • Figure 31: North America Market Value (USD Million) by Product Type, 2025 to 2035
  • Figure 32: North America Market Value (USD Million) by Material Type, 2025 to 2035
  • Figure 33: North America Market Value (USD Million) by Primary Application, 2025 to 2035
  • Figure 34: North America Market Value (USD Million) by End-use, 2025 to 2035
  • Figure 35: North America Market Value (USD Million) by Country, 2025 to 2035
  • Figure 36: North America Market Value (USD Million) Analysis by Country, 2020 to 2035
  • Figure 37: North America Market Volume (Sq. Meter) Analysis by Country, 2020 to 2035
  • Figure 38: North America Market Value Share (%) and BPS Analysis by Country, 2025 to 2035
  • Figure 39: North America Market Y-o-Y Growth (%) Projections by Country, 2025 to 2035
  • Figure 40: North America Market Value (USD Million) Analysis by Product Type, 2020 to 2035
  • Figure 41: North America Market Volume (Sq. Meter) Analysis by Product Type, 2020 to 2035
  • Figure 42: North America Market Value Share (%) and BPS Analysis by Product Type, 2025 to 2035
  • Figure 43: North America Market Y-o-Y Growth (%) Projections by Product Type, 2025 to 2035
  • Figure 44: North America Market Value (USD Million) Analysis by Material Type, 2020 to 2035
  • Figure 45: North America Market Volume (Sq. Meter) Analysis by Material Type, 2020 to 2035
  • Figure 46: North America Market Value Share (%) and BPS Analysis by Material Type, 2025 to 2035
  • Figure 47: North America Market Y-o-Y Growth (%) Projections by Material Type, 2025 to 2035
  • Figure 48: North America Market Value (USD Million) Analysis by Primary Application, 2020 to 2035
  • Figure 49: North America Market Volume (Sq. Meter) Analysis by Primary Application, 2020 to 2035
  • Figure 50: North America Market Value Share (%) and BPS Analysis by Primary Application, 2025 to 2035
  • Figure 51: North America Market Y-o-Y Growth (%) Projections by Primary Application, 2025 to 2035
  • Figure 52: North America Market Value (USD Million) Analysis by End-use, 2020 to 2035
  • Figure 53: North America Market Volume (Sq. Meter) Analysis by End-use, 2020 to 2035
  • Figure 54: North America Market Value Share (%) and BPS Analysis by End-use, 2025 to 2035
  • Figure 55: North America Market Y-o-Y Growth (%) Projections by End-use, 2025 to 2035
  • Figure 56: North America Market Attractiveness by Product Type, 2025 to 2035
  • Figure 57: North America Market Attractiveness by Material Type, 2025 to 2035
  • Figure 58: North America Market Attractiveness by Primary Application, 2025 to 2035
  • Figure 59: North America Market Attractiveness by End-use, 2025 to 2035
  • Figure 60: North America Market Attractiveness by Country, 2025 to 2035
  • Figure 61: Latin America Market Value (USD Million) by Product Type, 2025 to 2035
  • Figure 62: Latin America Market Value (USD Million) by Material Type, 2025 to 2035
  • Figure 63: Latin America Market Value (USD Million) by Primary Application, 2025 to 2035
  • Figure 64: Latin America Market Value (USD Million) by End-use, 2025 to 2035
  • Figure 65: Latin America Market Value (USD Million) by Country, 2025 to 2035
  • Figure 66: Latin America Market Value (USD Million) Analysis by Country, 2020 to 2035
  • Figure 67: Latin America Market Volume (Sq. Meter) Analysis by Country, 2020 to 2035
  • Figure 68: Latin America Market Value Share (%) and BPS Analysis by Country, 2025 to 2035
  • Figure 69: Latin America Market Y-o-Y Growth (%) Projections by Country, 2025 to 2035
  • Figure 70: Latin America Market Value (USD Million) Analysis by Product Type, 2020 to 2035
  • Figure 71: Latin America Market Volume (Sq. Meter) Analysis by Product Type, 2020 to 2035
  • Figure 72: Latin America Market Value Share (%) and BPS Analysis by Product Type, 2025 to 2035
  • Figure 73: Latin America Market Y-o-Y Growth (%) Projections by Product Type, 2025 to 2035
  • Figure 74: Latin America Market Value (USD Million) Analysis by Material Type, 2020 to 2035
  • Figure 75: Latin America Market Volume (Sq. Meter) Analysis by Material Type, 2020 to 2035
  • Figure 76: Latin America Market Value Share (%) and BPS Analysis by Material Type, 2025 to 2035
  • Figure 77: Latin America Market Y-o-Y Growth (%) Projections by Material Type, 2025 to 2035
  • Figure 78: Latin America Market Value (USD Million) Analysis by Primary Application, 2020 to 2035
  • Figure 79: Latin America Market Volume (Sq. Meter) Analysis by Primary Application, 2020 to 2035
  • Figure 80: Latin America Market Value Share (%) and BPS Analysis by Primary Application, 2025 to 2035
  • Figure 81: Latin America Market Y-o-Y Growth (%) Projections by Primary Application, 2025 to 2035
  • Figure 82: Latin America Market Value (USD Million) Analysis by End-use, 2020 to 2035
  • Figure 83: Latin America Market Volume (Sq. Meter) Analysis by End-use, 2020 to 2035
  • Figure 84: Latin America Market Value Share (%) and BPS Analysis by End-use, 2025 to 2035
  • Figure 85: Latin America Market Y-o-Y Growth (%) Projections by End-use, 2025 to 2035
  • Figure 86: Latin America Market Attractiveness by Product Type, 2025 to 2035
  • Figure 87: Latin America Market Attractiveness by Material Type, 2025 to 2035
  • Figure 88: Latin America Market Attractiveness by Primary Application, 2025 to 2035
  • Figure 89: Latin America Market Attractiveness by End-use, 2025 to 2035
  • Figure 90: Latin America Market Attractiveness by Country, 2025 to 2035
  • Figure 91: Western Europe Market Value (USD Million) by Product Type, 2025 to 2035
  • Figure 92: Western Europe Market Value (USD Million) by Material Type, 2025 to 2035
  • Figure 93: Western Europe Market Value (USD Million) by Primary Application, 2025 to 2035
  • Figure 94: Western Europe Market Value (USD Million) by End-use, 2025 to 2035
  • Figure 95: Western Europe Market Value (USD Million) by Country, 2025 to 2035
  • Figure 96: Western Europe Market Value (USD Million) Analysis by Country, 2020 to 2035
  • Figure 97: Western Europe Market Volume (Sq. Meter) Analysis by Country, 2020 to 2035
  • Figure 98: Western Europe Market Value Share (%) and BPS Analysis by Country, 2025 to 2035
  • Figure 99: Western Europe Market Y-o-Y Growth (%) Projections by Country, 2025 to 2035
  • Figure 100: Western Europe Market Value (USD Million) Analysis by Product Type, 2020 to 2035
  • Figure 101: Western Europe Market Volume (Sq. Meter) Analysis by Product Type, 2020 to 2035
  • Figure 102: Western Europe Market Value Share (%) and BPS Analysis by Product Type, 2025 to 2035
  • Figure 103: Western Europe Market Y-o-Y Growth (%) Projections by Product Type, 2025 to 2035
  • Figure 104: Western Europe Market Value (USD Million) Analysis by Material Type, 2020 to 2035
  • Figure 105: Western Europe Market Volume (Sq. Meter) Analysis by Material Type, 2020 to 2035
  • Figure 106: Western Europe Market Value Share (%) and BPS Analysis by Material Type, 2025 to 2035
  • Figure 107: Western Europe Market Y-o-Y Growth (%) Projections by Material Type, 2025 to 2035
  • Figure 108: Western Europe Market Value (USD Million) Analysis by Primary Application, 2020 to 2035
  • Figure 109: Western Europe Market Volume (Sq. Meter) Analysis by Primary Application, 2020 to 2035
  • Figure 110: Western Europe Market Value Share (%) and BPS Analysis by Primary Application, 2025 to 2035
  • Figure 111: Western Europe Market Y-o-Y Growth (%) Projections by Primary Application, 2025 to 2035
  • Figure 112: Western Europe Market Value (USD Million) Analysis by End-use, 2020 to 2035
  • Figure 113: Western Europe Market Volume (Sq. Meter) Analysis by End-use, 2020 to 2035
  • Figure 114: Western Europe Market Value Share (%) and BPS Analysis by End-use, 2025 to 2035
  • Figure 115: Western Europe Market Y-o-Y Growth (%) Projections by End-use, 2025 to 2035
  • Figure 116: Western Europe Market Attractiveness by Product Type, 2025 to 2035
  • Figure 117: Western Europe Market Attractiveness by Material Type, 2025 to 2035
  • Figure 118: Western Europe Market Attractiveness by Primary Application, 2025 to 2035
  • Figure 119: Western Europe Market Attractiveness by End-use, 2025 to 2035
  • Figure 120: Western Europe Market Attractiveness by Country, 2025 to 2035
  • Figure 121: Eastern Europe Market Value (USD Million) by Product Type, 2025 to 2035
  • Figure 122: Eastern Europe Market Value (USD Million) by Material Type, 2025 to 2035
  • Figure 123: Eastern Europe Market Value (USD Million) by Primary Application, 2025 to 2035
  • Figure 124: Eastern Europe Market Value (USD Million) by End-use, 2025 to 2035
  • Figure 125: Eastern Europe Market Value (USD Million) by Country, 2025 to 2035
  • Figure 126: Eastern Europe Market Value (USD Million) Analysis by Country, 2020 to 2035
  • Figure 127: Eastern Europe Market Volume (Sq. Meter) Analysis by Country, 2020 to 2035
  • Figure 128: Eastern Europe Market Value Share (%) and BPS Analysis by Country, 2025 to 2035
  • Figure 129: Eastern Europe Market Y-o-Y Growth (%) Projections by Country, 2025 to 2035
  • Figure 130: Eastern Europe Market Value (USD Million) Analysis by Product Type, 2020 to 2035
  • Figure 131: Eastern Europe Market Volume (Sq. Meter) Analysis by Product Type, 2020 to 2035
  • Figure 132: Eastern Europe Market Value Share (%) and BPS Analysis by Product Type, 2025 to 2035
  • Figure 133: Eastern Europe Market Y-o-Y Growth (%) Projections by Product Type, 2025 to 2035
  • Figure 134: Eastern Europe Market Value (USD Million) Analysis by Material Type, 2020 to 2035
  • Figure 135: Eastern Europe Market Volume (Sq. Meter) Analysis by Material Type, 2020 to 2035
  • Figure 136: Eastern Europe Market Value Share (%) and BPS Analysis by Material Type, 2025 to 2035
  • Figure 137: Eastern Europe Market Y-o-Y Growth (%) Projections by Material Type, 2025 to 2035
  • Figure 138: Eastern Europe Market Value (USD Million) Analysis by Primary Application, 2020 to 2035
  • Figure 139: Eastern Europe Market Volume (Sq. Meter) Analysis by Primary Application, 2020 to 2035
  • Figure 140: Eastern Europe Market Value Share (%) and BPS Analysis by Primary Application, 2025 to 2035
  • Figure 141: Eastern Europe Market Y-o-Y Growth (%) Projections by Primary Application, 2025 to 2035
  • Figure 142: Eastern Europe Market Value (USD Million) Analysis by End-use, 2020 to 2035
  • Figure 143: Eastern Europe Market Volume (Sq. Meter) Analysis by End-use, 2020 to 2035
  • Figure 144: Eastern Europe Market Value Share (%) and BPS Analysis by End-use, 2025 to 2035
  • Figure 145: Eastern Europe Market Y-o-Y Growth (%) Projections by End-use, 2025 to 2035
  • Figure 146: Eastern Europe Market Attractiveness by Product Type, 2025 to 2035
  • Figure 147: Eastern Europe Market Attractiveness by Material Type, 2025 to 2035
  • Figure 148: Eastern Europe Market Attractiveness by Primary Application, 2025 to 2035
  • Figure 149: Eastern Europe Market Attractiveness by End-use, 2025 to 2035
  • Figure 150: Eastern Europe Market Attractiveness by Country, 2025 to 2035
  • Figure 151: South Asia and Pacific Market Value (USD Million) by Product Type, 2025 to 2035
  • Figure 152: South Asia and Pacific Market Value (USD Million) by Material Type, 2025 to 2035
  • Figure 153: South Asia and Pacific Market Value (USD Million) by Primary Application, 2025 to 2035
  • Figure 154: South Asia and Pacific Market Value (USD Million) by End-use, 2025 to 2035
  • Figure 155: South Asia and Pacific Market Value (USD Million) by Country, 2025 to 2035
  • Figure 156: South Asia and Pacific Market Value (USD Million) Analysis by Country, 2020 to 2035
  • Figure 157: South Asia and Pacific Market Volume (Sq. Meter) Analysis by Country, 2020 to 2035
  • Figure 158: South Asia and Pacific Market Value Share (%) and BPS Analysis by Country, 2025 to 2035
  • Figure 159: South Asia and Pacific Market Y-o-Y Growth (%) Projections by Country, 2025 to 2035
  • Figure 160: South Asia and Pacific Market Value (USD Million) Analysis by Product Type, 2020 to 2035
  • Figure 161: South Asia and Pacific Market Volume (Sq. Meter) Analysis by Product Type, 2020 to 2035
  • Figure 162: South Asia and Pacific Market Value Share (%) and BPS Analysis by Product Type, 2025 to 2035
  • Figure 163: South Asia and Pacific Market Y-o-Y Growth (%) Projections by Product Type, 2025 to 2035
  • Figure 164: South Asia and Pacific Market Value (USD Million) Analysis by Material Type, 2020 to 2035
  • Figure 165: South Asia and Pacific Market Volume (Sq. Meter) Analysis by Material Type, 2020 to 2035
  • Figure 166: South Asia and Pacific Market Value Share (%) and BPS Analysis by Material Type, 2025 to 2035
  • Figure 167: South Asia and Pacific Market Y-o-Y Growth (%) Projections by Material Type, 2025 to 2035
  • Figure 168: South Asia and Pacific Market Value (USD Million) Analysis by Primary Application, 2020 to 2035
  • Figure 169: South Asia and Pacific Market Volume (Sq. Meter) Analysis by Primary Application, 2020 to 2035
  • Figure 170: South Asia and Pacific Market Value Share (%) and BPS Analysis by Primary Application, 2025 to 2035
  • Figure 171: South Asia and Pacific Market Y-o-Y Growth (%) Projections by Primary Application, 2025 to 2035
  • Figure 172: South Asia and Pacific Market Value (USD Million) Analysis by End-use, 2020 to 2035
  • Figure 173: South Asia and Pacific Market Volume (Sq. Meter) Analysis by End-use, 2020 to 2035
  • Figure 174: South Asia and Pacific Market Value Share (%) and BPS Analysis by End-use, 2025 to 2035
  • Figure 175: South Asia and Pacific Market Y-o-Y Growth (%) Projections by End-use, 2025 to 2035
  • Figure 176: South Asia and Pacific Market Attractiveness by Product Type, 2025 to 2035
  • Figure 177: South Asia and Pacific Market Attractiveness by Material Type, 2025 to 2035
  • Figure 178: South Asia and Pacific Market Attractiveness by Primary Application, 2025 to 2035
  • Figure 179: South Asia and Pacific Market Attractiveness by End-use, 2025 to 2035
  • Figure 180: South Asia and Pacific Market Attractiveness by Country, 2025 to 2035
  • Figure 181: East Asia Market Value (USD Million) by Product Type, 2025 to 2035
  • Figure 182: East Asia Market Value (USD Million) by Material Type, 2025 to 2035
  • Figure 183: East Asia Market Value (USD Million) by Primary Application, 2025 to 2035
  • Figure 184: East Asia Market Value (USD Million) by End-use, 2025 to 2035
  • Figure 185: East Asia Market Value (USD Million) by Country, 2025 to 2035
  • Figure 186: East Asia Market Value (USD Million) Analysis by Country, 2020 to 2035
  • Figure 187: East Asia Market Volume (Sq. Meter) Analysis by Country, 2020 to 2035
  • Figure 188: East Asia Market Value Share (%) and BPS Analysis by Country, 2025 to 2035
  • Figure 189: East Asia Market Y-o-Y Growth (%) Projections by Country, 2025 to 2035
  • Figure 190: East Asia Market Value (USD Million) Analysis by Product Type, 2020 to 2035
  • Figure 191: East Asia Market Volume (Sq. Meter) Analysis by Product Type, 2020 to 2035
  • Figure 192: East Asia Market Value Share (%) and BPS Analysis by Product Type, 2025 to 2035
  • Figure 193: East Asia Market Y-o-Y Growth (%) Projections by Product Type, 2025 to 2035
  • Figure 194: East Asia Market Value (USD Million) Analysis by Material Type, 2020 to 2035
  • Figure 195: East Asia Market Volume (Sq. Meter) Analysis by Material Type, 2020 to 2035
  • Figure 196: East Asia Market Value Share (%) and BPS Analysis by Material Type, 2025 to 2035
  • Figure 197: East Asia Market Y-o-Y Growth (%) Projections by Material Type, 2025 to 2035
  • Figure 198: East Asia Market Value (USD Million) Analysis by Primary Application, 2020 to 2035
  • Figure 199: East Asia Market Volume (Sq. Meter) Analysis by Primary Application, 2020 to 2035
  • Figure 200: East Asia Market Value Share (%) and BPS Analysis by Primary Application, 2025 to 2035
  • Figure 201: East Asia Market Y-o-Y Growth (%) Projections by Primary Application, 2025 to 2035
  • Figure 202: East Asia Market Value (USD Million) Analysis by End-use, 2020 to 2035
  • Figure 203: East Asia Market Volume (Sq. Meter) Analysis by End-use, 2020 to 2035
  • Figure 204: East Asia Market Value Share (%) and BPS Analysis by End-use, 2025 to 2035
  • Figure 205: East Asia Market Y-o-Y Growth (%) Projections by End-use, 2025 to 2035
  • Figure 206: East Asia Market Attractiveness by Product Type, 2025 to 2035
  • Figure 207: East Asia Market Attractiveness by Material Type, 2025 to 2035
  • Figure 208: East Asia Market Attractiveness by Primary Application, 2025 to 2035
  • Figure 209: East Asia Market Attractiveness by End-use, 2025 to 2035
  • Figure 210: East Asia Market Attractiveness by Country, 2025 to 2035
  • Figure 211: Middle East and Africa Market Value (USD Million) by Product Type, 2025 to 2035
  • Figure 212: Middle East and Africa Market Value (USD Million) by Material Type, 2025 to 2035
  • Figure 213: Middle East and Africa Market Value (USD Million) by Primary Application, 2025 to 2035
  • Figure 214: Middle East and Africa Market Value (USD Million) by End-use, 2025 to 2035
  • Figure 215: Middle East and Africa Market Value (USD Million) by Country, 2025 to 2035
  • Figure 216: Middle East and Africa Market Value (USD Million) Analysis by Country, 2020 to 2035
  • Figure 217: Middle East and Africa Market Volume (Sq. Meter) Analysis by Country, 2020 to 2035
  • Figure 218: Middle East and Africa Market Value Share (%) and BPS Analysis by Country, 2025 to 2035
  • Figure 219: Middle East and Africa Market Y-o-Y Growth (%) Projections by Country, 2025 to 2035
  • Figure 220: Middle East and Africa Market Value (USD Million) Analysis by Product Type, 2020 to 2035
  • Figure 221: Middle East and Africa Market Volume (Sq. Meter) Analysis by Product Type, 2020 to 2035
  • Figure 222: Middle East and Africa Market Value Share (%) and BPS Analysis by Product Type, 2025 to 2035
  • Figure 223: Middle East and Africa Market Y-o-Y Growth (%) Projections by Product Type, 2025 to 2035
  • Figure 224: Middle East and Africa Market Value (USD Million) Analysis by Material Type, 2020 to 2035
  • Figure 225: Middle East and Africa Market Volume (Sq. Meter) Analysis by Material Type, 2020 to 2035
  • Figure 226: Middle East and Africa Market Value Share (%) and BPS Analysis by Material Type, 2025 to 2035
  • Figure 227: Middle East and Africa Market Y-o-Y Growth (%) Projections by Material Type, 2025 to 2035
  • Figure 228: Middle East and Africa Market Value (USD Million) Analysis by Primary Application, 2020 to 2035
  • Figure 229: Middle East and Africa Market Volume (Sq. Meter) Analysis by Primary Application, 2020 to 2035
  • Figure 230: Middle East and Africa Market Value Share (%) and BPS Analysis by Primary Application, 2025 to 2035
  • Figure 231: Middle East and Africa Market Y-o-Y Growth (%) Projections by Primary Application, 2025 to 2035
  • Figure 232: Middle East and Africa Market Value (USD Million) Analysis by End-use, 2020 to 2035
  • Figure 233: Middle East and Africa Market Volume (Sq. Meter) Analysis by End-use, 2020 to 2035
  • Figure 234: Middle East and Africa Market Value Share (%) and BPS Analysis by End-use, 2025 to 2035
  • Figure 235: Middle East and Africa Market Y-o-Y Growth (%) Projections by End-use, 2025 to 2035
  • Figure 236: Middle East and Africa Market Attractiveness by Product Type, 2025 to 2035
  • Figure 237: Middle East and Africa Market Attractiveness by Material Type, 2025 to 2035
  • Figure 238: Middle East and Africa Market Attractiveness by Primary Application, 2025 to 2035
  • Figure 239: Middle East and Africa Market Attractiveness by End-use, 2025 to 2035
  • Figure 240: Middle East and Africa Market Attractiveness by Country, 2025 to 2035

Frequently Asked Questions

What was the overall size of the Geosynthetics Market in 2025?

The overall market size for Geosynthetics Market was USD 18.3 Billion in 2025.

How big the Bio is based Geosynthetics Market expected in 2035?

The Geosynthetics Market expected to reach USD 45.3 Billion in 2035.

What will drive the demand for Geosynthetics Market during the forecast period?

The demand for the Geosynthetics Market will be driven by the growing construction and infrastructure development, increasing use in waste management, water conservation, and soil reinforcement projects. Environmental concerns and the need for sustainable materials in civil engineering will further fuel market growth.

List the top 5 countries contributing in Geosynthetics Market?

The top 5 countries which drives the development of Geosynthetics Market are USA, UK, Europe Union, Japan and South Korea.

Which segment in type is expected to lead in Geosynthetics Market?

Geotextiles and Geomembranes Drive Market to command significant share over the assessment period.

Explore Similar Insights

Future Market Insights

Geosynthetics Market