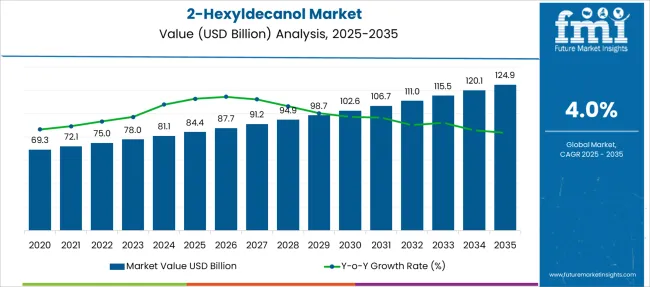
The 2-Hexyldecanol Market is estimated to be valued at USD 84.4 billion in 2025 and is projected to reach USD 124.9 billion by 2035, registering a compound annual growth rate (CAGR) of 4.0% over the forecast period.
| Metric | Value |
|---|---|
| 2-Hexyldecanol Market Estimated Value in (2025 E) | USD 84.4 billion |
| 2-Hexyldecanol Market Forecast Value in (2035 F) | USD 124.9 billion |
| Forecast CAGR (2025 to 2035) | 4.0% |
The 2-Hexyldecanol market is experiencing consistent growth, primarily influenced by its multifunctional role as an emollient, solvent, and intermediate in various formulations. Its structural attributes, including high molecular weight and branched-chain composition, have made it suitable for applications requiring enhanced spreadability, low volatility, and good solubility profiles.
In the personal care and cosmetics industry, its utility in skin-conditioning agents and its compatibility with active ingredients have driven demand for formulation upgrades. Industrially, the compound is increasingly being integrated into high-performance coatings, lubricants, and textile chemicals, where thermal and chemical stability are essential.
Rising environmental regulations and the shift towards low-VOC and bio-compatible materials are also encouraging formulators to adopt 2-Hexyldecanol due to its favorable safety profile and processing stability As global manufacturing scales up and consumer preferences shift toward premium formulations with multifunctional ingredients, the demand for high-purity grades of 2-Hexyldecanol is expected to remain robust across key markets.
The market is segmented by Grade, Function, and End Use and region. By Grade, the market is divided into Technical Grade and Pharma Grade. In terms of Function, the market is classified into Solvent, Emulsifier, Solubilizer, and Others. Based on End Use, the market is segmented into Personal Care & Cosmetics, Pharmaceuticals, Polymer & Plastics, Dyes, and Others. Regionally, the market is classified into North America, Latin America, Western Europe, Eastern Europe, Balkan & Baltic Countries, Russia & Belarus, Central Asia, East Asia, South Asia & Pacific, and the Middle East & Africa.
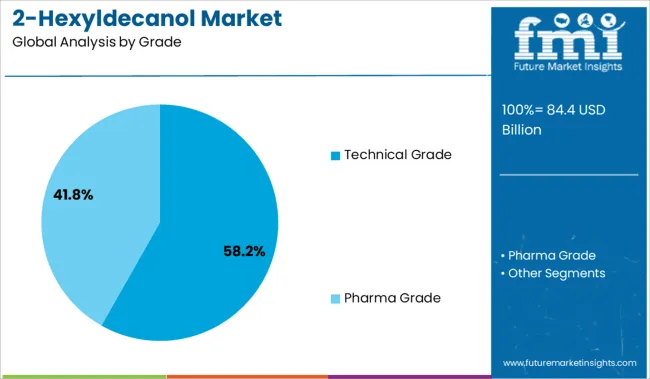
The technical grade segment is projected to hold 58.2% of the total revenue share in the 2-Hexyldecanol market in 2025, making it the dominant grade type. This segment's leadership is driven by the widespread applicability of technical grade 2-Hexyldecanol in industrial formulations such as coatings, inks, lubricants, and adhesives, where ultra-high purity is not a prerequisite.
The chemical’s favorable solvency, compatibility with polymers, and thermal stability have made it a standard additive across various manufacturing operations. Cost-efficiency in large-volume production environments has supported its adoption, especially in developing economies where performance and affordability need to be balanced.
The compound’s capacity to serve as a coalescent in paints and its ease of blending with other plasticizers and synthetic oils have further expanded its use Technical grade variants also meet the performance requirements for chemical intermediates used in surfactants and textile processing, thereby ensuring consistent demand from industrial buyers and manufacturers aiming to optimize cost-performance ratios.
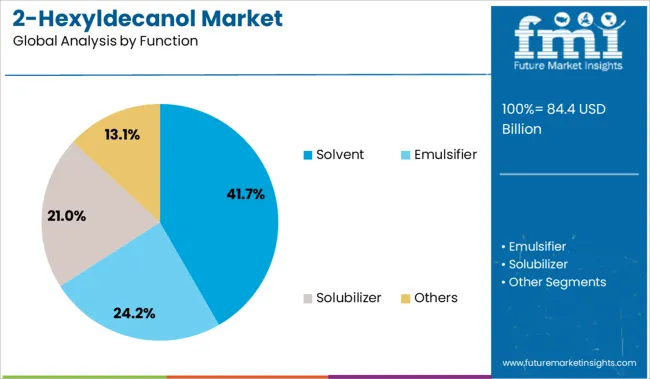
The solvent segment is anticipated to contribute 41.7% of the total revenue share in the 2-Hexyldecanol market in 2025. This segment’s strength is supported by the increasing use of 2-Hexyldecanol as a carrier and dissolving agent across various formulation systems. Its solvency characteristics have been effectively leveraged in cosmetic emulsions, agrochemical dispersions, and coating systems requiring long shelf life and homogeneous active ingredient distribution.
As industries emphasize solvent systems that offer both high solvency power and improved environmental compliance, 2-Hexyldecanol has emerged as a suitable replacement for traditional high-VOC solvents. Its low odor, low volatility, and non-reactive nature have further enhanced its desirability in sensitive product categories.
The ability to optimize rheological properties and enhance spreadability without destabilizing the formulation has made this compound a preferred choice in advanced solvent systems Additionally, its role in improving pigment wetting and leveling in coatings and inks is contributing to the segment’s growing share.
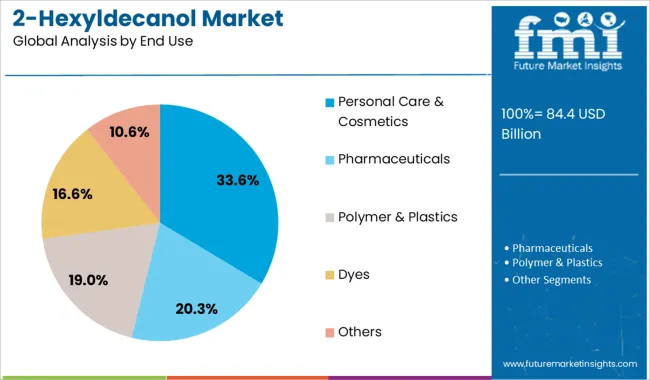
The personal care and cosmetics segment is expected to account for 33.6% of the 2-Hexyldecanol market revenue share in 2025. The segment’s dominance is underpinned by the compound’s high demand as an emollient and texture enhancer in skincare, haircare, and decorative cosmetic products. Its compatibility with a wide range of active ingredients, along with its ability to improve product aesthetics and skin feel, has made it highly favored by formulation chemists.
As consumer preferences shift towards premium, multifunctional, and sensorially appealing products, 2-Hexyldecanol is being increasingly incorporated into formulations requiring a smooth, non-greasy finish. Its efficacy in stabilizing emulsions, improving spreadability, and enhancing absorption without irritation has further driven adoption in sensitive skin applications.
Regulatory acceptance across key global markets has enabled its use in both mass-market and luxury cosmetic formulations With rising demand for clean-label and dermatologically tested personal care products, the segment is poised to sustain high consumption levels of 2-Hexyldecanol in the coming years.
2-hexyldecanol has multifunctional characteristics owing to which it finds application in personal care, cosmetics, polymer & plastic, and dyes, among other industries. In the personal care & cosmetic industry, the demand for 2-hexyldecanol is particularly for its use as an emulsifier.
In contrast, it is used as a solubilizing agent for liposomal drugs in the pharmaceutical industry. Along with this, the sales of 2-hexyldecanol as a solvent in dyes, pigment, rubber & plastic manufacturing are gaining momentum in the present market.
The trends in the cosmetics & personal care industry are such that multifunctional ingredients are used for skin care, sun care, and hair care cosmetics products, which sequentially is expected to drive the demand for 2-hexyldecanol over the forecast period.
Higher sales of 2-hexyldecanol are also achieved due to its uses as a cosmetics ingredient to provide multifunctional properties. Moreover, OSHA defines it as a non-hazardous substance, i.e., it is a relatively safer alternative to some of the other conventionally used ingredients that are anticipated to drive the sales of 2-hexyldecanol for cosmetics products.
Along with this, significant growth of dyes and polymer & plastics industry in developing regions will, in turn, help to drive the demand for 2-hexyldecanol in other markets.
2-hexyldecanol tends to be more expensive than other aliphatic alcohols due to the comprehensive conversion during the dimerization process of alcohol.
Thus, relatively higher prices of 2-hexyldecanol are in turn expected to act as an impediment to the sales of 2-hexyldecanol during the forecast period. Moreover, the global 2-hexyldecanol market share is a highly consolidated market as two players, BASF SE, and Sasol Ltd., accounted for the lion’s share of the market in terms of production.
At the same time, several other new players are focusing on the expansion of the production capacity in order to enhance their sales of 2-hexyldecanol in the global market.
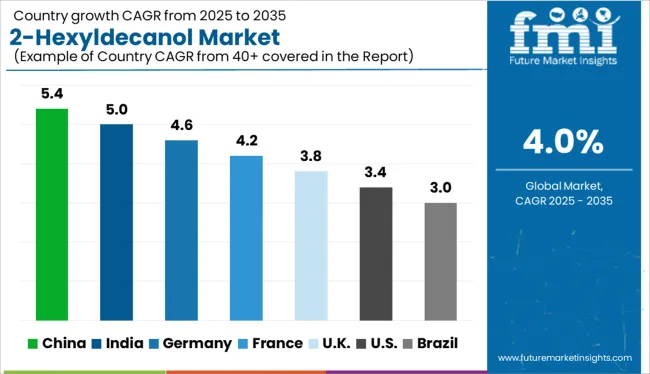
In terms of demand for 2-hexyldecanol, the global market is expected to be dominated by the Asia Pacific region, followed by North America. Whereas in terms of production and sales of 2-hexyldecanol, Europe alone accounts for the lion’s share of the global market.
This higher demand for 2-hexyldecanol in the Asia Pacific region is mainly attributed to the increasing consumption of personal care products in China, Japan, and Southeast Asian countries. Steady growth in end-use industries across the Asia Pacific is expected to translate into a steady growth in demand for 2-hexyldecanol in the region during the forecast period.
North America and Europe are expected to witness relatively slower growth in sales of 2-hexyldecanol primarily due to the mature nature of the end-use industry in these regions.
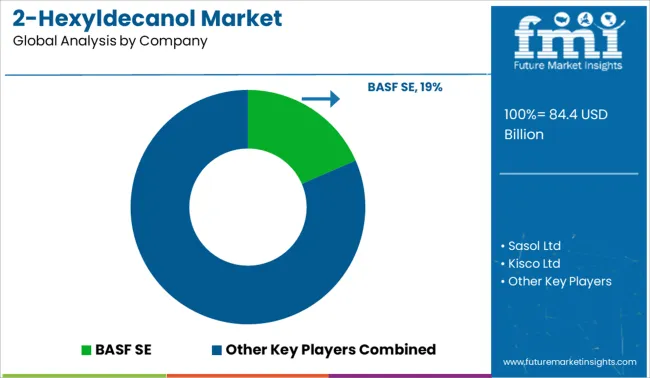
Some of the leading companies operating in the global 2-hexyldecanol market are BASF SE, Sasol Ltd, Kisco Ltd, New Japan Chemical Co., Ltd, DowPol Corporation, Jarchem Industries Inc, TCI AMERICA, and Merck KGaA among others.
| Report Attribute | Details |
|---|---|
| Growth Rate | CAGR of 4% from 2025 to 2035 |
| Base Year for Estimation | 2024 |
| Historical Data | 2020 to 2024 |
| Forecast Period | 2025 to 2035 |
| Quantitative Units | Revenue in USD Million, Volume in Kilotons, and CAGR from 2025 to 2035 |
| Report Coverage | Revenue Forecast, Volume Forecast, Company Ranking, Competitive Landscape, Growth Factors, Trends, and Pricing Analysis |
| Segments Covered |
Grade, Function, End Use |
| Regions Covered | North America; Latin America; Western Europe; Eastern Europe; Asia Pacific Excluding Japan; Japan; Middle East and Africa |
| Key Countries Profiled |
USA, Canada, Brazil, Argentina, Germany, United Kingdom, France, Spain, Italy, Nordics, BENELUX, Australia & New Zealand, China, India, ASIAN, GCC Countries, South Africa |
| Key Companies Profiled |
BASF SE; Sasol Ltd; Kisco Ltd; New Japan Chemical Co., Ltd; DowPol Corporation; Jarchem Industries Inc; TCI AMERICA; Merck KGaA |
| Customization | Available Upon Request |
The global 2-hexyldecanol market is estimated to be valued at USD 84.4 billion in 2025.
The market size for the 2-hexyldecanol market is projected to reach USD 124.9 billion by 2035.
The 2-hexyldecanol market is expected to grow at a 4.0% CAGR between 2025 and 2035.
The key product types in 2-hexyldecanol market are technical grade and pharma grade.
In terms of function, solvent segment to command 41.7% share in the 2-hexyldecanol market in 2025.


Full Research Suite comprises of:
Market outlook & trends analysis
Interviews & case studies
Strategic recommendations
Vendor profiles & capabilities analysis
5-year forecasts
8 regions and 60+ country-level data splits
Market segment data splits
12 months of continuous data updates
DELIVERED AS:
PDF EXCEL ONLINE

Thank you!
You will receive an email from our Business Development Manager. Please be sure to check your SPAM/JUNK folder too.
Chat With
MaRIA