Reports

- Global Locations -

Headquarters

Future Market Insights, Inc.

Christiana Corporate, 200
Continental Drive, Suite 401,
Newark, Delaware - 19713,
United States

T: +1-845-579-5705

Americas

Future Market Insights, Inc.

616 Corporate Way, Suite 2-9018,
Valley Cottage, NY 10989, United States

T: +1-347-918-3531

MEA

Future Market Insights

1602-6 Jumeirah Bay X2 Tower, Plot No: JLT-PH2-X2A,
Jumeirah Lakes Towers, Dubai,
United Arab Emirates

Europe

Future Market Insights

3rd Floor, 207 Regent Street,
W1B 3HH London
United Kingdom

T: + 44 (0) 20 8123 9659
D: +44 (0) 20 3287 4268

Asia Pacific

Future Market Insights

IndiaLand Global Tech Park, Unit UG-1, Behind Grand HighStreet, Phase 1, Hinjawadi, MH, Pune – 411057, India

Herbicides Market Overview (2022 to 2032)

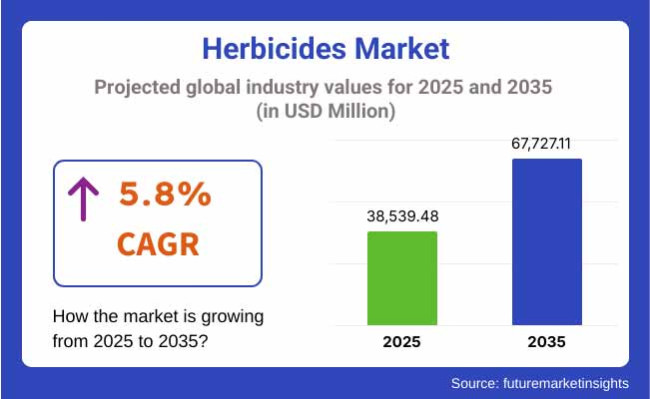
The global herbicides market is expected to register a moderate CAGR of 6% during the forecast period.

Significant variables driving the growth of the global herbicides market include increased knowledge about the advantages of spraying herbicides pre- and post-cultivation of crops, as well as rising demand for food throughout the world.

Herbicides are crop protection materials used for killing undesired plants without causing any harm to the plantation and thus increasing agricultural productivity.

Herbicides are often modified for a particular plantation based on plant hormones to ensure the safety of the desired plantation. Herbicides are also employed for clearing the land of plants and herbs where they kill all plants in a region.

Attributes Details
Herbicides Market Value in 2020 US$ 34.3 Billion
Herbicides Market CAGR (2022 to 2032) 6%

Don't pay for what you don't need

Customize your report by selecting specific countries or regions and save 30%!

What Factors Determine the Herbicides Market Growth?

The formulation of strict laws prohibiting the use of some herbicides in industrialized countries is stifling the expansion of the herbicide market.

The increasing population and growing disposable income of a region are among other drivers for the demand for herbicides. Synthetically produced herbicides dominate the global herbicides market primarily owing to low cost and higher efficiency.

Bio-based herbicides are made from renewable resources and are predicted to be the fastest-growing herbicide product class shortly. Among the chemicals utilized in herbicide, manufacture includes amide, sodium chlorate, and sulfuric acid, to name a few.

What is the Segment Outlook of the Global Herbicides Market?

To market their goods, herbicide producers must follow a diligent clearance process.

Herbicides help in improving agricultural productivity by killing unwanted herbs and weeds on the plantation. Hence increasing demand for high agricultural productivity to meet the global food demands has been the foremost driver for herbicides market growth.

However, several synthetic herbicides pose a severe threat to the ecosystem and cause several environmental and health hazards. The hazards associated with synthetic herbicides have led to several stringent regulations on the use of herbicides which has been a major factor restraining herbicides market growth.

The regulations have led to an increase in the demand for bio-based herbicides. To meet the stringent regulations and also to improve the efficiency of herbicides, major players invest in research and development activities to develop new herbicides. Hence intellectual properties and patents are among the critical success factors for growth in the herbicides market.

Nikhil Kaitwade
Nikhil Kaitwade

Principal Consultant

Talk to Analyst

Find your sweet spots for generating winning opportunities in this market.

Which Region is Most Likely to be the Market Leader in Herbicides?

North America is the second-largest consumer of herbicides. However, stringent environmental regulations in the developed economies of North America and Europe are expected to restrain market growth in these regions.

The Asia Pacific dominated the global herbicides market both in terms of production and consumption and the trend is expected to continue shortly. The Asia Pacific comprises two of the largest countries in terms of population namely India and China.

These regions are also among the major emerging economies in terms of GDP growth rate and increasing disposable income. A large population coupled with high economic growth in these emerging economies is expected to drive demand for herbicides in the Asia Pacific.

Bio-based herbicides are expected to offer huge growth opportunities in North America and Europe.

Demand for herbicides in the RoW region is dominated by South America primarily owing to a growing demand for several crops in the region including corn, beans, and cashews among several others. RoW region is expected to be among the fastest-growing regions for herbicides market growth.

Scope Of Report

Attributes Details
Forecast Period 2022 to 2032
Historical Data Available for 2014 to 2020
Market Analysis US$ Billion for Value
By Type
  • Glyphosate
  • Diquat
  • 2
  • 4-D
By Crop Type
  • Cereals & grains
  • Oilseeds & pulses
  • Fruits & vegetables
  • Others
By Region
  • North America
  • Europe
  • Asia Pacific
  • Latin America
  • Middle East and Africa
By Key Players
  • Kenvos Biotech Co., Ltd.
  • Amvac Chemical Corporation
  • United Phosphorus Limited (UPL)
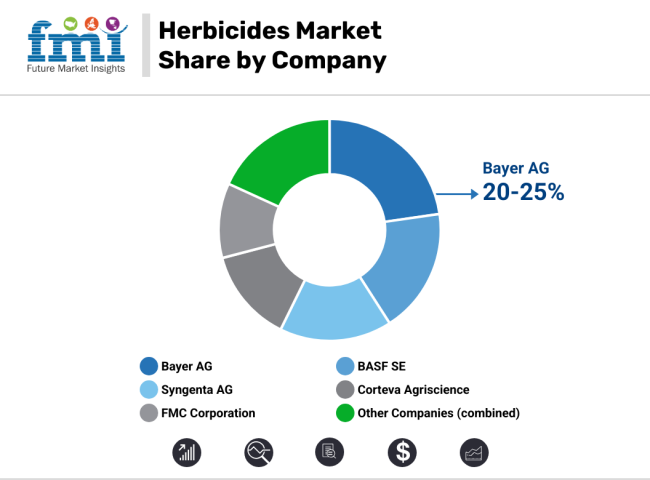
  • Bayer CropScience AG
  • Shandong Tianfeng Biotechnology Co.

Get the data you need at a Fraction of the cost

Personalize your report by choosing insights you need
and save 40%!

Key Segments

By Type:

  • Glyphosate
  • Diquat
  • 2
  • 4-D

By Crop Type:

  • Cereals & grains
  • Oilseeds & pulses
  • Fruits & vegetables
  • Others

By Region:

  • North America
  • Europe
  • Asia Pacific
  • Latin America
  • Middle East and Africa

Frequently Asked Questions

What is the growth outlook for the Herbicides Market?

The herbicides market is expected to register a CAGR of 6% from 2022 to 2032.

Which Sector is the Key Driver in the Herbicides Market?

The agricultural sector is a key driver in the herbicide market.

Which Region Leads the Herbicides Market?

The Asia Pacific region is anticipated to dominate the herbicides market during the forecast period.

How much Growth Potential does the Herbicides Market hold?

The herbicides market is likely to hold a valuation of US$ 69.02 billion by 2032.

What is the current valuation of the Herbicides Market?

The current valuation of the herbicides market in 2022 is US$ 38.54 billion.

Table of Content

1. Executive Summary | Herbicides Market

    1.1. Global Market Outlook

    1.2. Demand-side Trends

    1.3. Supply-side Trends

    1.4. Technology Roadmap Analysis

    1.5. Analysis and Recommendations

2. Market Overview

    2.1. Market Coverage / Taxonomy

    2.2. Market Definition / Scope / Limitations

3. Market Background

    3.1. Market Dynamics

        3.1.1. Drivers

        3.1.2. Restraints

        3.1.3. Opportunity

        3.1.4. Trends

    3.2. Scenario Forecast

        3.2.1. Demand in Optimistic Scenario

        3.2.2. Demand in Likely Scenario

        3.2.3. Demand in Conservative Scenario

    3.3. Opportunity Map Analysis

    3.4. Product Life Cycle Analysis

    3.5. Supply Chain Analysis

        3.5.1. Supply Side Participants and Their Roles

            3.5.1.1. Producers

            3.5.1.2. Mid-Level Participants (Traders/ Agents/ Brokers)

            3.5.1.3. Wholesalers and Distributors

        3.5.2. Value Added and Value Created at Node in the Supply Chain

        3.5.3. List of Raw Material Suppliers

        3.5.4. List of Existing and Potential Buyers

    3.6. Investment Feasibility Matrix

    3.7. Value Chain Analysis

        3.7.1. Profit Margin Analysis

        3.7.2. Wholesalers and Distributors

        3.7.3. Retailers

    3.8. PESTLE and Porter’s Analysis

    3.9. Regulatory Landscape

        3.9.1. By Key Regions

        3.9.2. By Key Countries

    3.10. Regional Parent Market Outlook

    3.11. Production and Consumption Statistics

    3.12. Import and Export Statistics

4. Global Market Analysis 2017 to 2021 and Forecast, 2022 to 2032

    4.1. Historical Market Size Value (US$ Million) & Volume (Tons) Analysis, 2017 to 2021

    4.2. Current and Future Market Size Value (US$ Million) & Volume (Tons) Projections, 2022 to 2032

        4.2.1. Y-o-Y Growth Trend Analysis

        4.2.2. Absolute $ Opportunity Analysis

5. Global Market Analysis 2017 to 2021 and Forecast 2022 to 2032, By Product Type

    5.1. Introduction / Key Findings

    5.2. Historical Market Size Value (US$ Million) & Volume (Tons) Analysis By Product Type, 2017 to 2021

    5.3. Current and Future Market Size Value (US$ Million) & Volume (Tons) Analysis and Forecast By Product Type, 2022 to 2032

        5.3.1. Glyphosate

        5.3.2. Diquat

        5.3.3. Atrazine

        5.3.4. Acetochlor

        5.3.5. 2,4-D

        5.3.6. Paraquat

        5.3.7. Others

    5.4. Y-o-Y Growth Trend Analysis By Product Type, 2017 to 2021

    5.5. Absolute $ Opportunity Analysis By Product Type, 2022 to 2032 Deep-dive segmentation will be available in the sample on request

6. Global Market Analysis 2017 to 2021 and Forecast 2022 to 2032, By Mode of Action

    6.1. Introduction / Key Findings

    6.2. Historical Market Size Value (US$ Million) & Volume (Tons) Analysis By Mode of Action, 2017 to 2021

    6.3. Current and Future Market Size Value (US$ Million) & Volume (Tons) Analysis and Forecast By Mode of Action, 2022 to 2032

        6.3.1. Non-Selective

        6.3.2. Selective

    6.4. Y-o-Y Growth Trend Analysis By Mode of Action, 2017 to 2021

    6.5. Absolute $ Opportunity Analysis By Mode of Action, 2022 to 2032 Deep-dive segmentation will be available in the sample on request

7. Global Market Analysis 2017 to 2021 and Forecast 2022 to 2032, By Crop Type

    7.1. Introduction / Key Findings

    7.2. Historical Market Size Value (US$ Million) & Volume (Tons) Analysis By Crop Type, 2017 to 2021

    7.3. Current and Future Market Size Value (US$ Million) & Volume (Tons) Analysis and Forecast By Crop Type, 2022 to 2032

        7.3.1. Cereals & Grains

        7.3.2. Oilseeds & Pulses

        7.3.3. Fruits & Vegetables

        7.3.4. Others

    7.4. Y-o-Y Growth Trend Analysis By Crop Type, 2017 to 2021

    7.5. Absolute $ Opportunity Analysis By Crop Type, 2022 to 2032 Deep-dive segmentation will be available in the sample on request

8. Global Market Analysis 2017 to 2021 and Forecast 2022 to 2032, By Region

    8.1. Introduction

    8.2. Historical Market Size Value (US$ Million) & Volume (Tons) Analysis By Region, 2017 to 2021

    8.3. Current Market Size Value (US$ Million) & Volume (Tons) Analysis and Forecast By Region, 2022 to 2032

        8.3.1. North America

        8.3.2. Latin America

        8.3.3. Europe

        8.3.4. East Asia

        8.3.5. South Asia & Pacific

        8.3.6. Middle East and Africa

    8.4. Market Attractiveness Analysis By Region

9. North America Market Analysis 2017 to 2021 and Forecast 2022 to 2032, By Country

    9.1. Historical Market Size Value (US$ Million) & Volume (Tons) Trend Analysis By Market Taxonomy, 2017 to 2021

    9.2. Market Size Value (US$ Million) & Volume (Tons) Forecast By Market Taxonomy, 2022 to 2032

        9.2.1. By Country

            9.2.1.1. USA

            9.2.1.2. Canada

        9.2.2. By Product Type

        9.2.3. By Mode of Action

        9.2.4. By Crop Type

    9.3. Market Attractiveness Analysis

        9.3.1. By Country

        9.3.2. By Product Type

        9.3.3. By Mode of Action

        9.3.4. By Crop Type

    9.4. Key Takeaways

10. Latin America Market Analysis 2017 to 2021 and Forecast 2022 to 2032, By Country

    10.1. Historical Market Size Value (US$ Million) & Volume (Tons) Trend Analysis By Market Taxonomy, 2017 to 2021

    10.2. Market Size Value (US$ Million) & Volume (Tons) Forecast By Market Taxonomy, 2022 to 2032

        10.2.1. By Country

            10.2.1.1. Brazil

            10.2.1.2. Mexico

            10.2.1.3. Rest of Latin America

        10.2.2. By Product Type

        10.2.3. By Mode of Action

        10.2.4. By Crop Type

    10.3. Market Attractiveness Analysis

        10.3.1. By Country

        10.3.2. By Product Type

        10.3.3. By Mode of Action

        10.3.4. By Crop Type

    10.4. Key Takeaways

11. Europe Market Analysis 2017 to 2021 and Forecast 2022 to 2032, By Country

    11.1. Historical Market Size Value (US$ Million) & Volume (Tons) Trend Analysis By Market Taxonomy, 2017 to 2021

    11.2. Market Size Value (US$ Million) & Volume (Tons) Forecast By Market Taxonomy, 2022 to 2032

        11.2.1. By Country

            11.2.1.1. Germany

            11.2.1.2. United Kingdom

            11.2.1.3. France

            11.2.1.4. Spain

            11.2.1.5. Italy

            11.2.1.6. Rest of Europe

        11.2.2. By Product Type

        11.2.3. By Mode of Action

        11.2.4. By Crop Type

    11.3. Market Attractiveness Analysis

        11.3.1. By Country

        11.3.2. By Product Type

        11.3.3. By Mode of Action

        11.3.4. By Crop Type

    11.4. Key Takeaways

12. East Asia Market Analysis 2017 to 2021 and Forecast 2022 to 2032, By Country

    12.1. Historical Market Size Value (US$ Million) & Volume (Tons) Trend Analysis By Market Taxonomy, 2017 to 2021

    12.2. Market Size Value (US$ Million) & Volume (Tons) Forecast By Market Taxonomy, 2022 to 2032

        12.2.1. By Country

            12.2.1.1. China

            12.2.1.2. Japan

            12.2.1.3. South Korea

        12.2.2. By Product Type

        12.2.3. By Mode of Action

        12.2.4. By Crop Type

    12.3. Market Attractiveness Analysis

        12.3.1. By Country

        12.3.2. By Product Type

        12.3.3. By Mode of Action

        12.3.4. By Crop Type

    12.4. Key Takeaways

13. South Asia & Pacific Market Analysis 2017 to 2021 and Forecast 2022 to 2032, By Country

    13.1. Historical Market Size Value (US$ Million) & Volume (Tons) Trend Analysis By Market Taxonomy, 2017 to 2021

    13.2. Market Size Value (US$ Million) & Volume (Tons) Forecast By Market Taxonomy, 2022 to 2032

        13.2.1. By Country

            13.2.1.1. India

            13.2.1.2. Thailand

            13.2.1.3. Indonesia

            13.2.1.4. Malaysia

            13.2.1.5. Singapore

            13.2.1.6. Australia

            13.2.1.7. New Zealand

            13.2.1.8. Rest of South Asia & Pacific

        13.2.2. By Product Type

        13.2.3. By Mode of Action

        13.2.4. By Crop Type

    13.3. Market Attractiveness Analysis

        13.3.1. By Country

        13.3.2. By Product Type

        13.3.3. By Mode of Action

        13.3.4. By Crop Type

    13.4. Key Takeaways

14. Middle East and Africa Market Analysis 2017 to 2021 and Forecast 2022 to 2032, By Country

    14.1. Historical Market Size Value (US$ Million) & Volume (Tons) Trend Analysis By Market Taxonomy, 2017 to 2021

    14.2. Market Size Value (US$ Million) & Volume (Tons) Forecast By Market Taxonomy, 2022 to 2032

        14.2.1. By Country

            14.2.1.1. GCC Countries

            14.2.1.2. South Africa

            14.2.1.3. Israel

            14.2.1.4. Rest of Middle East and Africa

        14.2.2. By Product Type

        14.2.3. By Mode of Action

        14.2.4. By Crop Type

    14.3. Market Attractiveness Analysis

        14.3.1. By Country

        14.3.2. By Product Type

        14.3.3. By Mode of Action

        14.3.4. By Crop Type

    14.4. Key Takeaways

15. Key Countries Market Analysis

    15.1. USA

        15.1.1. Pricing Analysis

        15.1.2. Market Share Analysis, 2021

            15.1.2.1. By Product Type

            15.1.2.2. By Mode of Action

            15.1.2.3. By Crop Type

    15.2. Canada

        15.2.1. Pricing Analysis

        15.2.2. Market Share Analysis, 2021

            15.2.2.1. By Product Type

            15.2.2.2. By Mode of Action

            15.2.2.3. By Crop Type

    15.3. Brazil

        15.3.1. Pricing Analysis

        15.3.2. Market Share Analysis, 2021

            15.3.2.1. By Product Type

            15.3.2.2. By Mode of Action

            15.3.2.3. By Crop Type

    15.4. Mexico

        15.4.1. Pricing Analysis

        15.4.2. Market Share Analysis, 2021

            15.4.2.1. By Product Type

            15.4.2.2. By Mode of Action

            15.4.2.3. By Crop Type

    15.5. Germany

        15.5.1. Pricing Analysis

        15.5.2. Market Share Analysis, 2021

            15.5.2.1. By Product Type

            15.5.2.2. By Mode of Action

            15.5.2.3. By Crop Type

    15.6. United Kingdom

        15.6.1. Pricing Analysis

        15.6.2. Market Share Analysis, 2021

            15.6.2.1. By Product Type

            15.6.2.2. By Mode of Action

            15.6.2.3. By Crop Type

    15.7. France

        15.7.1. Pricing Analysis

        15.7.2. Market Share Analysis, 2021

            15.7.2.1. By Product Type

            15.7.2.2. By Mode of Action

            15.7.2.3. By Crop Type

    15.8. Spain

        15.8.1. Pricing Analysis

        15.8.2. Market Share Analysis, 2021

            15.8.2.1. By Product Type

            15.8.2.2. By Mode of Action

            15.8.2.3. By Crop Type

    15.9. Italy

        15.9.1. Pricing Analysis

        15.9.2. Market Share Analysis, 2021

            15.9.2.1. By Product Type

            15.9.2.2. By Mode of Action

            15.9.2.3. By Crop Type

    15.10. China

        15.10.1. Pricing Analysis

        15.10.2. Market Share Analysis, 2021

            15.10.2.1. By Product Type

            15.10.2.2. By Mode of Action

            15.10.2.3. By Crop Type

    15.11. Japan

        15.11.1. Pricing Analysis

        15.11.2. Market Share Analysis, 2021

            15.11.2.1. By Product Type

            15.11.2.2. By Mode of Action

            15.11.2.3. By Crop Type

    15.12. South Korea

        15.12.1. Pricing Analysis

        15.12.2. Market Share Analysis, 2021

            15.12.2.1. By Product Type

            15.12.2.2. By Mode of Action

            15.12.2.3. By Crop Type

    15.13. India

        15.13.1. Pricing Analysis

        15.13.2. Market Share Analysis, 2021

            15.13.2.1. By Product Type

            15.13.2.2. By Mode of Action

            15.13.2.3. By Crop Type

    15.14. Thailand

        15.14.1. Pricing Analysis

        15.14.2. Market Share Analysis, 2021

            15.14.2.1. By Product Type

            15.14.2.2. By Mode of Action

            15.14.2.3. By Crop Type

    15.15. Indonesia

        15.15.1. Pricing Analysis

        15.15.2. Market Share Analysis, 2021

            15.15.2.1. By Product Type

            15.15.2.2. By Mode of Action

            15.15.2.3. By Crop Type

    15.16. Malaysia

        15.16.1. Pricing Analysis

        15.16.2. Market Share Analysis, 2021

            15.16.2.1. By Product Type

            15.16.2.2. By Mode of Action

            15.16.2.3. By Crop Type

    15.17. Singapore

        15.17.1. Pricing Analysis

        15.17.2. Market Share Analysis, 2021

            15.17.2.1. By Product Type

            15.17.2.2. By Mode of Action

            15.17.2.3. By Crop Type

    15.18. Australia

        15.18.1. Pricing Analysis

        15.18.2. Market Share Analysis, 2021

            15.18.2.1. By Product Type

            15.18.2.2. By Mode of Action

            15.18.2.3. By Crop Type

    15.19. New Zealand

        15.19.1. Pricing Analysis

        15.19.2. Market Share Analysis, 2021

            15.19.2.1. By Product Type

            15.19.2.2. By Mode of Action

            15.19.2.3. By Crop Type

    15.20. GCC Countries

        15.20.1. Pricing Analysis

        15.20.2. Market Share Analysis, 2021

            15.20.2.1. By Product Type

            15.20.2.2. By Mode of Action

            15.20.2.3. By Crop Type

    15.21. South Africa

        15.21.1. Pricing Analysis

        15.21.2. Market Share Analysis, 2021

            15.21.2.1. By Product Type

            15.21.2.2. By Mode of Action

            15.21.2.3. By Crop Type

    15.22. Israel

        15.22.1. Pricing Analysis

        15.22.2. Market Share Analysis, 2021

            15.22.2.1. By Product Type

            15.22.2.2. By Mode of Action

            15.22.2.3. By Crop Type

16. Market Structure Analysis

    16.1. Competition Dashboard

    16.2. Competition Benchmarking

    16.3. Market Share Analysis of Top Players

        16.3.1. By Regional

        16.3.2. By Product Type

        16.3.3. By Mode of Action

        16.3.4. By Crop Type

17. Competition Analysis

    17.1. Competition Deep Dive

        17.1.1. BASF SE

            17.1.1.1. Overview

            17.1.1.2. Product Portfolio

            17.1.1.3. Profitability by Market Segments

            17.1.1.4. Sales Footprint

            17.1.1.5. Strategy Overview

                17.1.1.5.1. Marketing Strategy

                17.1.1.5.2. Product Strategy

                17.1.1.5.3. Channel Strategy

        17.1.2. DowDupont Inc.

            17.1.2.1. Overview

            17.1.2.2. Product Portfolio

            17.1.2.3. Profitability by Market Segments

            17.1.2.4. Sales Footprint

            17.1.2.5. Strategy Overview

                17.1.2.5.1. Marketing Strategy

                17.1.2.5.2. Product Strategy

                17.1.2.5.3. Channel Strategy

        17.1.3. Bayer AG

            17.1.3.1. Overview

            17.1.3.2. Product Portfolio

            17.1.3.3. Profitability by Market Segments

            17.1.3.4. Sales Footprint

            17.1.3.5. Strategy Overview

                17.1.3.5.1. Marketing Strategy

                17.1.3.5.2. Product Strategy

                17.1.3.5.3. Channel Strategy

        17.1.4. FMC Corporation

            17.1.4.1. Overview

            17.1.4.2. Product Portfolio

            17.1.4.3. Profitability by Market Segments

            17.1.4.4. Sales Footprint

            17.1.4.5. Strategy Overview

                17.1.4.5.1. Marketing Strategy

                17.1.4.5.2. Product Strategy

                17.1.4.5.3. Channel Strategy

        17.1.5. Syngenta AG

            17.1.5.1. Overview

            17.1.5.2. Product Portfolio

            17.1.5.3. Profitability by Market Segments

            17.1.5.4. Sales Footprint

            17.1.5.5. Strategy Overview

                17.1.5.5.1. Marketing Strategy

                17.1.5.5.2. Product Strategy

                17.1.5.5.3. Channel Strategy

        17.1.6. Nufarm Limited

            17.1.6.1. Overview

            17.1.6.2. Product Portfolio

            17.1.6.3. Profitability by Market Segments

            17.1.6.4. Sales Footprint

            17.1.6.5. Strategy Overview

                17.1.6.5.1. Marketing Strategy

                17.1.6.5.2. Product Strategy

                17.1.6.5.3. Channel Strategy

        17.1.7. Nissan Chemical Industries Ltd.

            17.1.7.1. Overview

            17.1.7.2. Product Portfolio

            17.1.7.3. Profitability by Market Segments

            17.1.7.4. Sales Footprint

            17.1.7.5. Strategy Overview

                17.1.7.5.1. Marketing Strategy

                17.1.7.5.2. Product Strategy

                17.1.7.5.3. Channel Strategy

        17.1.8. Drexel Chemical Company

            17.1.8.1. Overview

            17.1.8.2. Product Portfolio

            17.1.8.3. Profitability by Market Segments

            17.1.8.4. Sales Footprint

            17.1.8.5. Strategy Overview

                17.1.8.5.1. Marketing Strategy

                17.1.8.5.2. Product Strategy

                17.1.8.5.3. Channel Strategy

        17.1.9. ADAMA Germany GmbH

            17.1.9.1. Overview

            17.1.9.2. Product Portfolio

            17.1.9.3. Profitability by Market Segments

            17.1.9.4. Sales Footprint

            17.1.9.5. Strategy Overview

                17.1.9.5.1. Marketing Strategy

                17.1.9.5.2. Product Strategy

                17.1.9.5.3. Channel Strategy

        17.1.10. Otsuka AgriTechno Co Ltd

            17.1.10.1. Overview

            17.1.10.2. Product Portfolio

            17.1.10.3. Profitability by Market Segments

            17.1.10.4. Sales Footprint

            17.1.10.5. Strategy Overview

                17.1.10.5.1. Marketing Strategy

                17.1.10.5.2. Product Strategy

                17.1.10.5.3. Channel Strategy

        17.1.11. King Tech Corp

            17.1.11.1. Overview

            17.1.11.2. Product Portfolio

            17.1.11.3. Profitability by Market Segments

            17.1.11.4. Sales Footprint

            17.1.11.5. Strategy Overview

                17.1.11.5.1. Marketing Strategy

                17.1.11.5.2. Product Strategy

                17.1.11.5.3. Channel Strategy

        17.1.12. BR Agrotech Ltd

            17.1.12.1. Overview

            17.1.12.2. Product Portfolio

            17.1.12.3. Profitability by Market Segments

            17.1.12.4. Sales Footprint

            17.1.12.5. Strategy Overview

                17.1.12.5.1. Marketing Strategy

                17.1.12.5.2. Product Strategy

                17.1.12.5.3. Channel Strategy

18. Assumptions & Acronyms Used

19. Research Methodology

Don't pay for what you don't need

Customize your report by selecting specific countries or regions and save 30%!

List of Tables

Table 1: Global Market Value (US$ Million) Forecast by Region, 2017 to 2032

Table 2: Global Market Volume (Tons) Forecast by Region, 2017 to 2032

Table 3: Global Market Value (US$ Million) Forecast by Product Type, 2017 to 2032

Table 4: Global Market Volume (Tons) Forecast by Product Type, 2017 to 2032

Table 5: Global Market Value (US$ Million) Forecast by Mode of Action, 2017 to 2032

Table 6: Global Market Volume (Tons) Forecast by Mode of Action, 2017 to 2032

Table 7: Global Market Value (US$ Million) Forecast by Crop Type, 2017 to 2032

Table 8: Global Market Volume (Tons) Forecast by Crop Type, 2017 to 2032

Table 9: North America Market Value (US$ Million) Forecast by Country, 2017 to 2032

Table 10: North America Market Volume (Tons) Forecast by Country, 2017 to 2032

Table 11: North America Market Value (US$ Million) Forecast by Product Type, 2017 to 2032

Table 12: North America Market Volume (Tons) Forecast by Product Type, 2017 to 2032

Table 13: North America Market Value (US$ Million) Forecast by Mode of Action, 2017 to 2032

Table 14: North America Market Volume (Tons) Forecast by Mode of Action, 2017 to 2032

Table 15: North America Market Value (US$ Million) Forecast by Crop Type, 2017 to 2032

Table 16: North America Market Volume (Tons) Forecast by Crop Type, 2017 to 2032

Table 17: Latin America Market Value (US$ Million) Forecast by Country, 2017 to 2032

Table 18: Latin America Market Volume (Tons) Forecast by Country, 2017 to 2032

Table 19: Latin America Market Value (US$ Million) Forecast by Product Type, 2017 to 2032

Table 20: Latin America Market Volume (Tons) Forecast by Product Type, 2017 to 2032

Table 21: Latin America Market Value (US$ Million) Forecast by Mode of Action, 2017 to 2032

Table 22: Latin America Market Volume (Tons) Forecast by Mode of Action, 2017 to 2032

Table 23: Latin America Market Value (US$ Million) Forecast by Crop Type, 2017 to 2032

Table 24: Latin America Market Volume (Tons) Forecast by Crop Type, 2017 to 2032

Table 25: Europe Market Value (US$ Million) Forecast by Country, 2017 to 2032

Table 26: Europe Market Volume (Tons) Forecast by Country, 2017 to 2032

Table 27: Europe Market Value (US$ Million) Forecast by Product Type, 2017 to 2032

Table 28: Europe Market Volume (Tons) Forecast by Product Type, 2017 to 2032

Table 29: Europe Market Value (US$ Million) Forecast by Mode of Action, 2017 to 2032

Table 30: Europe Market Volume (Tons) Forecast by Mode of Action, 2017 to 2032

Table 31: Europe Market Value (US$ Million) Forecast by Crop Type, 2017 to 2032

Table 32: Europe Market Volume (Tons) Forecast by Crop Type, 2017 to 2032

Table 33: East Asia Market Value (US$ Million) Forecast by Country, 2017 to 2032

Table 34: East Asia Market Volume (Tons) Forecast by Country, 2017 to 2032

Table 35: East Asia Market Value (US$ Million) Forecast by Product Type, 2017 to 2032

Table 36: East Asia Market Volume (Tons) Forecast by Product Type, 2017 to 2032

Table 37: East Asia Market Value (US$ Million) Forecast by Mode of Action, 2017 to 2032

Table 38: East Asia Market Volume (Tons) Forecast by Mode of Action, 2017 to 2032

Table 39: East Asia Market Value (US$ Million) Forecast by Crop Type, 2017 to 2032

Table 40: East Asia Market Volume (Tons) Forecast by Crop Type, 2017 to 2032

Table 41: South Asia & Pacific Market Value (US$ Million) Forecast by Country, 2017 to 2032

Table 42: South Asia & Pacific Market Volume (Tons) Forecast by Country, 2017 to 2032

Table 43: South Asia & Pacific Market Value (US$ Million) Forecast by Product Type, 2017 to 2032

Table 44: South Asia & Pacific Market Volume (Tons) Forecast by Product Type, 2017 to 2032

Table 45: South Asia & Pacific Market Value (US$ Million) Forecast by Mode of Action, 2017 to 2032

Table 46: South Asia & Pacific Market Volume (Tons) Forecast by Mode of Action, 2017 to 2032

Table 47: South Asia & Pacific Market Value (US$ Million) Forecast by Crop Type, 2017 to 2032

Table 48: South Asia & Pacific Market Volume (Tons) Forecast by Crop Type, 2017 to 2032

Table 49: MEA Market Value (US$ Million) Forecast by Country, 2017 to 2032

Table 50: MEA Market Volume (Tons) Forecast by Country, 2017 to 2032

Table 51: MEA Market Value (US$ Million) Forecast by Product Type, 2017 to 2032

Table 52: MEA Market Volume (Tons) Forecast by Product Type, 2017 to 2032

Table 53: MEA Market Value (US$ Million) Forecast by Mode of Action, 2017 to 2032

Table 54: MEA Market Volume (Tons) Forecast by Mode of Action, 2017 to 2032

Table 55: MEA Market Value (US$ Million) Forecast by Crop Type, 2017 to 2032

Table 56: MEA Market Volume (Tons) Forecast by Crop Type, 2017 to 2032
Nikhil Kaitwade
Nikhil Kaitwade

Principal Consultant

Talk to Analyst

Find your sweet spots for generating winning opportunities in this market.

List of Charts

Figure 1: Global Market Value (US$ Million) by Product Type, 2022 to 2032

Figure 2: Global Market Value (US$ Million) by Mode of Action, 2022 to 2032

Figure 3: Global Market Value (US$ Million) by Crop Type, 2022 to 2032

Figure 4: Global Market Value (US$ Million) by Region, 2022 to 2032

Figure 5: Global Market Value (US$ Million) Analysis by Region, 2017 to 2032

Figure 6: Global Market Volume (Tons) Analysis by Region, 2017 to 2032

Figure 7: Global Market Value Share (%) and BPS Analysis by Region, 2022 to 2032

Figure 8: Global Market Y-o-Y Growth (%) Projections by Region, 2022 to 2032

Figure 9: Global Market Value (US$ Million) Analysis by Product Type, 2017 to 2032

Figure 10: Global Market Volume (Tons) Analysis by Product Type, 2017 to 2032

Figure 11: Global Market Value Share (%) and BPS Analysis by Product Type, 2022 to 2032

Figure 12: Global Market Y-o-Y Growth (%) Projections by Product Type, 2022 to 2032

Figure 13: Global Market Value (US$ Million) Analysis by Mode of Action, 2017 to 2032

Figure 14: Global Market Volume (Tons) Analysis by Mode of Action, 2017 to 2032

Figure 15: Global Market Value Share (%) and BPS Analysis by Mode of Action, 2022 to 2032

Figure 16: Global Market Y-o-Y Growth (%) Projections by Mode of Action, 2022 to 2032

Figure 17: Global Market Value (US$ Million) Analysis by Crop Type, 2017 to 2032

Figure 18: Global Market Volume (Tons) Analysis by Crop Type, 2017 to 2032

Figure 19: Global Market Value Share (%) and BPS Analysis by Crop Type, 2022 to 2032

Figure 20: Global Market Y-o-Y Growth (%) Projections by Crop Type, 2022 to 2032

Figure 21: Global Market Attractiveness by Product Type, 2022 to 2032

Figure 22: Global Market Attractiveness by Mode of Action, 2022 to 2032

Figure 23: Global Market Attractiveness by Crop Type, 2022 to 2032

Figure 24: Global Market Attractiveness by Region, 2022 to 2032

Figure 25: North America Market Value (US$ Million) by Product Type, 2022 to 2032

Figure 26: North America Market Value (US$ Million) by Mode of Action, 2022 to 2032

Figure 27: North America Market Value (US$ Million) by Crop Type, 2022 to 2032

Figure 28: North America Market Value (US$ Million) by Country, 2022 to 2032

Figure 29: North America Market Value (US$ Million) Analysis by Country, 2017 to 2032

Figure 30: North America Market Volume (Tons) Analysis by Country, 2017 to 2032

Figure 31: North America Market Value Share (%) and BPS Analysis by Country, 2022 to 2032

Figure 32: North America Market Y-o-Y Growth (%) Projections by Country, 2022 to 2032

Figure 33: North America Market Value (US$ Million) Analysis by Product Type, 2017 to 2032

Figure 34: North America Market Volume (Tons) Analysis by Product Type, 2017 to 2032

Figure 35: North America Market Value Share (%) and BPS Analysis by Product Type, 2022 to 2032

Figure 36: North America Market Y-o-Y Growth (%) Projections by Product Type, 2022 to 2032

Figure 37: North America Market Value (US$ Million) Analysis by Mode of Action, 2017 to 2032

Figure 38: North America Market Volume (Tons) Analysis by Mode of Action, 2017 to 2032

Figure 39: North America Market Value Share (%) and BPS Analysis by Mode of Action, 2022 to 2032

Figure 40: North America Market Y-o-Y Growth (%) Projections by Mode of Action, 2022 to 2032

Figure 41: North America Market Value (US$ Million) Analysis by Crop Type, 2017 to 2032

Figure 42: North America Market Volume (Tons) Analysis by Crop Type, 2017 to 2032

Figure 43: North America Market Value Share (%) and BPS Analysis by Crop Type, 2022 to 2032

Figure 44: North America Market Y-o-Y Growth (%) Projections by Crop Type, 2022 to 2032

Figure 45: North America Market Attractiveness by Product Type, 2022 to 2032

Figure 46: North America Market Attractiveness by Mode of Action, 2022 to 2032

Figure 47: North America Market Attractiveness by Crop Type, 2022 to 2032

Figure 48: North America Market Attractiveness by Country, 2022 to 2032

Figure 49: Latin America Market Value (US$ Million) by Product Type, 2022 to 2032

Figure 50: Latin America Market Value (US$ Million) by Mode of Action, 2022 to 2032

Figure 51: Latin America Market Value (US$ Million) by Crop Type, 2022 to 2032

Figure 52: Latin America Market Value (US$ Million) by Country, 2022 to 2032

Figure 53: Latin America Market Value (US$ Million) Analysis by Country, 2017 to 2032

Figure 54: Latin America Market Volume (Tons) Analysis by Country, 2017 to 2032

Figure 55: Latin America Market Value Share (%) and BPS Analysis by Country, 2022 to 2032

Figure 56: Latin America Market Y-o-Y Growth (%) Projections by Country, 2022 to 2032

Figure 57: Latin America Market Value (US$ Million) Analysis by Product Type, 2017 to 2032

Figure 58: Latin America Market Volume (Tons) Analysis by Product Type, 2017 to 2032

Figure 59: Latin America Market Value Share (%) and BPS Analysis by Product Type, 2022 to 2032

Figure 60: Latin America Market Y-o-Y Growth (%) Projections by Product Type, 2022 to 2032

Figure 61: Latin America Market Value (US$ Million) Analysis by Mode of Action, 2017 to 2032

Figure 62: Latin America Market Volume (Tons) Analysis by Mode of Action, 2017 to 2032

Figure 63: Latin America Market Value Share (%) and BPS Analysis by Mode of Action, 2022 to 2032

Figure 64: Latin America Market Y-o-Y Growth (%) Projections by Mode of Action, 2022 to 2032

Figure 65: Latin America Market Value (US$ Million) Analysis by Crop Type, 2017 to 2032

Figure 66: Latin America Market Volume (Tons) Analysis by Crop Type, 2017 to 2032

Figure 67: Latin America Market Value Share (%) and BPS Analysis by Crop Type, 2022 to 2032

Figure 68: Latin America Market Y-o-Y Growth (%) Projections by Crop Type, 2022 to 2032

Figure 69: Latin America Market Attractiveness by Product Type, 2022 to 2032

Figure 70: Latin America Market Attractiveness by Mode of Action, 2022 to 2032

Figure 71: Latin America Market Attractiveness by Crop Type, 2022 to 2032

Figure 72: Latin America Market Attractiveness by Country, 2022 to 2032

Figure 73: Europe Market Value (US$ Million) by Product Type, 2022 to 2032

Figure 74: Europe Market Value (US$ Million) by Mode of Action, 2022 to 2032

Figure 75: Europe Market Value (US$ Million) by Crop Type, 2022 to 2032

Figure 76: Europe Market Value (US$ Million) by Country, 2022 to 2032

Figure 77: Europe Market Value (US$ Million) Analysis by Country, 2017 to 2032

Figure 78: Europe Market Volume (Tons) Analysis by Country, 2017 to 2032

Figure 79: Europe Market Value Share (%) and BPS Analysis by Country, 2022 to 2032

Figure 80: Europe Market Y-o-Y Growth (%) Projections by Country, 2022 to 2032

Figure 81: Europe Market Value (US$ Million) Analysis by Product Type, 2017 to 2032

Figure 82: Europe Market Volume (Tons) Analysis by Product Type, 2017 to 2032

Figure 83: Europe Market Value Share (%) and BPS Analysis by Product Type, 2022 to 2032

Figure 84: Europe Market Y-o-Y Growth (%) Projections by Product Type, 2022 to 2032

Figure 85: Europe Market Value (US$ Million) Analysis by Mode of Action, 2017 to 2032

Figure 86: Europe Market Volume (Tons) Analysis by Mode of Action, 2017 to 2032

Figure 87: Europe Market Value Share (%) and BPS Analysis by Mode of Action, 2022 to 2032

Figure 88: Europe Market Y-o-Y Growth (%) Projections by Mode of Action, 2022 to 2032

Figure 89: Europe Market Value (US$ Million) Analysis by Crop Type, 2017 to 2032

Figure 90: Europe Market Volume (Tons) Analysis by Crop Type, 2017 to 2032

Figure 91: Europe Market Value Share (%) and BPS Analysis by Crop Type, 2022 to 2032

Figure 92: Europe Market Y-o-Y Growth (%) Projections by Crop Type, 2022 to 2032

Figure 93: Europe Market Attractiveness by Product Type, 2022 to 2032

Figure 94: Europe Market Attractiveness by Mode of Action, 2022 to 2032

Figure 95: Europe Market Attractiveness by Crop Type, 2022 to 2032

Figure 96: Europe Market Attractiveness by Country, 2022 to 2032

Figure 97: East Asia Market Value (US$ Million) by Product Type, 2022 to 2032

Figure 98: East Asia Market Value (US$ Million) by Mode of Action, 2022 to 2032

Figure 99: East Asia Market Value (US$ Million) by Crop Type, 2022 to 2032

Figure 100: East Asia Market Value (US$ Million) by Country, 2022 to 2032

Figure 101: East Asia Market Value (US$ Million) Analysis by Country, 2017 to 2032

Figure 102: East Asia Market Volume (Tons) Analysis by Country, 2017 to 2032

Figure 103: East Asia Market Value Share (%) and BPS Analysis by Country, 2022 to 2032

Figure 104: East Asia Market Y-o-Y Growth (%) Projections by Country, 2022 to 2032

Figure 105: East Asia Market Value (US$ Million) Analysis by Product Type, 2017 to 2032

Figure 106: East Asia Market Volume (Tons) Analysis by Product Type, 2017 to 2032

Figure 107: East Asia Market Value Share (%) and BPS Analysis by Product Type, 2022 to 2032

Figure 108: East Asia Market Y-o-Y Growth (%) Projections by Product Type, 2022 to 2032

Figure 109: East Asia Market Value (US$ Million) Analysis by Mode of Action, 2017 to 2032

Figure 110: East Asia Market Volume (Tons) Analysis by Mode of Action, 2017 to 2032

Figure 111: East Asia Market Value Share (%) and BPS Analysis by Mode of Action, 2022 to 2032

Figure 112: East Asia Market Y-o-Y Growth (%) Projections by Mode of Action, 2022 to 2032

Figure 113: East Asia Market Value (US$ Million) Analysis by Crop Type, 2017 to 2032

Figure 114: East Asia Market Volume (Tons) Analysis by Crop Type, 2017 to 2032

Figure 115: East Asia Market Value Share (%) and BPS Analysis by Crop Type, 2022 to 2032

Figure 116: East Asia Market Y-o-Y Growth (%) Projections by Crop Type, 2022 to 2032

Figure 117: East Asia Market Attractiveness by Product Type, 2022 to 2032

Figure 118: East Asia Market Attractiveness by Mode of Action, 2022 to 2032

Figure 119: East Asia Market Attractiveness by Crop Type, 2022 to 2032

Figure 120: East Asia Market Attractiveness by Country, 2022 to 2032

Figure 121: South Asia & Pacific Market Value (US$ Million) by Product Type, 2022 to 2032

Figure 122: South Asia & Pacific Market Value (US$ Million) by Mode of Action, 2022 to 2032

Figure 123: South Asia & Pacific Market Value (US$ Million) by Crop Type, 2022 to 2032

Figure 124: South Asia & Pacific Market Value (US$ Million) by Country, 2022 to 2032

Figure 125: South Asia & Pacific Market Value (US$ Million) Analysis by Country, 2017 to 2032

Figure 126: South Asia & Pacific Market Volume (Tons) Analysis by Country, 2017 to 2032

Figure 127: South Asia & Pacific Market Value Share (%) and BPS Analysis by Country, 2022 to 2032

Figure 128: South Asia & Pacific Market Y-o-Y Growth (%) Projections by Country, 2022 to 2032

Figure 129: South Asia & Pacific Market Value (US$ Million) Analysis by Product Type, 2017 to 2032

Figure 130: South Asia & Pacific Market Volume (Tons) Analysis by Product Type, 2017 to 2032

Figure 131: South Asia & Pacific Market Value Share (%) and BPS Analysis by Product Type, 2022 to 2032

Figure 132: South Asia & Pacific Market Y-o-Y Growth (%) Projections by Product Type, 2022 to 2032

Figure 133: South Asia & Pacific Market Value (US$ Million) Analysis by Mode of Action, 2017 to 2032

Figure 134: South Asia & Pacific Market Volume (Tons) Analysis by Mode of Action, 2017 to 2032

Figure 135: South Asia & Pacific Market Value Share (%) and BPS Analysis by Mode of Action, 2022 to 2032

Figure 136: South Asia & Pacific Market Y-o-Y Growth (%) Projections by Mode of Action, 2022 to 2032

Figure 137: South Asia & Pacific Market Value (US$ Million) Analysis by Crop Type, 2017 to 2032

Figure 138: South Asia & Pacific Market Volume (Tons) Analysis by Crop Type, 2017 to 2032

Figure 139: South Asia & Pacific Market Value Share (%) and BPS Analysis by Crop Type, 2022 to 2032

Figure 140: South Asia & Pacific Market Y-o-Y Growth (%) Projections by Crop Type, 2022 to 2032

Figure 141: South Asia & Pacific Market Attractiveness by Product Type, 2022 to 2032

Figure 142: South Asia & Pacific Market Attractiveness by Mode of Action, 2022 to 2032

Figure 143: South Asia & Pacific Market Attractiveness by Crop Type, 2022 to 2032

Figure 144: South Asia & Pacific Market Attractiveness by Country, 2022 to 2032

Figure 145: MEA Market Value (US$ Million) by Product Type, 2022 to 2032

Figure 146: MEA Market Value (US$ Million) by Mode of Action, 2022 to 2032

Figure 147: MEA Market Value (US$ Million) by Crop Type, 2022 to 2032

Figure 148: MEA Market Value (US$ Million) by Country, 2022 to 2032

Figure 149: MEA Market Value (US$ Million) Analysis by Country, 2017 to 2032

Figure 150: MEA Market Volume (Tons) Analysis by Country, 2017 to 2032

Figure 151: MEA Market Value Share (%) and BPS Analysis by Country, 2022 to 2032

Figure 152: MEA Market Y-o-Y Growth (%) Projections by Country, 2022 to 2032

Figure 153: MEA Market Value (US$ Million) Analysis by Product Type, 2017 to 2032

Figure 154: MEA Market Volume (Tons) Analysis by Product Type, 2017 to 2032

Figure 155: MEA Market Value Share (%) and BPS Analysis by Product Type, 2022 to 2032

Figure 156: MEA Market Y-o-Y Growth (%) Projections by Product Type, 2022 to 2032

Figure 157: MEA Market Value (US$ Million) Analysis by Mode of Action, 2017 to 2032

Figure 158: MEA Market Volume (Tons) Analysis by Mode of Action, 2017 to 2032

Figure 159: MEA Market Value Share (%) and BPS Analysis by Mode of Action, 2022 to 2032

Figure 160: MEA Market Y-o-Y Growth (%) Projections by Mode of Action, 2022 to 2032

Figure 161: MEA Market Value (US$ Million) Analysis by Crop Type, 2017 to 2032

Figure 162: MEA Market Volume (Tons) Analysis by Crop Type, 2017 to 2032

Figure 163: MEA Market Value Share (%) and BPS Analysis by Crop Type, 2022 to 2032

Figure 164: MEA Market Y-o-Y Growth (%) Projections by Crop Type, 2022 to 2032

Figure 165: MEA Market Attractiveness by Product Type, 2022 to 2032

Figure 166: MEA Market Attractiveness by Mode of Action, 2022 to 2032

Figure 167: MEA Market Attractiveness by Crop Type, 2022 to 2032

Figure 168: MEA Market Attractiveness by Country, 2022 to 2032

Explore Chemicals & Materials Insights

View Reports