Anti-aircraft Warfare Market Size and Share Forecast Outlook From 2024 to 2034

In 2024, the global Anti-Aircraft Warfare Market is projected to be worth USD 22.7 billion, and by 2034, it is likely to be worth USD 46.1 billion. The market is expected to grow at an average CAGR of 7.4% between 2024 and 2034.

To improve air defense capabilities against changing aerial threats, the industry is progressing via the integration of cutting-edge technology, such as sophisticated radar systems, missile defense systems, and network-centric capabilities.

Anti-aircraft warfare operations are changing due to the greater integration of advanced technology, including network-centric solutions and artificial intelligence, to improve real-time threat identification and interception capabilities.

To meet the changing needs of contemporary aerial threats, research and development endeavors are continuously directed toward enhancing the accuracy and range of anti-aircraft weapons.

Cooperative international initiatives and defense funding fuel the development of effective anti-aircraft warfare capabilities.

Sales Analysis of the Anti-aircraft Warfare

  • Regional turmoil and geopolitical disputes are driving expansion in the anti-aircraft warfare sector. To safeguard their airspace, these tensions force countries to improve their air defense capabilities and raise demand for anti-aircraft warfare systems.
  • The incorporation of cutting-edge technology to improve the precision and effectiveness of anti-aircraft warfare systems, such as artificial intelligence, machine learning, and sophisticated radar systems.
  • Increased focus on improving air defense capabilities is necessary to safeguard territory from prospective adversaries since the emergence of deadly, elegant, and autonomous threats has impacted the evolution of air-based warfare.
  • Advanced missile defense systems, including adaptive countermeasures and electronic warfare capabilities, are being developed and deployed to intercept and neutralize various aerial threats, enhancing the resilience of anti-aircraft defense systems.
  • Anti-aircraft warfare covers methods and tactics for guarding against hostile aircraft or missiles in the air or space. While active defense uses ground- and air-based weaponry to kill or neutralize hostile aircraft, passive defense relies on concealment and dispersion to reduce aerial attacks.
Attributes Details
Anti-aircraft Warfare Market Value for 2024 USD 22.7 billion
Anti-aircraft Warfare Market Size for 2034 USD 46.1 billion
Anti-aircraft Warfare Market Forecast CAGR for 2024 to 2034 7.4%

Sales Trend Analysis from Historical Performance Compared to Market Outlook for 2024 to 2034

This section provides a comprehensive analysis of the industry during the last five years, highlighting the trends expected to drive the market's growth in anti-aircraft warfare. A strong historical compound annual growth rate of 9.1% indicates a slowdown in the market. The industry is predicted to develop at a steady 7.4% CAGR until 2034.

Historical CAGR 9.1%
Forecast CAGR 7.4%

The development of electronic warfare and stealth tactics, financial restraints, and a reorientation of military priorities toward new threats are among the causes that are expected to have a detrimental effect on demand for anti-aircraft warfare.

Crucial factors that are anticipated to affect the sales of anti-aircraft warfare through 2034.

  • Potential adversaries' rise in stealth technology usage could diminish the effectiveness of conventional anti-aircraft warfare systems.
  • The increase in unmanned aerial vehicles poses challenges to anti-aircraft systems, necessitating potential adjustments to counter agile and smaller targets.
  • Focusing on asymmetric threats and cyber warfare in evolving defense strategies may decrease the need for traditional anti-aircraft warfare systems.
  • Developing and implementing alternative defense technologies, like directed energy weapons or hypersonic missiles, may divert attention and resources from traditional anti-aircraft strategies.

Top Market Dynamics and Industry Trends in the Anti-aircraft Warfare Sector

Expanding Utilization of Network-centric Warfare Tactics Spur Industry Growth

Network-centric warfare enhances the anti-aircraft warfare industry by fostering real-time communication and coordination among diverse defense systems. The system allows seamless integration of sensor data, intelligence, and rapid decision-making, optimizing the deployment of anti-aircraft assets.

This interconnected approach improves situational awareness, enabling quicker response to aerial threats.

With synchronized efforts and information sharing, network-centric warfare enhances anti-aircraft systems' effectiveness, accuracy, and efficiency, providing a robust defense against evolving airborne challenges in modern warfare scenarios. The utilization of the network-centric warfare system develops the demand for the anti-aircraft warfare infrastructure.

Demand for the Missile Defense Systems Booms the Global Industry

Missile defense systems stabilize the market by addressing security concerns and providing a layer of defense against ballistic missile threats.

As geopolitical tensions persist, demand for reliable defense creates a consistent market. Technological advancements in missile defense systems foster innovation, creating a dynamic market environment.

Government support and defense budgets allocate resources for research, development, and procuring advanced missile defense technologies, contributing to a stable and lucrative market. The arms race and missile proliferation threat drive nations to invest in sophisticated systems, ensuring strategic stability.

Rise of International Defense Collaboration Empowers the Warfare

By encouraging a common defense strategy among participating nations, international cooperation in anti-aircraft warfare increases demand. By fostering a collaborative knowledge of security concerns through shared intelligence on aerial threats, governments are encouraged to invest in cutting-edge anti-aircraft equipment.

Joint development efforts are frequently the outcome of collaborative initiatives, which save costs by taking advantage of economies of scale and promoting the adoption of cutting-edge technologies.

Demand is further increased by improved interoperability, which makes it possible for various defensive systems to function together flawlessly. Collaborative efforts to create strategic alliances lead to agreements on defense and a shared need for anti-aircraft systems.

The cooperative defense architecture guarantees a strong and coordinated reaction to changing aerial threats, discouraging possible enemies and advancing security.

Anti-aircraft Warfare Industry Analysis by Top Investment Segments

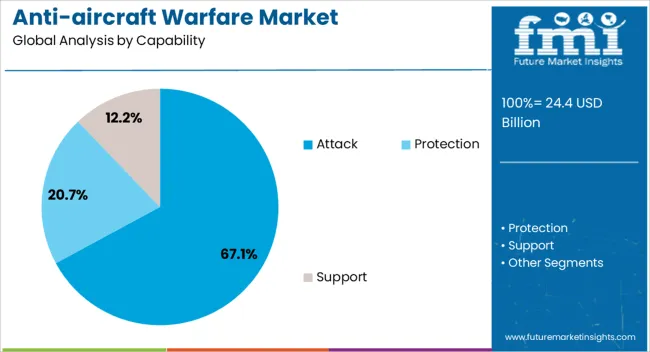
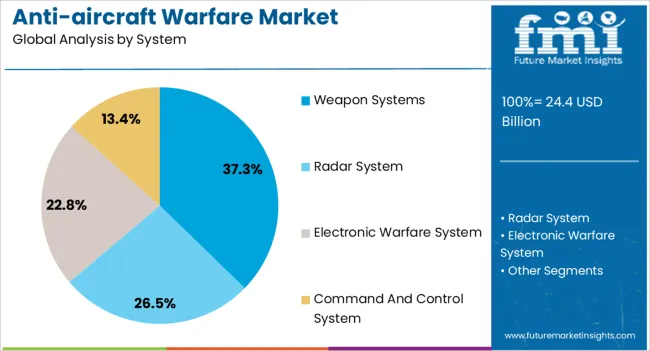
This section presents in-depth analyses of certain anti-aerial warfare industry segments. The two main subjects of the current research are the support segment in the capability category and weapon systems in the system category.

Support Capabilities Captures the Anti-aircraft Warfare Sector

Attributes Details
Top Capability Support
CAGR from 2024 to 2034 7.2%

With a promising CAGR of 7.2%, the support capabilities segment is expected to dominate the anti-aviation warfare market. This preference for support systems in anti-aircraft warfare can be attributed to several factors:

  • The increasing need for support capabilities against aircraft warfare necessitates integrating cutting-edge equipment to provide all-encompassing air defense.
  • Demand for more precise targeting capabilities, especially AI-powered solutions for quicker threat detection and increased precision.
  • A stronger focus on electronic warfare tools to interfere with and destroy opposing missile and aircraft systems.
  • Creating strong networking and communication infrastructure makes it easier for anti-aircraft defense units to coordinate with one another.
  • Extending the need for realistic training and simulation solutions to utilize anti-aircraft support capabilities effectively.

Advance Weapon Systems Buds in the Anti-aircraft Warfare Industry

Attributes Details
Top System Weapon Systems
CAGR from 2024 to 2034 7.0%

Weapon systems became the popular system category, with a moderate CAGR of 7.0%. The dominating factors can be described as follows:

  • Market players in the defense sector are exploring the integration of directed energy weapons as a cutting-edge solution for anti-aircraft defense.
  • The development of technologically advanced weapons with increased accuracy and range spurs demand for weaponry in the anti-ariel simulation.
  • The demand for more effective and adaptable anti-aircraft weapon systems such as anti-aircraft guns and anti-aircraft missiles from the evolving threats posed by advanced aerial platforms.
  • The need for all-encompassing weapon systems that can defeat a variety of threats is being fueled by the growing emphasis on integrated air defense systems.
  • The growing awareness of the value of multi-layered defensive measures drives the need for complementary anti-aircraft weapon systems.

Analysis of Top Countries Manufacturing, Certifying, and Deploying Anti-aircraft Warfare Technologies

The anti-aircraft warfare markets of several significant countries, including the United States, Japan, South Korea, China, and the United Kingdom, are examined in this section. This section discusses the factors that impact the demand, recognition, and sales of anti-aircraft warfare in particular nations.

Country CAGR from 2024 to 2034
United States 7.6%
Japan 9.0%
United Kingdom 8.6%
South Korea 8.9%
China 7.9%

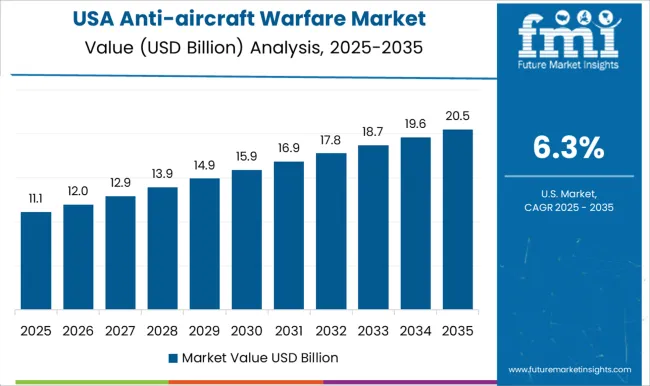
United States Defense Sector Develops the Advanced Ariel Defense Systems

Through 2034, the market for anti-aircraft warfare in the United States is anticipated to increase at a favorable CAGR of 7.6%, with an anticipated market value of USD 8.2 billion. Several of the key trends are as follows:
  • In the United States, there is a growing need for urbane aerial defense systems that seamlessly incorporate contemporary command and control infrastructures due to the trend toward network-centric warfare.
  • The anti-aircraft warfare sector in the United States has been driven by the demand for increased targeting capabilities, including AI-based systems for improved accuracy and quick threat recognition.
  • Demand in the United States increased due to the necessity of weapon systems outfitted with potent electronic warfare countermeasures to combat changing threats.

Digitalization of the Aviation Defense Sector Booms in Japan

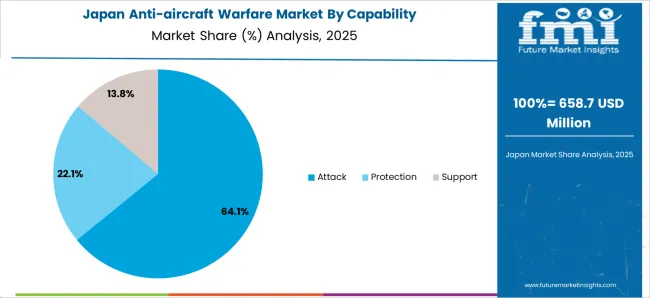
The anti-aircraft warfare market in Japan is expected to reach USD 5.1 billion in valuation by 2034 at a compound annual growth rate of 9.0%. The following are some of the main trends:

  • The Japanese government's supportive policies and efforts, including financing programs and research grants, encourage the adoption of anti-aircraft warfare methods in Japan's defense system.
  • Japan is working to increase the country's aviation security coverage to provide broader defense access and encourage the use of digital technology in airforce defense.
  • Creation and implementation of terrine smart warfare strategies that use digital technology to assist the Japanese Air Force adjust to shifting global circumstances.

China Develops Digitalization in the Aviation Warfare Tactics

The anti-aircraft warfare market in China is expected to grow at a promising rate of 7.9% and be valued at USD 7.2 billion by 2034. The following factors fuel this quick expansion:

  • Chinese government invests in advanced anti-aircraft systems, driving growth and innovation in the anti-aircraft warfare market.
  • Ongoing military modernization efforts contribute to increased demand for sophisticated anti-aircraft warfare capabilities in China.
  • China emphasizes domestic production, developing and manufacturing indigenous anti-aircraft systems to reduce reliance on foreign suppliers, boosting the anti-aircraft warfare market.

The United Kingdom’s Defense Sector Booms with Air Strategies Developments

Anti-aircraft warfare strategies are expected to be valued at USD 1.9 billion and grow at a rigid rate of 8.6% through 2034 in the United Kingdom. Among the main motivators are:
  • An increased emphasis on improving anti-aircraft defense capabilities results from increased geopolitical tensions in the United Kingdom.
  • The United Kingdom is developing a comprehensive strategy for anti-aircraft warfare by actively developing integrated air defense systems.
  • As a result of expanding capabilities, the United Kingdom may now export anti-aircraft systems, creating economic prospects.

South Korean Aircraft Security Industry Indulges the Modern Machinery

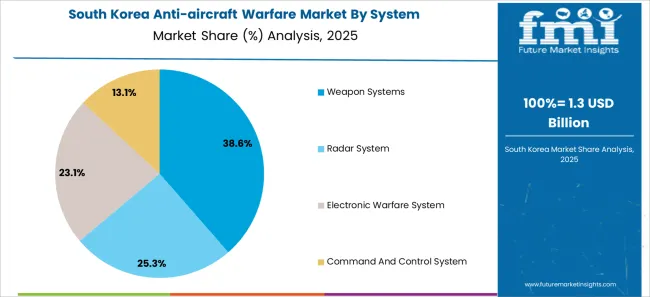
South Korea is seeing increased demand for anti-aircraft warfare, with a predicted CAGR of 8.9% and an anticipated value of USD 2.9 billion through 2034. Among the main trends are:

  • Significant investments in research and development demonstrate South Korea's dedication to improving its anti-aircraft combat capabilities.
  • The increased anti-aircraft capabilities of South Korea augment its regional sway and strategic locus in East Asia.
  • Improving anti-aircraft defensive capabilities is a priority because of increased geopolitical tensions at the country's airfields.

Strategic Institutions Influencing the Anti-aircraft Warfare Industry Outlook

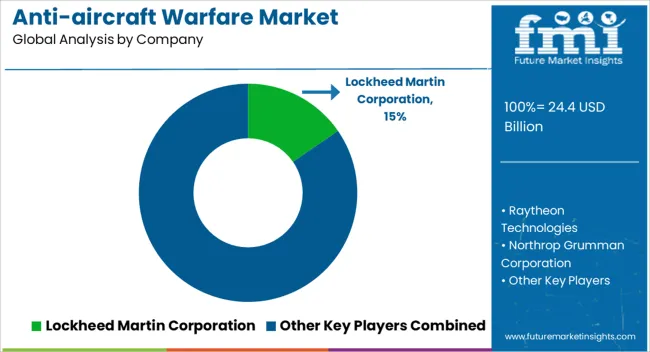
Market players in the anti-aircraft warfare industry play a pivotal role in shaping the landscape through innovative initiatives, strategic alliances, and a commitment to meeting contemporary defense needs.

Leading companies like Lockheed Martin Corporation and Raytheon Technologies are at the forefront, investing significantly in research and development to enhance technological capabilities.

Their focus spans advanced radar technologies, precision-guided missiles, and electronic warfare solutions, contributing to the continuous evolution of anti-aircraft systems.

Strategic collaborations and partnerships between industry giants, exemplified by MBDA and Northrop Grumman Corporation, foster international cooperation, developing sophisticated and interoperable anti-aircraft systems. Key market players actively seek to broaden their impact globally, exploring export opportunities and contributing to the defense capabilities of allied nations.

Developing integrated and multi-layered air defense solutions is a shared goal among industry leaders, addressing diverse threats and providing comprehensive protection against evolving aerial challenges.

A focus on integrating artificial intelligence and autonomous systems, as pursued by companies like BAE Systems plc, underscores the industry's commitment to leveraging cutting-edge technologies for quicker threat detection and response in anti-aircraft warfare.

Market participants also stress the significance of indigenous manufacturing capacities, which enable countries to lessen their reliance on foreign suppliers and promote self-sufficiency in anti-aircraft defense.

Together, the dynamic efforts of these sector leaders propel the anti-aircraft warfare market upward and guarantee that defense capabilities are anticipated to always evolve to successfully counter the complexity of contemporary airborne threats.

Recent Developments in the Anti-aircraft Warfare Industry:
  • In January 2024, SKYNEX developed an air defense system for Ukraine and allied nations, controlling up to four Oerlikon Revolver Gun Mk 3s using optics and sensors to identify targets of various sizes and speeds.
  • In January 2024, German manufacturers Rheinmetall, Diehl Defence, and Hensoldt attained a USD 1.35 billion contract to develop a Boxer-mounted anti-aircraft weapon system based on the IRIS-T missile, dividing the funds.
  • In December 2023, The United States Navy awarded L3 Technologies and Raytheon additional CEC support outside the United States, with work also performed by international partners in Australia, Canada, and Japan.
  • In April 2023, The Chinese People's Liberation Army (PLA) received a shipment of new self-propelled anti-aircraft systems, which defense analysts claimed were designed to counter drone threats.

Notable Players in the Business Landscape

  • Lockheed Martin Corporation
  • Raytheon Technologies
  • Northrop Grumman Corporation
  • BAE Systems plc
  • Thales Group
  • MBDA
  • Israel Aerospace Industries Ltd.
  • Kongsberg Gruppen ASA
  • Leonardo S.P.A.
  • Rafael Advanced Defense Systems Ltd.
  • Rheinmetall AG

Top Segments Studied in the Anti-aircraft Warfare Market

By Capability:

  • Support
  • Protection
  • Attack

By System:

  • Weapon Systems
    • o Anti Aircraft Gun
    • o Anti Aircraft Missile
    • Others
  • Radar System
  • Electronic Warfare System
  • Command and Control System

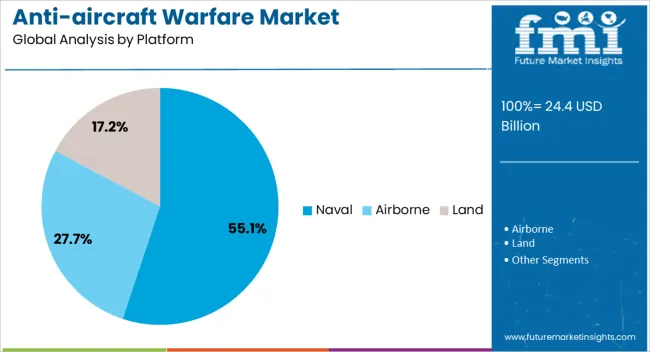
By Platform:

  • Airborne
    • Combat Aircraft
    • Military Helicopters
    • Unmanned Aerial Vehicles (UAVs)
  • Land
    • Military Vehicular
    • Dismounted Soldier
    • Fixed Stations
  • Naval
  • Naval Ships
  • Unmanned Surface Vehicles (USVS)

By Range:

  • Short Range (<20 Km)
  • Medium Range (20 to 100 Km)
  • Long Range (>100 Km)

By Region:

  • North America
  • Latin America
  • Europe
  • East Asia
  • South Asia
  • Oceania
  • The Middle East and Africa

Table of Content

  • 1. Executive Summary
  • 2. Market Overview
  • 3. Market Background
  • 4. Global Market Analysis 2019 to 2023 and Forecast, 2024 to 2034
  • 5. Global Market Analysis 2019 to 2023 and Forecast 2024 to 2034, By Capability
    • 5.1. Support
    • 5.2. Protection
    • 5.3. Attack
  • 6. Global Market Analysis 2019 to 2023 and Forecast 2024 to 2034, By System
    • 6.1. Weapon Systems
      • 6.1.1. Anti-Aircraft Gun
      • 6.1.2. Anti-Aircraft Missile
      • 6.1.3. Others
    • 6.2. Radar Systems
    • 6.3. Electronic Warfare System
    • 6.4. Command and Control Systems
    • 6.5. Others
  • 7. Global Market Analysis 2019 to 2023 and Forecast 2024 to 2034, By Platform
    • 7.1. Airborne
      • 7.1.1. Combat Aircraft
      • 7.1.2. Military Helicopters
      • 7.1.3. Unmanned Aerial Vehicles (UAVS)
    • 7.2. Land
      • 7.2.1. Military Vehicular
      • 7.2.2. Dismounted Soldier
      • 7.2.3. Fixed Stations
    • 7.3. Naval
      • 7.3.1. Naval Ships
      • 7.3.2. Unmanned Surface Vehicles (USVS)
  • 8. Global Market Analysis 2019 to 2023 and Forecast 2024 to 2034, By Range
    • 8.1. Short Range (<20 Km)
    • 8.2. Medium Range (20 – 100 km)
    • 8.3. Long Range (>100 km)
  • 9. Global Market Analysis 2019 to 2023 and Forecast 2024 to 2034, By Region
    • 9.1. North America
    • 9.2. Latin America
    • 9.3. Western Europe
    • 9.4. Eastern Europe
    • 9.5. South Asia and Pacific
    • 9.6. East Asia
    • 9.7. Middle East and Africa
  • 10. North America Market Analysis 2019 to 2023 and Forecast 2024 to 2034, By Country
  • 11. Latin America Market Analysis 2019 to 2023 and Forecast 2024 to 2034, By Country
  • 12. Western Europe Market Analysis 2019 to 2023 and Forecast 2024 to 2034, By Country
  • 13. Eastern Europe Market Analysis 2019 to 2023 and Forecast 2024 to 2034, By Country
  • 14. South Asia and Pacific Market Analysis 2019 to 2023 and Forecast 2024 to 2034, By Country
  • 15. East Asia Market Analysis 2019 to 2023 and Forecast 2024 to 2034, By Country
  • 16. Middle East and Africa Market Analysis 2019 to 2023 and Forecast 2024 to 2034, By Country
  • 17. Key Countries Market Analysis
  • 18. Market Structure Analysis
  • 19. Competition Analysis
    • 19.1. BAE Systems
    • 19.2. Israel Aerospace Industries Ltd.
    • 19.3. Kongsberg Gruppen ASA
    • 19.4. Leonardo S.p.A.
    • 19.5. Lockheed Martin Corporation
    • 19.6. Northrop Grumman Corporation
    • 19.7. Rafael Advanced Defense Systems Ltd.
    • 19.8. Raytheon Technologies Corporation
    • 19.9. Rheinmetall AG
    • 19.10. Thales Group
  • 20. Assumptions & Acronyms Used
  • 21. Research Methodology

List of Tables

Table 1: Global Market Value (US$ Million) Forecast by Region, 2019 to 2034

Table 2: Global Market Volume (Units) Forecast by Region, 2019 to 2034

Table 3: Global Market Value (US$ Million) Forecast by Capability, 2019 to 2034

Table 4: Global Market Volume (Units) Forecast by Capability, 2019 to 2034

Table 5: Global Market Value (US$ Million) Forecast by System, 2019 to 2034

Table 6: Global Market Volume (Units) Forecast by System, 2019 to 2034

Table 7: Global Market Value (US$ Million) Forecast by Platform, 2019 to 2034

Table 8: Global Market Volume (Units) Forecast by Platform, 2019 to 2034

Table 9: Global Market Value (US$ Million) Forecast by Range, 2019 to 2034

Table 10: Global Market Volume (Units) Forecast by Range, 2019 to 2034

Table 11: North America Market Value (US$ Million) Forecast by Country, 2019 to 2034

Table 12: North America Market Volume (Units) Forecast by Country, 2019 to 2034

Table 13: North America Market Value (US$ Million) Forecast by Capability, 2019 to 2034

Table 14: North America Market Volume (Units) Forecast by Capability, 2019 to 2034

Table 15: North America Market Value (US$ Million) Forecast by System, 2019 to 2034

Table 16: North America Market Volume (Units) Forecast by System, 2019 to 2034

Table 17: North America Market Value (US$ Million) Forecast by Platform, 2019 to 2034

Table 18: North America Market Volume (Units) Forecast by Platform, 2019 to 2034

Table 19: North America Market Value (US$ Million) Forecast by Range, 2019 to 2034

Table 20: North America Market Volume (Units) Forecast by Range, 2019 to 2034

Table 21: Latin America Market Value (US$ Million) Forecast by Country, 2019 to 2034

Table 22: Latin America Market Volume (Units) Forecast by Country, 2019 to 2034

Table 23: Latin America Market Value (US$ Million) Forecast by Capability, 2019 to 2034

Table 24: Latin America Market Volume (Units) Forecast by Capability, 2019 to 2034

Table 25: Latin America Market Value (US$ Million) Forecast by System, 2019 to 2034

Table 26: Latin America Market Volume (Units) Forecast by System, 2019 to 2034

Table 27: Latin America Market Value (US$ Million) Forecast by Platform, 2019 to 2034

Table 28: Latin America Market Volume (Units) Forecast by Platform, 2019 to 2034

Table 29: Latin America Market Value (US$ Million) Forecast by Range, 2019 to 2034

Table 30: Latin America Market Volume (Units) Forecast by Range, 2019 to 2034

Table 31: Western Europe Market Value (US$ Million) Forecast by Country, 2019 to 2034

Table 32: Western Europe Market Volume (Units) Forecast by Country, 2019 to 2034

Table 33: Western Europe Market Value (US$ Million) Forecast by Capability, 2019 to 2034

Table 34: Western Europe Market Volume (Units) Forecast by Capability, 2019 to 2034

Table 35: Western Europe Market Value (US$ Million) Forecast by System, 2019 to 2034

Table 36: Western Europe Market Volume (Units) Forecast by System, 2019 to 2034

Table 37: Western Europe Market Value (US$ Million) Forecast by Platform, 2019 to 2034

Table 38: Western Europe Market Volume (Units) Forecast by Platform, 2019 to 2034

Table 39: Western Europe Market Value (US$ Million) Forecast by Range, 2019 to 2034

Table 40: Western Europe Market Volume (Units) Forecast by Range, 2019 to 2034

Table 41: Eastern Europe Market Value (US$ Million) Forecast by Country, 2019 to 2034

Table 42: Eastern Europe Market Volume (Units) Forecast by Country, 2019 to 2034

Table 43: Eastern Europe Market Value (US$ Million) Forecast by Capability, 2019 to 2034

Table 44: Eastern Europe Market Volume (Units) Forecast by Capability, 2019 to 2034

Table 45: Eastern Europe Market Value (US$ Million) Forecast by System, 2019 to 2034

Table 46: Eastern Europe Market Volume (Units) Forecast by System, 2019 to 2034

Table 47: Eastern Europe Market Value (US$ Million) Forecast by Platform, 2019 to 2034

Table 48: Eastern Europe Market Volume (Units) Forecast by Platform, 2019 to 2034

Table 49: Eastern Europe Market Value (US$ Million) Forecast by Range, 2019 to 2034

Table 50: Eastern Europe Market Volume (Units) Forecast by Range, 2019 to 2034

Table 51: South Asia and Pacific Market Value (US$ Million) Forecast by Country, 2019 to 2034

Table 52: South Asia and Pacific Market Volume (Units) Forecast by Country, 2019 to 2034

Table 53: South Asia and Pacific Market Value (US$ Million) Forecast by Capability, 2019 to 2034

Table 54: South Asia and Pacific Market Volume (Units) Forecast by Capability, 2019 to 2034

Table 55: South Asia and Pacific Market Value (US$ Million) Forecast by System, 2019 to 2034

Table 56: South Asia and Pacific Market Volume (Units) Forecast by System, 2019 to 2034

Table 57: South Asia and Pacific Market Value (US$ Million) Forecast by Platform, 2019 to 2034

Table 58: South Asia and Pacific Market Volume (Units) Forecast by Platform, 2019 to 2034

Table 59: South Asia and Pacific Market Value (US$ Million) Forecast by Range, 2019 to 2034

Table 60: South Asia and Pacific Market Volume (Units) Forecast by Range, 2019 to 2034

Table 61: East Asia Market Value (US$ Million) Forecast by Country, 2019 to 2034

Table 62: East Asia Market Volume (Units) Forecast by Country, 2019 to 2034

Table 63: East Asia Market Value (US$ Million) Forecast by Capability, 2019 to 2034

Table 64: East Asia Market Volume (Units) Forecast by Capability, 2019 to 2034

Table 65: East Asia Market Value (US$ Million) Forecast by System, 2019 to 2034

Table 66: East Asia Market Volume (Units) Forecast by System, 2019 to 2034

Table 67: East Asia Market Value (US$ Million) Forecast by Platform, 2019 to 2034

Table 68: East Asia Market Volume (Units) Forecast by Platform, 2019 to 2034

Table 69: East Asia Market Value (US$ Million) Forecast by Range, 2019 to 2034

Table 70: East Asia Market Volume (Units) Forecast by Range, 2019 to 2034

Table 71: Middle East and Africa Market Value (US$ Million) Forecast by Country, 2019 to 2034

Table 72: Middle East and Africa Market Volume (Units) Forecast by Country, 2019 to 2034

Table 73: Middle East and Africa Market Value (US$ Million) Forecast by Capability, 2019 to 2034

Table 74: Middle East and Africa Market Volume (Units) Forecast by Capability, 2019 to 2034

Table 75: Middle East and Africa Market Value (US$ Million) Forecast by System, 2019 to 2034

Table 76: Middle East and Africa Market Volume (Units) Forecast by System, 2019 to 2034

Table 77: Middle East and Africa Market Value (US$ Million) Forecast by Platform, 2019 to 2034

Table 78: Middle East and Africa Market Volume (Units) Forecast by Platform, 2019 to 2034

Table 79: Middle East and Africa Market Value (US$ Million) Forecast by Range, 2019 to 2034

Table 80: Middle East and Africa Market Volume (Units) Forecast by Range, 2019 to 2034

List of Figures

Figure 1: Global Market Value (US$ Million) by Capability, 2024 to 2034

Figure 2: Global Market Value (US$ Million) by System, 2024 to 2034

Figure 3: Global Market Value (US$ Million) by Platform, 2024 to 2034

Figure 4: Global Market Value (US$ Million) by Range, 2024 to 2034

Figure 5: Global Market Value (US$ Million) by Region, 2024 to 2034

Figure 6: Global Market Value (US$ Million) Analysis by Region, 2019 to 2034

Figure 7: Global Market Volume (Units) Analysis by Region, 2019 to 2034

Figure 8: Global Market Value Share (%) and BPS Analysis by Region, 2024 to 2034

Figure 9: Global Market Y-o-Y Growth (%) Projections by Region, 2024 to 2034

Figure 10: Global Market Value (US$ Million) Analysis by Capability, 2019 to 2034

Figure 11: Global Market Volume (Units) Analysis by Capability, 2019 to 2034

Figure 12: Global Market Value Share (%) and BPS Analysis by Capability, 2024 to 2034

Figure 13: Global Market Y-o-Y Growth (%) Projections by Capability, 2024 to 2034

Figure 14: Global Market Value (US$ Million) Analysis by System, 2019 to 2034

Figure 15: Global Market Volume (Units) Analysis by System, 2019 to 2034

Figure 16: Global Market Value Share (%) and BPS Analysis by System, 2024 to 2034

Figure 17: Global Market Y-o-Y Growth (%) Projections by System, 2024 to 2034

Figure 18: Global Market Value (US$ Million) Analysis by Platform, 2019 to 2034

Figure 19: Global Market Volume (Units) Analysis by Platform, 2019 to 2034

Figure 20: Global Market Value Share (%) and BPS Analysis by Platform, 2024 to 2034

Figure 21: Global Market Y-o-Y Growth (%) Projections by Platform, 2024 to 2034

Figure 22: Global Market Value (US$ Million) Analysis by Range, 2019 to 2034

Figure 23: Global Market Volume (Units) Analysis by Range, 2019 to 2034

Figure 24: Global Market Value Share (%) and BPS Analysis by Range, 2024 to 2034

Figure 25: Global Market Y-o-Y Growth (%) Projections by Range, 2024 to 2034

Figure 26: Global Market Attractiveness by Capability, 2024 to 2034

Figure 27: Global Market Attractiveness by System, 2024 to 2034

Figure 28: Global Market Attractiveness by Platform, 2024 to 2034

Figure 29: Global Market Attractiveness by Range, 2024 to 2034

Figure 30: Global Market Attractiveness by Region, 2024 to 2034

Figure 31: North America Market Value (US$ Million) by Capability, 2024 to 2034

Figure 32: North America Market Value (US$ Million) by System, 2024 to 2034

Figure 33: North America Market Value (US$ Million) by Platform, 2024 to 2034

Figure 34: North America Market Value (US$ Million) by Range, 2024 to 2034

Figure 35: North America Market Value (US$ Million) by Country, 2024 to 2034

Figure 36: North America Market Value (US$ Million) Analysis by Country, 2019 to 2034

Figure 37: North America Market Volume (Units) Analysis by Country, 2019 to 2034

Figure 38: North America Market Value Share (%) and BPS Analysis by Country, 2024 to 2034

Figure 39: North America Market Y-o-Y Growth (%) Projections by Country, 2024 to 2034

Figure 40: North America Market Value (US$ Million) Analysis by Capability, 2019 to 2034

Figure 41: North America Market Volume (Units) Analysis by Capability, 2019 to 2034

Figure 42: North America Market Value Share (%) and BPS Analysis by Capability, 2024 to 2034

Figure 43: North America Market Y-o-Y Growth (%) Projections by Capability, 2024 to 2034

Figure 44: North America Market Value (US$ Million) Analysis by System, 2019 to 2034

Figure 45: North America Market Volume (Units) Analysis by System, 2019 to 2034

Figure 46: North America Market Value Share (%) and BPS Analysis by System, 2024 to 2034

Figure 47: North America Market Y-o-Y Growth (%) Projections by System, 2024 to 2034

Figure 48: North America Market Value (US$ Million) Analysis by Platform, 2019 to 2034

Figure 49: North America Market Volume (Units) Analysis by Platform, 2019 to 2034

Figure 50: North America Market Value Share (%) and BPS Analysis by Platform, 2024 to 2034

Figure 51: North America Market Y-o-Y Growth (%) Projections by Platform, 2024 to 2034

Figure 52: North America Market Value (US$ Million) Analysis by Range, 2019 to 2034

Figure 53: North America Market Volume (Units) Analysis by Range, 2019 to 2034

Figure 54: North America Market Value Share (%) and BPS Analysis by Range, 2024 to 2034

Figure 55: North America Market Y-o-Y Growth (%) Projections by Range, 2024 to 2034

Figure 56: North America Market Attractiveness by Capability, 2024 to 2034

Figure 57: North America Market Attractiveness by System, 2024 to 2034

Figure 58: North America Market Attractiveness by Platform, 2024 to 2034

Figure 59: North America Market Attractiveness by Range, 2024 to 2034

Figure 60: North America Market Attractiveness by Country, 2024 to 2034

Figure 61: Latin America Market Value (US$ Million) by Capability, 2024 to 2034

Figure 62: Latin America Market Value (US$ Million) by System, 2024 to 2034

Figure 63: Latin America Market Value (US$ Million) by Platform, 2024 to 2034

Figure 64: Latin America Market Value (US$ Million) by Range, 2024 to 2034

Figure 65: Latin America Market Value (US$ Million) by Country, 2024 to 2034

Figure 66: Latin America Market Value (US$ Million) Analysis by Country, 2019 to 2034

Figure 67: Latin America Market Volume (Units) Analysis by Country, 2019 to 2034

Figure 68: Latin America Market Value Share (%) and BPS Analysis by Country, 2024 to 2034

Figure 69: Latin America Market Y-o-Y Growth (%) Projections by Country, 2024 to 2034

Figure 70: Latin America Market Value (US$ Million) Analysis by Capability, 2019 to 2034

Figure 71: Latin America Market Volume (Units) Analysis by Capability, 2019 to 2034

Figure 72: Latin America Market Value Share (%) and BPS Analysis by Capability, 2024 to 2034

Figure 73: Latin America Market Y-o-Y Growth (%) Projections by Capability, 2024 to 2034

Figure 74: Latin America Market Value (US$ Million) Analysis by System, 2019 to 2034

Figure 75: Latin America Market Volume (Units) Analysis by System, 2019 to 2034

Figure 76: Latin America Market Value Share (%) and BPS Analysis by System, 2024 to 2034

Figure 77: Latin America Market Y-o-Y Growth (%) Projections by System, 2024 to 2034

Figure 78: Latin America Market Value (US$ Million) Analysis by Platform, 2019 to 2034

Figure 79: Latin America Market Volume (Units) Analysis by Platform, 2019 to 2034

Figure 80: Latin America Market Value Share (%) and BPS Analysis by Platform, 2024 to 2034

Figure 81: Latin America Market Y-o-Y Growth (%) Projections by Platform, 2024 to 2034

Figure 82: Latin America Market Value (US$ Million) Analysis by Range, 2019 to 2034

Figure 83: Latin America Market Volume (Units) Analysis by Range, 2019 to 2034

Figure 84: Latin America Market Value Share (%) and BPS Analysis by Range, 2024 to 2034

Figure 85: Latin America Market Y-o-Y Growth (%) Projections by Range, 2024 to 2034

Figure 86: Latin America Market Attractiveness by Capability, 2024 to 2034

Figure 87: Latin America Market Attractiveness by System, 2024 to 2034

Figure 88: Latin America Market Attractiveness by Platform, 2024 to 2034

Figure 89: Latin America Market Attractiveness by Range, 2024 to 2034

Figure 90: Latin America Market Attractiveness by Country, 2024 to 2034

Figure 91: Western Europe Market Value (US$ Million) by Capability, 2024 to 2034

Figure 92: Western Europe Market Value (US$ Million) by System, 2024 to 2034

Figure 93: Western Europe Market Value (US$ Million) by Platform, 2024 to 2034

Figure 94: Western Europe Market Value (US$ Million) by Range, 2024 to 2034

Figure 95: Western Europe Market Value (US$ Million) by Country, 2024 to 2034

Figure 96: Western Europe Market Value (US$ Million) Analysis by Country, 2019 to 2034

Figure 97: Western Europe Market Volume (Units) Analysis by Country, 2019 to 2034

Figure 98: Western Europe Market Value Share (%) and BPS Analysis by Country, 2024 to 2034

Figure 99: Western Europe Market Y-o-Y Growth (%) Projections by Country, 2024 to 2034

Figure 100: Western Europe Market Value (US$ Million) Analysis by Capability, 2019 to 2034

Figure 101: Western Europe Market Volume (Units) Analysis by Capability, 2019 to 2034

Figure 102: Western Europe Market Value Share (%) and BPS Analysis by Capability, 2024 to 2034

Figure 103: Western Europe Market Y-o-Y Growth (%) Projections by Capability, 2024 to 2034

Figure 104: Western Europe Market Value (US$ Million) Analysis by System, 2019 to 2034

Figure 105: Western Europe Market Volume (Units) Analysis by System, 2019 to 2034

Figure 106: Western Europe Market Value Share (%) and BPS Analysis by System, 2024 to 2034

Figure 107: Western Europe Market Y-o-Y Growth (%) Projections by System, 2024 to 2034

Figure 108: Western Europe Market Value (US$ Million) Analysis by Platform, 2019 to 2034

Figure 109: Western Europe Market Volume (Units) Analysis by Platform, 2019 to 2034

Figure 110: Western Europe Market Value Share (%) and BPS Analysis by Platform, 2024 to 2034

Figure 111: Western Europe Market Y-o-Y Growth (%) Projections by Platform, 2024 to 2034

Figure 112: Western Europe Market Value (US$ Million) Analysis by Range, 2019 to 2034

Figure 113: Western Europe Market Volume (Units) Analysis by Range, 2019 to 2034

Figure 114: Western Europe Market Value Share (%) and BPS Analysis by Range, 2024 to 2034

Figure 115: Western Europe Market Y-o-Y Growth (%) Projections by Range, 2024 to 2034

Figure 116: Western Europe Market Attractiveness by Capability, 2024 to 2034

Figure 117: Western Europe Market Attractiveness by System, 2024 to 2034

Figure 118: Western Europe Market Attractiveness by Platform, 2024 to 2034

Figure 119: Western Europe Market Attractiveness by Range, 2024 to 2034

Figure 120: Western Europe Market Attractiveness by Country, 2024 to 2034

Figure 121: Eastern Europe Market Value (US$ Million) by Capability, 2024 to 2034

Figure 122: Eastern Europe Market Value (US$ Million) by System, 2024 to 2034

Figure 123: Eastern Europe Market Value (US$ Million) by Platform, 2024 to 2034

Figure 124: Eastern Europe Market Value (US$ Million) by Range, 2024 to 2034

Figure 125: Eastern Europe Market Value (US$ Million) by Country, 2024 to 2034

Figure 126: Eastern Europe Market Value (US$ Million) Analysis by Country, 2019 to 2034

Figure 127: Eastern Europe Market Volume (Units) Analysis by Country, 2019 to 2034

Figure 128: Eastern Europe Market Value Share (%) and BPS Analysis by Country, 2024 to 2034

Figure 129: Eastern Europe Market Y-o-Y Growth (%) Projections by Country, 2024 to 2034

Figure 130: Eastern Europe Market Value (US$ Million) Analysis by Capability, 2019 to 2034

Figure 131: Eastern Europe Market Volume (Units) Analysis by Capability, 2019 to 2034

Figure 132: Eastern Europe Market Value Share (%) and BPS Analysis by Capability, 2024 to 2034

Figure 133: Eastern Europe Market Y-o-Y Growth (%) Projections by Capability, 2024 to 2034

Figure 134: Eastern Europe Market Value (US$ Million) Analysis by System, 2019 to 2034

Figure 135: Eastern Europe Market Volume (Units) Analysis by System, 2019 to 2034

Figure 136: Eastern Europe Market Value Share (%) and BPS Analysis by System, 2024 to 2034

Figure 137: Eastern Europe Market Y-o-Y Growth (%) Projections by System, 2024 to 2034

Figure 138: Eastern Europe Market Value (US$ Million) Analysis by Platform, 2019 to 2034

Figure 139: Eastern Europe Market Volume (Units) Analysis by Platform, 2019 to 2034

Figure 140: Eastern Europe Market Value Share (%) and BPS Analysis by Platform, 2024 to 2034

Figure 141: Eastern Europe Market Y-o-Y Growth (%) Projections by Platform, 2024 to 2034

Figure 142: Eastern Europe Market Value (US$ Million) Analysis by Range, 2019 to 2034

Figure 143: Eastern Europe Market Volume (Units) Analysis by Range, 2019 to 2034

Figure 144: Eastern Europe Market Value Share (%) and BPS Analysis by Range, 2024 to 2034

Figure 145: Eastern Europe Market Y-o-Y Growth (%) Projections by Range, 2024 to 2034

Figure 146: Eastern Europe Market Attractiveness by Capability, 2024 to 2034

Figure 147: Eastern Europe Market Attractiveness by System, 2024 to 2034

Figure 148: Eastern Europe Market Attractiveness by Platform, 2024 to 2034

Figure 149: Eastern Europe Market Attractiveness by Range, 2024 to 2034

Figure 150: Eastern Europe Market Attractiveness by Country, 2024 to 2034

Figure 151: South Asia and Pacific Market Value (US$ Million) by Capability, 2024 to 2034

Figure 152: South Asia and Pacific Market Value (US$ Million) by System, 2024 to 2034

Figure 153: South Asia and Pacific Market Value (US$ Million) by Platform, 2024 to 2034

Figure 154: South Asia and Pacific Market Value (US$ Million) by Range, 2024 to 2034

Figure 155: South Asia and Pacific Market Value (US$ Million) by Country, 2024 to 2034

Figure 156: South Asia and Pacific Market Value (US$ Million) Analysis by Country, 2019 to 2034

Figure 157: South Asia and Pacific Market Volume (Units) Analysis by Country, 2019 to 2034

Figure 158: South Asia and Pacific Market Value Share (%) and BPS Analysis by Country, 2024 to 2034

Figure 159: South Asia and Pacific Market Y-o-Y Growth (%) Projections by Country, 2024 to 2034

Figure 160: South Asia and Pacific Market Value (US$ Million) Analysis by Capability, 2019 to 2034

Figure 161: South Asia and Pacific Market Volume (Units) Analysis by Capability, 2019 to 2034

Figure 162: South Asia and Pacific Market Value Share (%) and BPS Analysis by Capability, 2024 to 2034

Figure 163: South Asia and Pacific Market Y-o-Y Growth (%) Projections by Capability, 2024 to 2034

Figure 164: South Asia and Pacific Market Value (US$ Million) Analysis by System, 2019 to 2034

Figure 165: South Asia and Pacific Market Volume (Units) Analysis by System, 2019 to 2034

Figure 166: South Asia and Pacific Market Value Share (%) and BPS Analysis by System, 2024 to 2034

Figure 167: South Asia and Pacific Market Y-o-Y Growth (%) Projections by System, 2024 to 2034

Figure 168: South Asia and Pacific Market Value (US$ Million) Analysis by Platform, 2019 to 2034

Figure 169: South Asia and Pacific Market Volume (Units) Analysis by Platform, 2019 to 2034

Figure 170: South Asia and Pacific Market Value Share (%) and BPS Analysis by Platform, 2024 to 2034

Figure 171: South Asia and Pacific Market Y-o-Y Growth (%) Projections by Platform, 2024 to 2034

Figure 172: South Asia and Pacific Market Value (US$ Million) Analysis by Range, 2019 to 2034

Figure 173: South Asia and Pacific Market Volume (Units) Analysis by Range, 2019 to 2034

Figure 174: South Asia and Pacific Market Value Share (%) and BPS Analysis by Range, 2024 to 2034

Figure 175: South Asia and Pacific Market Y-o-Y Growth (%) Projections by Range, 2024 to 2034

Figure 176: South Asia and Pacific Market Attractiveness by Capability, 2024 to 2034

Figure 177: South Asia and Pacific Market Attractiveness by System, 2024 to 2034

Figure 178: South Asia and Pacific Market Attractiveness by Platform, 2024 to 2034

Figure 179: South Asia and Pacific Market Attractiveness by Range, 2024 to 2034

Figure 180: South Asia and Pacific Market Attractiveness by Country, 2024 to 2034

Figure 181: East Asia Market Value (US$ Million) by Capability, 2024 to 2034

Figure 182: East Asia Market Value (US$ Million) by System, 2024 to 2034

Figure 183: East Asia Market Value (US$ Million) by Platform, 2024 to 2034

Figure 184: East Asia Market Value (US$ Million) by Range, 2024 to 2034

Figure 185: East Asia Market Value (US$ Million) by Country, 2024 to 2034

Figure 186: East Asia Market Value (US$ Million) Analysis by Country, 2019 to 2034

Figure 187: East Asia Market Volume (Units) Analysis by Country, 2019 to 2034

Figure 188: East Asia Market Value Share (%) and BPS Analysis by Country, 2024 to 2034

Figure 189: East Asia Market Y-o-Y Growth (%) Projections by Country, 2024 to 2034

Figure 190: East Asia Market Value (US$ Million) Analysis by Capability, 2019 to 2034

Figure 191: East Asia Market Volume (Units) Analysis by Capability, 2019 to 2034

Figure 192: East Asia Market Value Share (%) and BPS Analysis by Capability, 2024 to 2034

Figure 193: East Asia Market Y-o-Y Growth (%) Projections by Capability, 2024 to 2034

Figure 194: East Asia Market Value (US$ Million) Analysis by System, 2019 to 2034

Figure 195: East Asia Market Volume (Units) Analysis by System, 2019 to 2034

Figure 196: East Asia Market Value Share (%) and BPS Analysis by System, 2024 to 2034

Figure 197: East Asia Market Y-o-Y Growth (%) Projections by System, 2024 to 2034

Figure 198: East Asia Market Value (US$ Million) Analysis by Platform, 2019 to 2034

Figure 199: East Asia Market Volume (Units) Analysis by Platform, 2019 to 2034

Figure 200: East Asia Market Value Share (%) and BPS Analysis by Platform, 2024 to 2034

Figure 201: East Asia Market Y-o-Y Growth (%) Projections by Platform, 2024 to 2034

Figure 202: East Asia Market Value (US$ Million) Analysis by Range, 2019 to 2034

Figure 203: East Asia Market Volume (Units) Analysis by Range, 2019 to 2034

Figure 204: East Asia Market Value Share (%) and BPS Analysis by Range, 2024 to 2034

Figure 205: East Asia Market Y-o-Y Growth (%) Projections by Range, 2024 to 2034

Figure 206: East Asia Market Attractiveness by Capability, 2024 to 2034

Figure 207: East Asia Market Attractiveness by System, 2024 to 2034

Figure 208: East Asia Market Attractiveness by Platform, 2024 to 2034

Figure 209: East Asia Market Attractiveness by Range, 2024 to 2034

Figure 210: East Asia Market Attractiveness by Country, 2024 to 2034

Figure 211: Middle East and Africa Market Value (US$ Million) by Capability, 2024 to 2034

Figure 212: Middle East and Africa Market Value (US$ Million) by System, 2024 to 2034

Figure 213: Middle East and Africa Market Value (US$ Million) by Platform, 2024 to 2034

Figure 214: Middle East and Africa Market Value (US$ Million) by Range, 2024 to 2034

Figure 215: Middle East and Africa Market Value (US$ Million) by Country, 2024 to 2034

Figure 216: Middle East and Africa Market Value (US$ Million) Analysis by Country, 2019 to 2034

Figure 217: Middle East and Africa Market Volume (Units) Analysis by Country, 2019 to 2034

Figure 218: Middle East and Africa Market Value Share (%) and BPS Analysis by Country, 2024 to 2034

Figure 219: Middle East and Africa Market Y-o-Y Growth (%) Projections by Country, 2024 to 2034

Figure 220: Middle East and Africa Market Value (US$ Million) Analysis by Capability, 2019 to 2034

Figure 221: Middle East and Africa Market Volume (Units) Analysis by Capability, 2019 to 2034

Figure 222: Middle East and Africa Market Value Share (%) and BPS Analysis by Capability, 2024 to 2034

Figure 223: Middle East and Africa Market Y-o-Y Growth (%) Projections by Capability, 2024 to 2034

Figure 224: Middle East and Africa Market Value (US$ Million) Analysis by System, 2019 to 2034

Figure 225: Middle East and Africa Market Volume (Units) Analysis by System, 2019 to 2034

Figure 226: Middle East and Africa Market Value Share (%) and BPS Analysis by System, 2024 to 2034

Figure 227: Middle East and Africa Market Y-o-Y Growth (%) Projections by System, 2024 to 2034

Figure 228: Middle East and Africa Market Value (US$ Million) Analysis by Platform, 2019 to 2034

Figure 229: Middle East and Africa Market Volume (Units) Analysis by Platform, 2019 to 2034

Figure 230: Middle East and Africa Market Value Share (%) and BPS Analysis by Platform, 2024 to 2034

Figure 231: Middle East and Africa Market Y-o-Y Growth (%) Projections by Platform, 2024 to 2034

Figure 232: Middle East and Africa Market Value (US$ Million) Analysis by Range, 2019 to 2034

Figure 233: Middle East and Africa Market Volume (Units) Analysis by Range, 2019 to 2034

Figure 234: Middle East and Africa Market Value Share (%) and BPS Analysis by Range, 2024 to 2034

Figure 235: Middle East and Africa Market Y-o-Y Growth (%) Projections by Range, 2024 to 2034

Figure 236: Middle East and Africa Market Attractiveness by Capability, 2024 to 2034

Figure 237: Middle East and Africa Market Attractiveness by System, 2024 to 2034

Figure 238: Middle East and Africa Market Attractiveness by Platform, 2024 to 2034

Figure 239: Middle East and Africa Market Attractiveness by Range, 2024 to 2034

Figure 240: Middle East and Africa Market Attractiveness by Country, 2024 to 2034

Frequently Asked Questions

How Big is the Anti-aircraft Warfare Market?

The anti-aircraft warfare market is expected to be valued at USD 22.7 billion in 2024.

How was the Demand for Anti-aircraft Warfare from 2019 to 2023?

The anti-aircraft warfare displayed a CAGR of 9.1% from 2019 to 2023.

Which Country is Leading the Anti-aircraft Warfare Market?

Japan is dominating the market, with a growth rate of 9% from 2024 to 2034.

What is the Anti-aircraft Warfare Market Growth Outlook for 2034?

The anti-aircraft warfare market is anticipated to surpass USD 46.1 billion by 2034.

What is the Sales Outlook for Anti-aircraft Warfare from 2024 to 2034?

The anti-aircraft warfare industry is anticipated to grow at a rate of 7.4% from 2024 to 2034.

Explore Similar Insights

Future Market Insights

Anti-aircraft Warfare Market