Beta-Glucanase Market Size and Share Forecast Outlook 2025 to 2035

The Beta-Glucanase Market is estimated to be valued at USD 465.7 million in 2025 and is projected to reach USD 857.9 million by 2035, registering a compound annual growth rate (CAGR) of 6.3% over the forecast period.
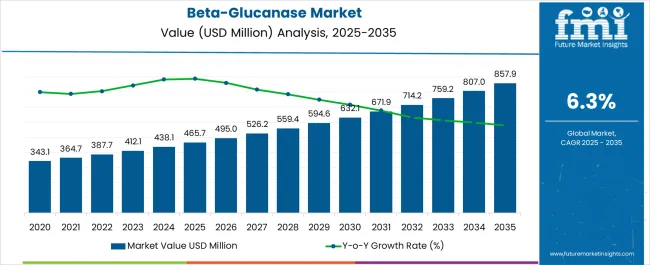
Quick Stats for Beta-Glucanase Market

  • Beta-Glucanase Market Value (2025): USD 465.7 million
  • Beta-Glucanase Market Forecast Value (2035): USD 857.9 million
  • Beta-Glucanase Market Forecast CAGR: 6.3%
  • Leading Segment in Beta-Glucanase Market in 2025: Yeast (47.3%)
  • Key Growth Regions in Beta-Glucanase Market: North America, Asia-Pacific, Europe
  • Top Key Players in Beta-Glucanase Market: Cargill Inc (USA), Kerry Group Plc (Ireland), AIT Ingredients (France), Ohly GmbH (Germany), Biorigin Zilor (Brazil), Alltech Life Sciences (USA), Tate & Lyle Plc (UK), Koninklijke DSM N.V. (Netherlands), Garuda International Inc (USA), Angel Yeast Co Ltd (China), Biotec BetaGlucans AS (Norway), Ceapro Inc (Canada)

Beta Glucanase Market Market Value Analysis

Beta-Glucanase Market Key Takeaways

Metric Value
Beta-Glucanase Market Estimated Value in (2025 E) USD 465.7 million
Beta-Glucanase Market Forecast Value in (2035 F) USD 857.9 million
Forecast CAGR (2025 to 2035) 6.3%

Why is the Beta-Glucanase Market Growing?

The beta-glucanase market is demonstrating steady growth, supported by the rising demand for functional ingredients in food, beverage, feed, and nutraceutical industries. Increasing awareness of digestive health and immunity-boosting products is driving the integration of beta-glucanase into dietary supplements and wellness products. The enzyme’s ability to break down complex beta-glucans into simpler, bioavailable components is being leveraged to improve nutrient absorption and functional efficacy across a wide range of applications.

Growing investments in enzyme biotechnology, along with advancements in fermentation processes, are enhancing product efficiency, stability, and cost-effectiveness. The market is also benefiting from the expansion of clean-label and natural product categories, where beta-glucanase is being increasingly adopted as a natural processing aid.

Regulatory support for safe and effective enzyme-based ingredients in human and animal nutrition is further accelerating adoption As consumer preferences shift toward health-oriented food products and sustainable feed solutions, the market is anticipated to expand significantly, supported by innovation in enzyme formulations and broader acceptance of enzyme-based functional solutions across global markets.

Segmental Analysis

The beta-glucanase market is segmented by source, functionality, application, and geographic regions. By source, beta-glucanase market is divided into Yeast, Cereal (Barley, Oats), and Others (Mushrooms). In terms of functionality, beta-glucanase market is classified into Soluble Beta-Glucanase and Insoluble Beta-Glucanase. Based on application, beta-glucanase market is segmented into Health & Dietary Supplements, Bakery Products, Foods & Beverages, Cosmetics & Personal Care, Dairy & Frozen Products, and Others (Animal Feed). Regionally, the beta-glucanase industry is classified into North America, Latin America, Western Europe, Eastern Europe, Balkan & Baltic Countries, Russia & Belarus, Central Asia, East Asia, South Asia & Pacific, and the Middle East & Africa.
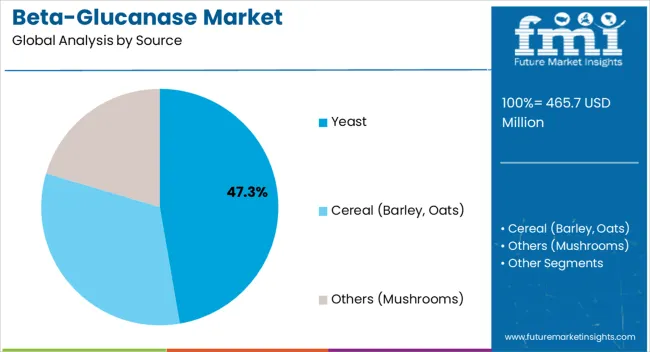
Insights into the Yeast Source Segment

Beta Glucanase Market Analysis By Source

The yeast source segment is projected to account for 47.3% of the beta-glucanase market revenue share in 2025, making it the leading source category. This dominance is being attributed to the abundance of yeast-derived beta-glucans in various applications and the cost-effective production methods associated with yeast fermentation. The enzymatic extraction from yeast provides high yield and consistency, which supports large-scale commercial use in both food and feed industries.

The stability and effectiveness of yeast-derived beta-glucanase have been demonstrated across a wide range of processing environments, making it suitable for industrial applications that require reliable enzyme activity under varying conditions. The demand for yeast-based solutions is also being reinforced by their acceptance in natural and clean-label formulations, aligning with growing consumer interest in sustainable and traceable sources.

Advances in fermentation technologies and strain development are enabling higher enzyme purity and activity, ensuring consistent performance across applications As industries prioritize efficiency and sustainability, yeast remains the most practical and scalable source of beta-glucanase, solidifying its leadership position in the global market.
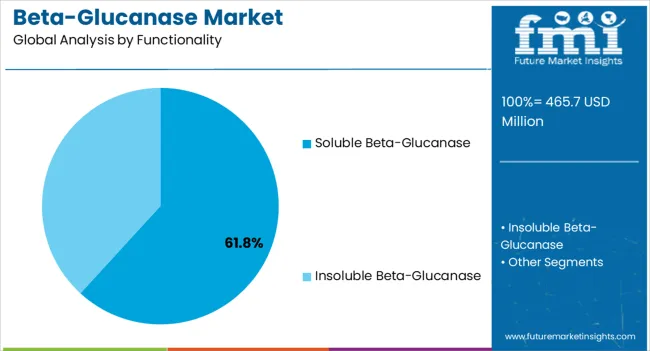
Insights into the Soluble Beta-Glucanase Functionality Segment

Beta Glucanase Market Analysis By Functionality

The soluble beta-glucanase functionality segment is expected to hold 61.8% of the beta-glucanase market revenue share in 2025, establishing it as the leading functionality type. Its growth is being driven by the superior solubility and ease of incorporation into liquid and powdered formulations, making it highly suitable for nutraceuticals, beverages, and functional foods. Soluble beta-glucanase enhances bioavailability and efficacy, supporting its adoption in products targeted toward improving digestion and immune function.

The ability of soluble forms to retain stability across a range of processing conditions is further increasing their application potential in health and dietary supplements. Manufacturers are prioritizing soluble formulations due to their ability to blend seamlessly with other ingredients without compromising texture or taste, which is critical in consumer-facing products.

The segment’s expansion is also linked to ongoing research in biotechnology aimed at optimizing solubility and enzymatic activity With the growing trend toward functional and fortified food solutions, soluble beta-glucanase is expected to remain the preferred choice for manufacturers, ensuring its strong contribution to overall market growth.
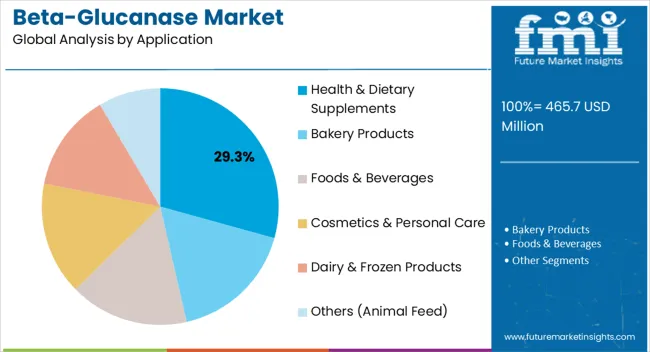
Insights into the Health and Dietary Supplements Application Segment

Beta Glucanase Market Analysis By Application

The health and dietary supplements application segment is anticipated to capture 29.3% of the beta-glucanase market revenue share in 2025, making it the dominant application. The leadership of this segment is being fueled by the increasing consumer focus on digestive wellness, immunity enhancement, and preventive healthcare. Beta-glucanase is being incorporated into dietary supplements to improve the breakdown of beta-glucans, thereby enhancing nutrient absorption and overall effectiveness of formulations.

Its role in supporting gut health and immunity is particularly relevant as consumers prioritize natural solutions to strengthen resilience against lifestyle-related disorders and infections. The expanding nutraceutical sector, combined with rising disposable incomes and health-conscious lifestyles, is reinforcing demand for enzyme-based supplements. Regulatory acceptance of beta-glucanase as a safe and beneficial dietary ingredient is further driving adoption in supplement formulations.

The ability to combine beta-glucanase with other functional ingredients in capsules, powders, and liquid supplements is increasing product diversity and accessibility As the global demand for wellness products accelerates, the health and dietary supplements segment is expected to remain the largest contributor to market revenues.

Market Overview

Beta-Glucanase Market Outlook (2025 to 2035)

A novel substance called beta-glucanase is currently being introduced to the market. It is a nutritional supplement produced from yeast cell walls. According to some research, beta-glucanase is good for the heart and can lower the chance of developing heart disease. Clinical testing of the product has shown that it effectively lowers levels of harmful cholesterol.
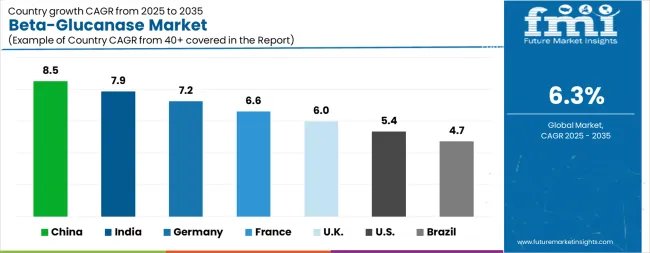
Analysis of Beta-Glucanase Market By Key Countries

Beta Glucanase Market Cagr Analysis By Country
Country CAGR
China 8.5%
India 7.9%
Germany 7.2%
France 6.6%
UK 6.0%
USA 5.4%
Brazil 4.7%

Country-wise Analysis

The Beta-Glucanase Market is expected to register a CAGR of 6.3% during the forecast period, exhibiting varied country level momentum. China leads with the highest CAGR of 8.5%, followed by India at 7.9%. Developed markets such as Germany, France, and the UK continue to expand steadily, while the USA is likely to grow at consistent rates. Brazil posts the lowest CAGR at 4.7%, yet still underscores a broadly positive trajectory for the global Beta-Glucanase Market. In 2024, Germany held a dominant revenue in the Western Europe market and is expected to grow with a CAGR of 7.2%. The USA Beta-Glucanase Market is estimated to be valued at USD 174.1 million in 2025 and is anticipated to reach a valuation of USD 293.3 million by 2035. Sales are projected to rise at a CAGR of 5.4% over the forecast period between 2025 and 2035. While Japan and South Korea markets are estimated to be valued at USD 22.5 million and USD 16.2 million respectively in 2025.
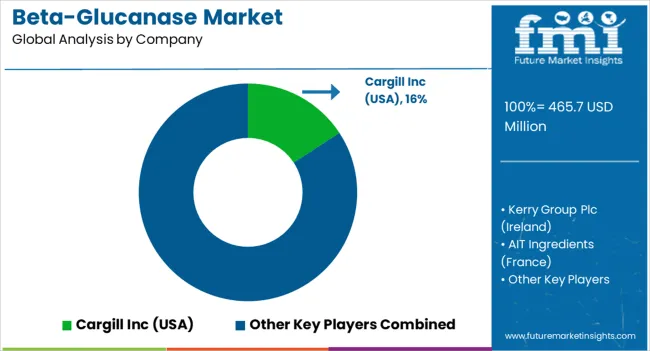
Key Players in the Beta-Glucanase Market

Beta Glucanase Market Analysis By Company

  • Cargill Inc (USA)
  • Kerry Group Plc (Ireland)
  • AIT Ingredients (France)
  • Ohly GmbH (Germany)
  • Biorigin Zilor (Brazil)
  • Alltech Life Sciences (USA)
  • Tate & Lyle Plc (UK)
  • Koninklijke DSM N.V. (Netherlands)
  • Garuda International Inc (USA)
  • Angel Yeast Co Ltd (China)
  • Biotec BetaGlucans AS (Norway)
  • Ceapro Inc (Canada)

Scope of the Report

Item Value
Quantitative Units USD 465.7 Million
Source Yeast, Cereal (Barley, Oats), and Others (Mushrooms)
Functionality Soluble Beta-Glucanase and Insoluble Beta-Glucanase
Application Health & Dietary Supplements, Bakery Products, Foods & Beverages, Cosmetics & Personal Care, Dairy & Frozen Products, and Others (Animal Feed)
Regions Covered North America, Europe, Asia-Pacific, Latin America, Middle East & Africa
Country Covered United States, Canada, Germany, France, United Kingdom, China, Japan, India, Brazil, South Africa
Key Companies Profiled Cargill Inc (USA), Kerry Group Plc (Ireland), AIT Ingredients (France), Ohly GmbH (Germany), Biorigin Zilor (Brazil), Alltech Life Sciences (USA), Tate & Lyle Plc (UK), Koninklijke DSM N.V. (Netherlands), Garuda International Inc (USA), Angel Yeast Co Ltd (China), Biotec BetaGlucans AS (Norway), and Ceapro Inc (Canada)

Beta-Glucanase Market by Segments

Source:

  • Yeast
  • Cereal (Barley, Oats)
  • Others (Mushrooms)

Functionality:

  • Soluble Beta-Glucanase
  • Insoluble Beta-Glucanase

Application:

  • Health & Dietary Supplements
  • Bakery Products
  • Foods & Beverages
  • Cosmetics & Personal Care
  • Dairy & Frozen Products
  • Others (Animal Feed)

Region:

  • North America
    • USA
    • Canada
    • Mexico
  • Latin America
    • Brazil
    • Chile
    • Rest of Latin America
  • Western Europe
    • Germany
    • UK
    • Italy
    • Spain
    • France
    • Nordic
    • BENELUX
    • Rest of Western Europe
  • Eastern Europe
    • Russia
    • Poland
    • Hungary
    • Balkan & Baltic
    • Rest of Eastern Europe
  • East Asia
    • China
    • Japan
    • South Korea
  • South Asia and Pacific
    • India
    • ASEAN
    • Australia & New Zealand
    • Rest of South Asia and Pacific
  • Middle East & Africa
    • Kingdom of Saudi Arabia
    • Other GCC Countries
    • Turkiye
    • South Africa
    • Other African Union
    • Rest of Middle East & Africa

Frequently Asked Questions

How big is the beta-glucanase market in 2025?

The global beta-glucanase market is estimated to be valued at USD 465.7 million in 2025.

What will be the size of beta-glucanase market in 2035?

The market size for the beta-glucanase market is projected to reach USD 857.9 million by 2035.

How much will be the beta-glucanase market growth between 2025 and 2035?

The beta-glucanase market is expected to grow at a 6.3% CAGR between 2025 and 2035.

What are the key product types in the beta-glucanase market?

The key product types in beta-glucanase market are yeast, cereal (barley, oats) and others (mushrooms).

Which functionality segment to contribute significant share in the beta-glucanase market in 2025?

In terms of functionality, soluble beta-glucanase segment to command 61.8% share in the beta-glucanase market in 2025.

Table of Content

  1. Executive Summary
    • Global Market Outlook
    • Demand-side Trends
    • Supply-side Trends
    • Technology Roadmap Analysis
    • Analysis and Recommendations
  2. Market Overview
    • Market Coverage / Taxonomy
    • Market Definition / Scope / Limitations
  3. Market Background
    • Market Dynamics
      • Drivers
      • Restraints
      • Opportunity
      • Trends
    • Scenario Forecast
      • Demand in Optimistic Scenario
      • Demand in Likely Scenario
      • Demand in Conservative Scenario
    • Opportunity Map Analysis
    • Product Life Cycle Analysis
    • Supply Chain Analysis
    • Investment Feasibility Matrix
    • Value Chain Analysis
    • PESTLE and Porter’s Analysis
    • Regulatory Landscape
    • Regional Parent Market Outlook
    • Production and Consumption Statistics
    • Import and Export Statistics
  4. Global Market Analysis 2020 to 2024 and Forecast, 2025 to 2035
    • Historical Market Size Value (USD Million) Analysis, 2020 to 2024
    • Current and Future Market Size Value (USD Million) Projections, 2025 to 2035
      • Y-o-Y Growth Trend Analysis
      • Absolute $ Opportunity Analysis
  5. Global Market Pricing Analysis 2020 to 2024 and Forecast 2025 to 2035
  6. Global Market Analysis 2020 to 2024 and Forecast 2025 to 2035, By Source
    • Introduction / Key Findings
    • Historical Market Size Value (USD Million) Analysis By Source , 2020 to 2024
    • Current and Future Market Size Value (USD Million) Analysis and Forecast By Source , 2025 to 2035
      • Yeast
      • Cereal (Barley, Oats)
      • Others (Mushrooms)
    • Y-o-Y Growth Trend Analysis By Source , 2020 to 2024
    • Absolute $ Opportunity Analysis By Source , 2025 to 2035
  7. Global Market Analysis 2020 to 2024 and Forecast 2025 to 2035, By Functionality
    • Introduction / Key Findings
    • Historical Market Size Value (USD Million) Analysis By Functionality, 2020 to 2024
    • Current and Future Market Size Value (USD Million) Analysis and Forecast By Functionality, 2025 to 2035
      • Soluble Beta-Glucanase
      • Insoluble Beta-Glucanase
    • Y-o-Y Growth Trend Analysis By Functionality, 2020 to 2024
    • Absolute $ Opportunity Analysis By Functionality, 2025 to 2035
  8. Global Market Analysis 2020 to 2024 and Forecast 2025 to 2035, By Application
    • Introduction / Key Findings
    • Historical Market Size Value (USD Million) Analysis By Application, 2020 to 2024
    • Current and Future Market Size Value (USD Million) Analysis and Forecast By Application, 2025 to 2035
      • Health & Dietary Supplements
      • Bakery Products
      • Foods & Beverages
      • Cosmetics & Personal Care
      • Dairy & Frozen Products
      • Others (Animal Feed)
    • Y-o-Y Growth Trend Analysis By Application, 2020 to 2024
    • Absolute $ Opportunity Analysis By Application, 2025 to 2035
  9. Global Market Analysis 2020 to 2024 and Forecast 2025 to 2035, By Region
    • Introduction
    • Historical Market Size Value (USD Million) Analysis By Region, 2020 to 2024
    • Current Market Size Value (USD Million) Analysis and Forecast By Region, 2025 to 2035
      • North America
      • Latin America
      • Western Europe
      • Eastern Europe
      • East Asia
      • South Asia and Pacific
      • Middle East & Africa
    • Market Attractiveness Analysis By Region
  10. North America Market Analysis 2020 to 2024 and Forecast 2025 to 2035, By Country
    • Historical Market Size Value (USD Million) Trend Analysis By Market Taxonomy, 2020 to 2024
    • Market Size Value (USD Million) Forecast By Market Taxonomy, 2025 to 2035
      • By Country
        • USA
        • Canada
        • Mexico
      • By Source
      • By Functionality
      • By Application
    • Market Attractiveness Analysis
      • By Country
      • By Source
      • By Functionality
      • By Application
    • Key Takeaways
  11. Latin America Market Analysis 2020 to 2024 and Forecast 2025 to 2035, By Country
    • Historical Market Size Value (USD Million) Trend Analysis By Market Taxonomy, 2020 to 2024
    • Market Size Value (USD Million) Forecast By Market Taxonomy, 2025 to 2035
      • By Country
        • Brazil
        • Chile
        • Rest of Latin America
      • By Source
      • By Functionality
      • By Application
    • Market Attractiveness Analysis
      • By Country
      • By Source
      • By Functionality
      • By Application
    • Key Takeaways
  12. Western Europe Market Analysis 2020 to 2024 and Forecast 2025 to 2035, By Country
    • Historical Market Size Value (USD Million) Trend Analysis By Market Taxonomy, 2020 to 2024
    • Market Size Value (USD Million) Forecast By Market Taxonomy, 2025 to 2035
      • By Country
        • Germany
        • UK
        • Italy
        • Spain
        • France
        • Nordic
        • BENELUX
        • Rest of Western Europe
      • By Source
      • By Functionality
      • By Application
    • Market Attractiveness Analysis
      • By Country
      • By Source
      • By Functionality
      • By Application
    • Key Takeaways
  13. Eastern Europe Market Analysis 2020 to 2024 and Forecast 2025 to 2035, By Country
    • Historical Market Size Value (USD Million) Trend Analysis By Market Taxonomy, 2020 to 2024
    • Market Size Value (USD Million) Forecast By Market Taxonomy, 2025 to 2035
      • By Country
        • Russia
        • Poland
        • Hungary
        • Balkan & Baltic
        • Rest of Eastern Europe
      • By Source
      • By Functionality
      • By Application
    • Market Attractiveness Analysis
      • By Country
      • By Source
      • By Functionality
      • By Application
    • Key Takeaways
  14. East Asia Market Analysis 2020 to 2024 and Forecast 2025 to 2035, By Country
    • Historical Market Size Value (USD Million) Trend Analysis By Market Taxonomy, 2020 to 2024
    • Market Size Value (USD Million) Forecast By Market Taxonomy, 2025 to 2035
      • By Country
        • China
        • Japan
        • South Korea
      • By Source
      • By Functionality
      • By Application
    • Market Attractiveness Analysis
      • By Country
      • By Source
      • By Functionality
      • By Application
    • Key Takeaways
  15. South Asia and Pacific Market Analysis 2020 to 2024 and Forecast 2025 to 2035, By Country
    • Historical Market Size Value (USD Million) Trend Analysis By Market Taxonomy, 2020 to 2024
    • Market Size Value (USD Million) Forecast By Market Taxonomy, 2025 to 2035
      • By Country
        • India
        • ASEAN
        • Australia & New Zealand
        • Rest of South Asia and Pacific
      • By Source
      • By Functionality
      • By Application
    • Market Attractiveness Analysis
      • By Country
      • By Source
      • By Functionality
      • By Application
    • Key Takeaways
  16. Middle East & Africa Market Analysis 2020 to 2024 and Forecast 2025 to 2035, By Country
    • Historical Market Size Value (USD Million) Trend Analysis By Market Taxonomy, 2020 to 2024
    • Market Size Value (USD Million) Forecast By Market Taxonomy, 2025 to 2035
      • By Country
        • Kingdom of Saudi Arabia
        • Other GCC Countries
        • Turkiye
        • South Africa
        • Other African Union
        • Rest of Middle East & Africa
      • By Source
      • By Functionality
      • By Application
    • Market Attractiveness Analysis
      • By Country
      • By Source
      • By Functionality
      • By Application
    • Key Takeaways
  17. Key Countries Market Analysis
    • USA
      • Pricing Analysis
      • Market Share Analysis, 2024
        • By Source
        • By Functionality
        • By Application
    • Canada
      • Pricing Analysis
      • Market Share Analysis, 2024
        • By Source
        • By Functionality
        • By Application
    • Mexico
      • Pricing Analysis
      • Market Share Analysis, 2024
        • By Source
        • By Functionality
        • By Application
    • Brazil
      • Pricing Analysis
      • Market Share Analysis, 2024
        • By Source
        • By Functionality
        • By Application
    • Chile
      • Pricing Analysis
      • Market Share Analysis, 2024
        • By Source
        • By Functionality
        • By Application
    • Germany
      • Pricing Analysis
      • Market Share Analysis, 2024
        • By Source
        • By Functionality
        • By Application
    • UK
      • Pricing Analysis
      • Market Share Analysis, 2024
        • By Source
        • By Functionality
        • By Application
    • Italy
      • Pricing Analysis
      • Market Share Analysis, 2024
        • By Source
        • By Functionality
        • By Application
    • Spain
      • Pricing Analysis
      • Market Share Analysis, 2024
        • By Source
        • By Functionality
        • By Application
    • France
      • Pricing Analysis
      • Market Share Analysis, 2024
        • By Source
        • By Functionality
        • By Application
    • India
      • Pricing Analysis
      • Market Share Analysis, 2024
        • By Source
        • By Functionality
        • By Application
    • ASEAN
      • Pricing Analysis
      • Market Share Analysis, 2024
        • By Source
        • By Functionality
        • By Application
    • Australia & New Zealand
      • Pricing Analysis
      • Market Share Analysis, 2024
        • By Source
        • By Functionality
        • By Application
    • China
      • Pricing Analysis
      • Market Share Analysis, 2024
        • By Source
        • By Functionality
        • By Application
    • Japan
      • Pricing Analysis
      • Market Share Analysis, 2024
        • By Source
        • By Functionality
        • By Application
    • South Korea
      • Pricing Analysis
      • Market Share Analysis, 2024
        • By Source
        • By Functionality
        • By Application
    • Russia
      • Pricing Analysis
      • Market Share Analysis, 2024
        • By Source
        • By Functionality
        • By Application
    • Poland
      • Pricing Analysis
      • Market Share Analysis, 2024
        • By Source
        • By Functionality
        • By Application
    • Hungary
      • Pricing Analysis
      • Market Share Analysis, 2024
        • By Source
        • By Functionality
        • By Application
    • Kingdom of Saudi Arabia
      • Pricing Analysis
      • Market Share Analysis, 2024
        • By Source
        • By Functionality
        • By Application
    • Turkiye
      • Pricing Analysis
      • Market Share Analysis, 2024
        • By Source
        • By Functionality
        • By Application
    • South Africa
      • Pricing Analysis
      • Market Share Analysis, 2024
        • By Source
        • By Functionality
        • By Application
  18. Market Structure Analysis
    • Competition Dashboard
    • Competition Benchmarking
    • Market Share Analysis of Top Players
      • By Regional
      • By Source
      • By Functionality
      • By Application
  19. Competition Analysis
    • Competition Deep Dive
      • Cargill Inc (USA)
        • Overview
        • Product Portfolio
        • Profitability by Market Segments (Product/Age /Sales Channel/Region)
        • Sales Footprint
        • Strategy Overview
          • Marketing Strategy
          • Product Strategy
          • Channel Strategy
      • Kerry Group Plc (Ireland)
      • AIT Ingredients (France)
      • Ohly GmbH (Germany)
      • Biorigin Zilor (Brazil)
      • Alltech Life Sciences (USA)
      • Tate & Lyle Plc (UK)
      • Koninklijke DSM N.V. (Netherlands)
      • Garuda International Inc (USA)
      • Angel Yeast Co Ltd (China)
      • Biotec BetaGlucans AS (Norway)
      • Ceapro Inc (Canada)
  20. Assumptions & Acronyms Used
  21. Research Methodology

List of Tables

  • Table 1: Global Market Value (USD Million) Forecast by Region, 2020-2035
  • Table 2: Global Market Value (USD Million) Forecast by Source , 2020-2035
  • Table 3: Global Market Value (USD Million) Forecast by Functionality, 2020-2035
  • Table 4: Global Market Value (USD Million) Forecast by Application, 2020-2035
  • Table 5: North America Market Value (USD Million) Forecast by Country, 2020-2035
  • Table 6: North America Market Value (USD Million) Forecast by Source , 2020-2035
  • Table 7: North America Market Value (USD Million) Forecast by Functionality, 2020-2035
  • Table 8: North America Market Value (USD Million) Forecast by Application, 2020-2035
  • Table 9: Latin America Market Value (USD Million) Forecast by Country, 2020-2035
  • Table 10: Latin America Market Value (USD Million) Forecast by Source , 2020-2035
  • Table 11: Latin America Market Value (USD Million) Forecast by Functionality, 2020-2035
  • Table 12: Latin America Market Value (USD Million) Forecast by Application, 2020-2035
  • Table 13: Western Europe Market Value (USD Million) Forecast by Country, 2020-2035
  • Table 14: Western Europe Market Value (USD Million) Forecast by Source , 2020-2035
  • Table 15: Western Europe Market Value (USD Million) Forecast by Functionality, 2020-2035
  • Table 16: Western Europe Market Value (USD Million) Forecast by Application, 2020-2035
  • Table 17: Eastern Europe Market Value (USD Million) Forecast by Country, 2020-2035
  • Table 18: Eastern Europe Market Value (USD Million) Forecast by Source , 2020-2035
  • Table 19: Eastern Europe Market Value (USD Million) Forecast by Functionality, 2020-2035
  • Table 20: Eastern Europe Market Value (USD Million) Forecast by Application, 2020-2035
  • Table 21: East Asia Market Value (USD Million) Forecast by Country, 2020-2035
  • Table 22: East Asia Market Value (USD Million) Forecast by Source , 2020-2035
  • Table 23: East Asia Market Value (USD Million) Forecast by Functionality, 2020-2035
  • Table 24: East Asia Market Value (USD Million) Forecast by Application, 2020-2035
  • Table 25: South Asia and Pacific Market Value (USD Million) Forecast by Country, 2020-2035
  • Table 26: South Asia and Pacific Market Value (USD Million) Forecast by Source , 2020-2035
  • Table 27: South Asia and Pacific Market Value (USD Million) Forecast by Functionality, 2020-2035
  • Table 28: South Asia and Pacific Market Value (USD Million) Forecast by Application, 2020-2035
  • Table 29: Middle East & Africa Market Value (USD Million) Forecast by Country, 2020-2035
  • Table 30: Middle East & Africa Market Value (USD Million) Forecast by Source , 2020-2035
  • Table 31: Middle East & Africa Market Value (USD Million) Forecast by Functionality, 2020-2035
  • Table 32: Middle East & Africa Market Value (USD Million) Forecast by Application, 2020-2035

List of Figures

  • Figure 1: Global Market Pricing Analysis
  • Figure 2: Global Market Value (USD Million) Forecast 2020-2035
  • Figure 3: Global Market Value Share and BPS Analysis by Source , 2025 and 2035
  • Figure 4: Global Market Y-o-Y Growth Comparison by Source , 2025-2035
  • Figure 5: Global Market Attractiveness Analysis by Source
  • Figure 6: Global Market Value Share and BPS Analysis by Functionality, 2025 and 2035
  • Figure 7: Global Market Y-o-Y Growth Comparison by Functionality, 2025-2035
  • Figure 8: Global Market Attractiveness Analysis by Functionality
  • Figure 9: Global Market Value Share and BPS Analysis by Application, 2025 and 2035
  • Figure 10: Global Market Y-o-Y Growth Comparison by Application, 2025-2035
  • Figure 11: Global Market Attractiveness Analysis by Application
  • Figure 12: Global Market Value (USD Million) Share and BPS Analysis by Region, 2025 and 2035
  • Figure 13: Global Market Y-o-Y Growth Comparison by Region, 2025-2035
  • Figure 14: Global Market Attractiveness Analysis by Region
  • Figure 15: North America Market Incremental Dollar Opportunity, 2025-2035
  • Figure 16: Latin America Market Incremental Dollar Opportunity, 2025-2035
  • Figure 17: Western Europe Market Incremental Dollar Opportunity, 2025-2035
  • Figure 18: Eastern Europe Market Incremental Dollar Opportunity, 2025-2035
  • Figure 19: East Asia Market Incremental Dollar Opportunity, 2025-2035
  • Figure 20: South Asia and Pacific Market Incremental Dollar Opportunity, 2025-2035
  • Figure 21: Middle East & Africa Market Incremental Dollar Opportunity, 2025-2035
  • Figure 22: North America Market Value Share and BPS Analysis by Country, 2025 and 2035
  • Figure 23: North America Market Value Share and BPS Analysis by Source , 2025 and 2035
  • Figure 24: North America Market Y-o-Y Growth Comparison by Source , 2025-2035
  • Figure 25: North America Market Attractiveness Analysis by Source
  • Figure 26: North America Market Value Share and BPS Analysis by Functionality, 2025 and 2035
  • Figure 27: North America Market Y-o-Y Growth Comparison by Functionality, 2025-2035
  • Figure 28: North America Market Attractiveness Analysis by Functionality
  • Figure 29: North America Market Value Share and BPS Analysis by Application, 2025 and 2035
  • Figure 30: North America Market Y-o-Y Growth Comparison by Application, 2025-2035
  • Figure 31: North America Market Attractiveness Analysis by Application
  • Figure 32: Latin America Market Value Share and BPS Analysis by Country, 2025 and 2035
  • Figure 33: Latin America Market Value Share and BPS Analysis by Source , 2025 and 2035
  • Figure 34: Latin America Market Y-o-Y Growth Comparison by Source , 2025-2035
  • Figure 35: Latin America Market Attractiveness Analysis by Source
  • Figure 36: Latin America Market Value Share and BPS Analysis by Functionality, 2025 and 2035
  • Figure 37: Latin America Market Y-o-Y Growth Comparison by Functionality, 2025-2035
  • Figure 38: Latin America Market Attractiveness Analysis by Functionality
  • Figure 39: Latin America Market Value Share and BPS Analysis by Application, 2025 and 2035
  • Figure 40: Latin America Market Y-o-Y Growth Comparison by Application, 2025-2035
  • Figure 41: Latin America Market Attractiveness Analysis by Application
  • Figure 42: Western Europe Market Value Share and BPS Analysis by Country, 2025 and 2035
  • Figure 43: Western Europe Market Value Share and BPS Analysis by Source , 2025 and 2035
  • Figure 44: Western Europe Market Y-o-Y Growth Comparison by Source , 2025-2035
  • Figure 45: Western Europe Market Attractiveness Analysis by Source
  • Figure 46: Western Europe Market Value Share and BPS Analysis by Functionality, 2025 and 2035
  • Figure 47: Western Europe Market Y-o-Y Growth Comparison by Functionality, 2025-2035
  • Figure 48: Western Europe Market Attractiveness Analysis by Functionality
  • Figure 49: Western Europe Market Value Share and BPS Analysis by Application, 2025 and 2035
  • Figure 50: Western Europe Market Y-o-Y Growth Comparison by Application, 2025-2035
  • Figure 51: Western Europe Market Attractiveness Analysis by Application
  • Figure 52: Eastern Europe Market Value Share and BPS Analysis by Country, 2025 and 2035
  • Figure 53: Eastern Europe Market Value Share and BPS Analysis by Source , 2025 and 2035
  • Figure 54: Eastern Europe Market Y-o-Y Growth Comparison by Source , 2025-2035
  • Figure 55: Eastern Europe Market Attractiveness Analysis by Source
  • Figure 56: Eastern Europe Market Value Share and BPS Analysis by Functionality, 2025 and 2035
  • Figure 57: Eastern Europe Market Y-o-Y Growth Comparison by Functionality, 2025-2035
  • Figure 58: Eastern Europe Market Attractiveness Analysis by Functionality
  • Figure 59: Eastern Europe Market Value Share and BPS Analysis by Application, 2025 and 2035
  • Figure 60: Eastern Europe Market Y-o-Y Growth Comparison by Application, 2025-2035
  • Figure 61: Eastern Europe Market Attractiveness Analysis by Application
  • Figure 62: East Asia Market Value Share and BPS Analysis by Country, 2025 and 2035
  • Figure 63: East Asia Market Value Share and BPS Analysis by Source , 2025 and 2035
  • Figure 64: East Asia Market Y-o-Y Growth Comparison by Source , 2025-2035
  • Figure 65: East Asia Market Attractiveness Analysis by Source
  • Figure 66: East Asia Market Value Share and BPS Analysis by Functionality, 2025 and 2035
  • Figure 67: East Asia Market Y-o-Y Growth Comparison by Functionality, 2025-2035
  • Figure 68: East Asia Market Attractiveness Analysis by Functionality
  • Figure 69: East Asia Market Value Share and BPS Analysis by Application, 2025 and 2035
  • Figure 70: East Asia Market Y-o-Y Growth Comparison by Application, 2025-2035
  • Figure 71: East Asia Market Attractiveness Analysis by Application
  • Figure 72: South Asia and Pacific Market Value Share and BPS Analysis by Country, 2025 and 2035
  • Figure 73: South Asia and Pacific Market Value Share and BPS Analysis by Source , 2025 and 2035
  • Figure 74: South Asia and Pacific Market Y-o-Y Growth Comparison by Source , 2025-2035
  • Figure 75: South Asia and Pacific Market Attractiveness Analysis by Source
  • Figure 76: South Asia and Pacific Market Value Share and BPS Analysis by Functionality, 2025 and 2035
  • Figure 77: South Asia and Pacific Market Y-o-Y Growth Comparison by Functionality, 2025-2035
  • Figure 78: South Asia and Pacific Market Attractiveness Analysis by Functionality
  • Figure 79: South Asia and Pacific Market Value Share and BPS Analysis by Application, 2025 and 2035
  • Figure 80: South Asia and Pacific Market Y-o-Y Growth Comparison by Application, 2025-2035
  • Figure 81: South Asia and Pacific Market Attractiveness Analysis by Application
  • Figure 82: Middle East & Africa Market Value Share and BPS Analysis by Country, 2025 and 2035
  • Figure 83: Middle East & Africa Market Value Share and BPS Analysis by Source , 2025 and 2035
  • Figure 84: Middle East & Africa Market Y-o-Y Growth Comparison by Source , 2025-2035
  • Figure 85: Middle East & Africa Market Attractiveness Analysis by Source
  • Figure 86: Middle East & Africa Market Value Share and BPS Analysis by Functionality, 2025 and 2035
  • Figure 87: Middle East & Africa Market Y-o-Y Growth Comparison by Functionality, 2025-2035
  • Figure 88: Middle East & Africa Market Attractiveness Analysis by Functionality
  • Figure 89: Middle East & Africa Market Value Share and BPS Analysis by Application, 2025 and 2035
  • Figure 90: Middle East & Africa Market Y-o-Y Growth Comparison by Application, 2025-2035
  • Figure 91: Middle East & Africa Market Attractiveness Analysis by Application
  • Figure 92: Global Market - Tier Structure Analysis
  • Figure 93: Global Market - Company Share Analysis
Dashboard
Dashboard
Dashboard
Dashboard
Dashboard
Dashboard

Full Research Suite comprises of:

Market outlook & trends analysis

Market outlook & trends analysis

Interviews & case studies

Interviews & case studies

Strategic recommendations

Strategic recommendations

Vendor profiles & capabilities analysis

Vendor profiles & capabilities analysis

5-year forecasts

5-year forecasts

8 regions and 60+ country-level data splits

8 regions and 60+ country-level data splits

Market segment data splits

Market segment data splits

12 months of continuous data updates

12 months of continuous data updates

DELIVERED AS:

PDF EXCEL ONLINE

Full Research Suite


$3500

$5000

$6500

Buy Report Now
Future Market Insights

Beta-Glucanase Market

Chat With MaRIA

Chat With

MaRIA

Hi There, I am MaRIA, Your Market Research Intelligence Assistant. How may I help you?