
- Market Size (2026)
- USD 16.6 Bn
- Forecast (2036)
- USD 35.1 Bn
- CAGR (2026 to 2036)
- 7.8%
How big is the Biomethane Market in 2026?
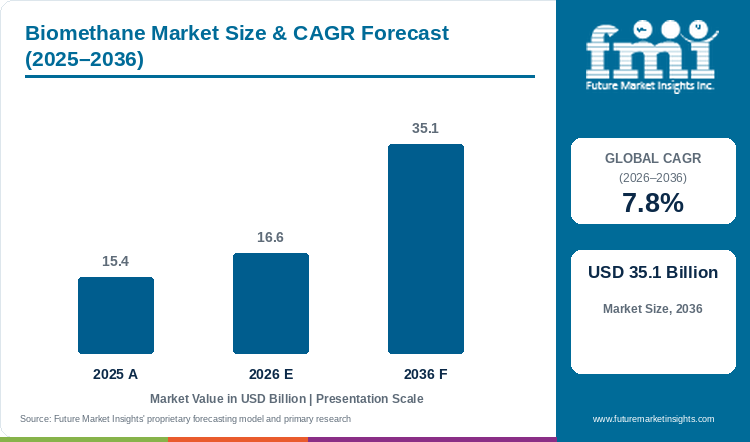
The global Biomethane Market is estimated at USD 16.60 billion in 2026, compared with USD 15.4 billion in 2025, and is forecast to reach USD 35.14 billion by 2036, expanding at a CAGR of 7.8% from 2026 to 2036.
Dedicated anaerobic digestion with upgrading accounts for the largest share of production routes at 56.7%, while recovered landfill gas contributes 41.3% by feedstock and transport fuel holds 47.5% by fuel outlet. Demand for biomethane is supported by government initiatives encouraging renewable gas consumption and investments in production infrastructure. However, commercial supply remains dependent on plant commissioning and access to gas distribution networks. According to India's GOBARdhan portal, 1,908 compressed biogas plants were registered as of August 6, 2026, but only 217 had been commissioned and 339 were under construction. The operational facilities were producing approximately 0.4 million standard cubic metres of gas per day. Manufacturers are also investing in gas upgrading and pipeline connectivity to increase commercial deliveries. In August 2026, Waga Energy and Decatur Hills commissioned a biomethane production facility in Greensburg, Indiana, with an annual production capacity of approximately 60 GWh. The project includes a dedicated 3-kilometre pipeline connecting the facility to the local gas grid. The installation provides a direct outlet for upgraded landfill gas and supports recurring commercial sales.
Key Market Trends & Insights
- Germany's dena Biogasregister began automating cross-border biomethane-certificate transfers through ERGaR in August 2026. The change reduces manual registry work for participating trades; it concerns the transfer of evidence rather than a new physical gas connection.
- Ofgem's October 2026 guidance moves sustainability audits from registration anniversaries to scheme years. Audit and reporting services therefore face a changed compliance calendar for supported biomethane plants.
- The European Commission identifies separate organic-waste collection, required under the Waste Framework Directive since 2024, as a source of additional biomethane feedstock. Collection policy can expand the managed waste available to digesters before new gas-production capacity is built.
Regional Highlights
- In Europe, Germany, France, Italy, Denmark and the Netherlands supplied 93% of EU biomethane production in 2024, according to the IEA. This concentration gives upgrading and maintenance suppliers a substantial operating base in a small group of national markets.
- In North America, the RNG Coalition recorded 130 additional operational renewable-natural-gas facilities in 2025. The addition expands the regional equipment base requiring service; the facility count does not measure US-only output or deliveries per plant.
Table 1: Biomethane Market Size and Forecast (USD billion and CAGR percentage), 2025 to 2036
| Market size and forecast | Value |
|---|---|
| Market size in 2025 | USD 15.4 billion |
| Estimated market size in 2026 | USD 16.60 billion |
| Projected market size by 2036 | USD 35.14 billion |
| CAGR from 2026 to 2036 | 7.8% |
| Added revenue from 2026 to 2036 | USD 18.54 billion |
Source: Future Market Insights, Biomethane Market Report, 2026 to 2036.
Analyst Perspective
“A registered digester is not biomethane delivered to a customer. The commercial test is whether the plant can upgrade raw gas, connect to an outlet and meter the volume that actually leaves the site.”
- Nikhil Kaitwade, Principal Consultant, FMI
How is the Biomethane Market segmented?
Feedstock identifies the original biogenic material, production route identifies its conversion or recovery process, and fuel outlet identifies the assigned customer use. Known fuel outlets take priority over the delivery path; grid sales without an identified use remain separate.
- By Feedstock: Recovered landfill gas, Agricultural waste, Food and municipal biowaste, Sewage waste, Energy crops and other biogenic feedstock.
- By Production Route: Dedicated anaerobic digestion with upgrading, Landfill gas recovery with upgrading, Gasification with methanation, Other biogenic conversion routes.
- By Fuel Outlet: Transport fuel, Power generation, Building and district-heating fuel, Industrial fuel, Unallocated grid-fuel outlet, Other fuel uses.
- By Region: North America, Latin America, Western Europe, Eastern Europe, East Asia, South Asia and Pacific, Middle East and Africa.
Why does dedicated anaerobic digestion with upgrading lead by production route?
Dedicated anaerobic digestion with upgrading holds 56.7% of the Biomethane Market by production route in 2026, according to FMI's assessment.
Policy support gives controlled digestion a commercial route into gas networks. Ofgem's Green Gas Support Scheme pays eligible new anaerobic-digestion biomethane plants for gas injected into the grid. In India, GOBARdhan combines plant assistance with biomass aggregation and gas-evacuation support. These programmes address different parts of the same production chain, supporting investment in digestion as well as the treatment and connection needed to sell its output. Landfill-origin gas remains in the separate recovery route, even though biological decomposition also produces it.
The distinction between installed equipment and operating supply is material. Verbio reported about 1,190 GWh of group biomethane production and 60.1% utilisation for fiscal 2024/2025. FMI finds that the utilisation record leaves operating performance relevant alongside new plant construction. The dedicated-digestion category covers controlled conversion of manure, agricultural residues, managed food and municipal biowaste, sewage and other eligible biogenic inputs; it does not absorb landfill recovery or non-biogenic synthetic methane.
Table 2: Biomethane Market Share by Production Route, 2026
| Leading Share | 2026 market share |
|---|---|
| Dedicated anaerobic digestion with upgrading | 56.7% |
| All Other Segments Combined Share | 43.3% |
Source: Future Market Insights, Biomethane Market Report, 2026 to 2036.
Why does recovered landfill gas lead by feedstock?
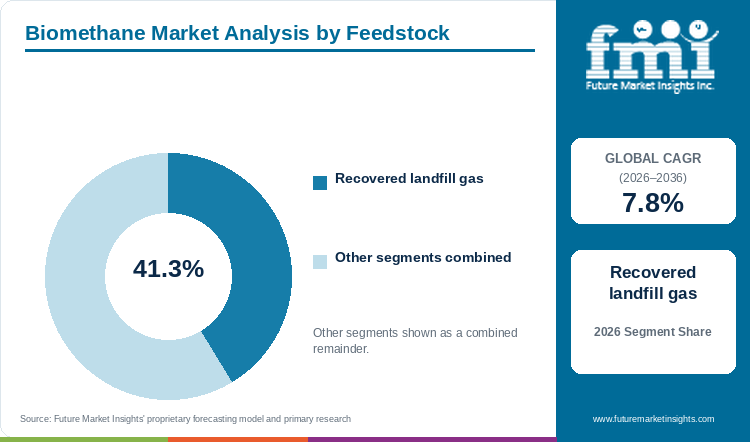
Recovered landfill gas holds 41.3% of the Biomethane Market by feedstock in 2026, according to FMI's assessment.
Landfill upgrading develops a gas stream already being collected at a waste-management site, rather than relying on a new programme of digester feed deliveries. Waga and Decatur Hills commissioned an Indiana RNG unit in August 2026 to recover gas that had been flared. The example supports the commercial importance of treatment and network access at existing landfills; it does not establish a full year of metered output.
EPA identifies landfills alongside livestock, wastewater, food-production and organic-waste digesters as RNG sources. It also lists siloxanes, volatile organic compounds and hydrogen sulphide among contaminants requiring treatment. FMI finds that the landfill opportunity includes a site-specific gas-cleaning duty, not simply the installation of standard digester equipment. In this assessment, deposited waste remains landfill-origin feedstock, while separately collected organics retain their own feedstock class. Direct use of raw landfill gas for local heat or electricity falls outside upgraded-gas sales.
Table 3: Biomethane Market Share by Feedstock, 2026
| Leading Share | 2026 market share |
|---|---|
| Recovered landfill gas | 41.3% |
| All Other Segments Combined Share | 58.7% |
Source: Future Market Insights, Biomethane Market Report, 2026 to 2036.
Why does transport fuel lead by fuel outlet?
Transport fuel accounts for 47.5% of the Biomethane Market by fuel outlet in 2026, according to FMI's assessment of assigned fuel sales.
Transport incentives give renewable gas a value beyond its energy content in established fuel markets. The IEA identifies federal renewable-fuel instruments and state low-carbon-fuel programmes as important supports for US RNG growth. These are US mechanisms, rather than evidence that the same incentive applies worldwide. Their commercial effect is to link fuel sales with the environmental attributes recognised by the relevant programme.
Fuel preparation also depends on the delivery form. ETW's Aschhofen reference, commissioned in 2025, specifies methane purity above 99.5% for integration with a downstream LNG plant and describes treatment of recycled LNG gas. That project shows a treatment requirement beyond ordinary gas-grid compatibility. The fuel-outlet classification assigns identified transport sales to transport even when gas travels through a network. Grid sales without an identified customer use remain in Unallocated grid-fuel outlet; they are not presumed to become transport fuel or counted as a second sale.
Table 4: Biomethane Market Share by Fuel Outlet, 2026
| Leading Share | 2026 market share |
|---|---|
| Transport fuel | 47.5% |
| All Other Segments Combined Share | 52.5% |
Source: Future Market Insights, Biomethane Market Report, 2026 to 2036.
What are the key drivers restraints and opportunities?
Project conversion and operating output shape the outlook from USD 16.60 billion in 2026 to USD 35.14 billion in 2036. Offtake support expands the market for gas, while permitting and connection delays hold back delivery from otherwise viable resources.
Driver
India's October 2026 GOBARdhan launch assigns CBG procurement obligations to city-gas distribution entities and maps plants to identified distribution areas or clusters. FMI finds that this creates a defined purchaser alongside plant-development support. It strengthens the sales basis for new capacity, although the framework still has to be implemented at each site.
Restraint
Biogas projects can face environmental, agricultural and waste approvals together, and local design differences complicate permitting, according to the IEA. Delayed permissions or interconnection postpone gas sales even when production equipment is ready. The commercial exposure lies between capital committed to the plant and the date accepted gas begins earning revenue.
Opportunity
Existing injection sites offer work beyond new plant construction. GRDF's 2025 review reports that 36% of agricultural sites increased their maximum injection capability during the year. FMI sees upgrading and network-adaptation work as a separate opportunity: operating sites can expand accepted deliveries without every order requiring a new digester.
How do quality and sustainability rules affect biomethane purchasing?
Gas quality and environmental eligibility impose different obligations. EPA identifies moisture, carbon dioxide, trace contaminants, nitrogen and oxygen in its RNG treatment description. Ofgem separately requires periodic reporting and sustainability audits under its support scheme. A fuel sale may therefore require both treatment performance and a qualifying production record. Gas meeting a methane specification does not automatically qualify for every environmental payment.
What limits reliable biomethane operation and delivery?
Verbio's fiscal 2024/2025 biomethane utilisation of 60.1% illustrates why installed capacity cannot be treated as delivered gas. At Aschhofen, ETW describes treatment of recycled LNG gas as part of stable operation, with current biogas processing of 1,850 Nm3/h and a planned increase to 2,060 Nm3/h. These records concern different stages and plants, but both place operating integration alongside equipment rating when assessing available supply.
Where can biomethane suppliers win additional business?
Landfill recovery and existing-site expansion provide two distinct openings. Waga's Indiana commissioning adds gas treatment to a landfill resource, while GRDF records capacity increases at operating agricultural sites. Brazil's origin-certification programme creates another market for documented gas and its attributes. Each opening rests on a specific asset or regulatory route; none makes all biological gas automatically saleable biomethane.
Biomethane Market by Country (2026 to 2036)
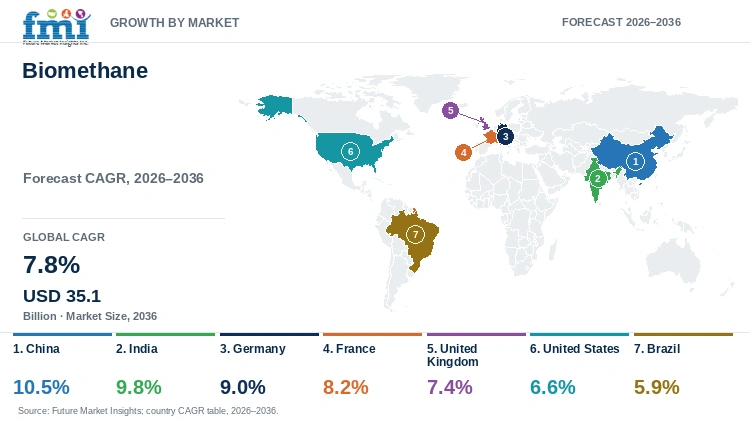
Table 5: Biomethane Market Country CAGR Comparison, 2026 to 2036
| Country | CAGR |
|---|---|
| China | 10.5% |
| India | 9.8% |
| Germany | 9.0% |
| France | 8.2% |
| United Kingdom | 7.4% |
| United States | 6.6% |
| Brazil | 5.9% |
Source: Future Market Insights, Biomethane Market Report, 2026 to 2036.
What supports biomethane demand in China?
China's move towards larger biological-gas plants creates a different equipment market from its household-digester base. The IEA describes government support shifting towards medium and large plants as provinces gain gas and electricity connections, with more diversified feedstock mixes. That change supports professional collection and upgrading, but direct raw-biogas use remains relevant where a gas outlet is unavailable. The IEA also notes that active small-scale household digesters have been declining.
Commercial purchasing has also begun to develop beyond small local systems. The IEA's Renewables 2025 review records the first biomethane purchase agreements involving Chinese providers in 2024 and notes recently commissioned bio-natural-gas plants by state-owned energy and gas companies. These developments support an emerging traded-gas chain. They do not show that every larger plant supplies a network, or that all announced capacity has secured a fuel customer.
FMI's 10.5% CAGR forecast for China from 2026 to 2036 reflects that transition to commercial upgraded-gas projects. The distinction matters for supplier revenue: larger digestion equipment is one part of the opportunity, while treatment and access to an actual fuel purchaser determine whether output enters this market. Chemical and energy demand remain distinct: the IEA includes both in its industrial outlook. Only fuel sales contribute to the market assessed here.
What supports biomethane demand in India?
India's project register shows a large gap between development interest and operating supply. On 6 August 2026, the government reported 1,908 registered CBG plants, including 217 commissioned plants producing 0.4 million standard cubic metres a day and 339 under construction. Commissioned output anchors the current gas offering; the construction group identifies possible future production and equipment work. Neither registration nor installed capacity demonstrates full utilisation.
The October GOBARdhan launch addresses several constraints behind that gap. The ministry identified volatile revenues, fragmented support, feedstock assurance, organic-manure offtake and access to finance as existing sector problems. Its framework combines offtake, pricing, capital assistance, pipeline support and credit guarantees. FMI finds that this broadens support beyond the digester purchase to the recurring costs and gas-evacuation arrangements that determine whether the plant remains in operation.
Sustained output and additional commissioning underpin India's 9.8% CAGR forecast from 2026 to 2036. The scheme maps plants to city-gas areas or CBG clusters and places procurement obligations on city-gas distributors. That gives the project pipeline an identified class of purchaser. Actual orders will still depend on state-level land, feedstock and approvals: the ministry specifically assigns those implementation tasks to state governments. Suppliers face an opportunity across aggregation, upgrading and connection work, with sales timing tied to project readiness rather than the full registered count.
What supports biomethane demand in Germany?
Germany's injection fleet expanded after several years of limited growth. Dena records 268 sites, about 12,290 GWh injected and 84% utilisation in 2025. Those are operating and injection measures, rather than the size of the wider biogas fleet. They give suppliers an existing base for maintenance and output improvements alongside orders from new projects.
Nine further plants were in planning in dena's register, with about 11,280 Nm3/h of combined upgrading capacity. Their contribution remains prospective. Germany's 9.0% CAGR forecast from 2026 to 2036 combines this development pipeline with continued operation of the installed fleet. Dena links recent plant additions to connection requests initiated in anticipation of transport-quota demand after the 2022 price high and heating demand following changes to the Buildings Energy Act from 2024. The order pipeline therefore reflects earlier commercial signals as well as current injection performance.
The feedstock mix is changing within the operating base. Dena links diversification to greenhouse-gas requirements, restrictions on maize and the treatment of manure-derived biomethane under the transport quota. Its detailed comparison is limited to plants with complete data, and it distinguishes material mass from energy contribution. This matters commercially because a change in wet feed tonnage need not bring the same change in saleable methane. German operating records therefore support a more specific supplier proposition than a broad claim about agricultural resources: adaptation of feed handling, recovery and upgrading to the mixture actually entering the plant.
What supports biomethane demand in France?
France's biomethane growth includes both new injection sites and expansion at operating plants. GRDF's interoperator review records 13.5 TWh injected in 2025, 16% above 2024, with an average utilisation measure of 94.5% of maximum injection capability. Agricultural and territorial industrial categories account for about 88% of units in the reviewed setting. The figures establish substantial operating supply, while the review's category limits prevent treating them as the performance of every prospective project.
Network adaptation remains part of that growth. The same review lists 37 reverse-flow installations in service, with combined compression capacity of 4.56 TWh a year, within a programme of 95 planned installations. FMI finds that this creates a distinct infrastructure market alongside digestion and upgrading. The completed installations are an operating asset base; the remainder represent planned network work rather than capacity already available to producers.
France's 8.2% CAGR forecast from 2026 to 2036 reflects further connections and continued operation within local gas-acceptance conditions. The review lists 73 new sites commissioned and 802 methanisation units in 2025. FMI finds that this larger decentralised production base supports two sources of equipment demand: treatment at individual sites and adaptation of the receiving network. The reverse-flow programme provides a specific measure of the latter, while actual injection records show the supply already reaching gas buyers.
What supports biomethane demand in the United Kingdom?
The United Kingdom's supported project pipeline has separate entry and commissioning deadlines. Ofgem closes new stage 1 applications on 31 March 2028, while the commissioning and stage 3 deadline extends to 31 March 2030. The scheme covers England, Scotland and Wales. These dates create a construction window beyond the initial application deadline; they do not imply that every plant seeking support can postpone injection on identical terms.
Payments are linked to eligible biomethane injected into the grid and can continue quarterly for up to 15 years. This puts accepted gas volumes, rather than equipment delivery, at the centre of the supported revenue stream. FMI's 7.4% CAGR forecast for the United Kingdom from 2026 to 2036 reflects conversion of eligible developments into operating supply. Feedstock, permits and gas connections remain necessary before the scheme's payment basis can support continuing plant income.
Compliance also continues after registration. Ofgem's version 3.0 guidance, updated on 16 October 2026, covers periodic data, payments and audits, and moves sustainability audits from registration anniversaries to scheme years. That change affects the timing of evidence work at operating plants, sustaining a service requirement beyond construction. It also separates two supplier opportunities: equipment and connection work before commissioning, and measurement, reporting and audit support during operation.
What supports biomethane demand in the United States?
An existing landfill collection system can support new US RNG sales when upgrading and grid access are added. Waga and Decatur Hills announced commissioning of their Greensburg, Indiana unit on 19 August 2026, with a three-kilometre connection to the local gas grid. Its stated annual production capability is a design figure, rather than a reported full year of deliveries. The project demonstrates an operating development model without establishing national output or utilisation.
US supply is not confined to landfills. EPA lists livestock, wastewater, food-production and organic-waste facilities as raw-gas sources and describes treatment of moisture, carbon dioxide and trace contaminants. FMI's 6.6% CAGR forecast for the United States from 2026 to 2036 reflects development across these sources. The variety matters to equipment revenue because treatment duties depend on the incoming gas, while an existing collection site still needs a suitable upgrader and a commercial outlet.
The distinction between a regional facility count and saleable US gas remains important. The RNG Coalition's North American additions show expansion of the installed base, not annual US deliveries. For that larger base, maintenance and gas recovery remain recurring work after commissioning. EPA also distinguishes dedicated delivery to a user from network injection. A grid-connected plant therefore does not, by that fact alone, establish the customer's final fuel use. Grid-fuel sales without an identified customer use remain separate from assigned transport sales.
What supports biomethane demand in Brazil?
Brazil's biomethane programme creates demand for origin evidence as well as physical gas. ANP administers target-compliance and origin-certification procedures under Law 14.993/2024 and Decree 12.614/2025. A producer's certificate eligibility remains distinct from its output: the framework does not establish the quantity delivered by an individual plant. FMI's 5.9% CAGR forecast for Brazil from 2026 to 2036 reflects gradual conversion of gas projects within that developing commercial framework.
ANP's Board approved the completed CGOB fungibility study on 26 June 2026. The conclusion retains case-by-case validation rather than automatic equivalence between certificates, citing differences in methods, registry systems and audits. FMI finds that another environmental certificate needs a demonstrated basis for recognition before it can support a Brazilian compliance transaction.
ANP's March account links CGOB to biomethane produced and commercialised, including evidence of feedstock origin and production location. The June conclusion specifies methodological equivalence, environmental integrity, traceability and system governance as validation criteria. The regulator also states that individual compulsory targets can be met by buying biomethane or by buying and retiring CGOBs. FMI finds that this creates a separate compliance market for verified attributes alongside physical gas sales. Certification and certificate retirement consequently have a commercial role beyond the upgrading and delivery assets at a plant.
Who are the notable companies in the Biomethane Market?
Verbio, ETW Energietechnik, Waga Energy and GRDF occupy different parts of the biomethane chain. Verbio produces fuel, ETW supplies upgrading technology, Waga develops landfill-gas projects, and GRDF operates gas-distribution infrastructure receiving biomethane. Their disclosed activities identify separate sources of revenue and project responsibility rather than comparable global company shares.
Verbio reported about 1,190 GWh of group biomethane production in fiscal 2024/2025, with utilisation of 60.1%. That operating record distinguishes a fuel producer from an equipment vendor, although it is not German national production. ETW's Aschhofen reference describes pressure-swing adsorption and treatment for an LNG outlet, including recycled gas from liquefaction. Its commercial role is the performance of a defined treatment system.
Waga's Indiana commissioning combines landfill upgrading with a dedicated grid connection, while GRDF's 2025 review covers injection performance and network adaptation in France. FMI finds that these positions make the connection boundary commercially significant: the gas producer, treatment supplier and network operator carry different operating obligations. Project comparisons therefore need to identify the stage being supplied. A gas-production disclosure cannot be read as equipment sales, and a network's injected volume cannot be assigned as its own biomethane production.
Key Developments in the Biomethane Market
- On 19 August 2026, Waga Energy and Decatur Hills announced commissioning of an RNG production unit in Greensburg, Indiana, with a connection to the local gas grid.
Key Players in the Biomethane Market
- Verbio
- ETW Energietechnik
- Waga Energy
- GRDF
Biomethane Market Report Scope
Table 6: Report Scope for the Biomethane Market, 2026 to 2036
| Coverage field | Report scope |
|---|---|
| Market definition | Upgraded methane from biogenic feedstock sold as gas fuel, valued once at first commercialisation with associated producer gas-linked attributes counted once. |
| Product boundary | Excludes direct raw-biogas use, captive upgraded gas without a marketed-gas transaction, non-biogenic synthetic methane, chemical feedstock, equipment, services, non-gas coproducts and downstream resale revenues. |
| Quantitative units | USD billion for market value; percentages for segment shares and country CAGR. |
| Physical evidence | GWh, TWh and cubic metres identify production, injection or capacity as stated by each source. |
| Forecast period | 2026 to 2036, with 2025 as the preceding reference year. |
| Segment coverage | Feedstock; production route; fuel outlet. Agricultural waste includes manure and agricultural residues. Energy crops and other biogenic feedstock includes energy crops, industrial organic residues, forestry and wood residues, and other eligible biogenic material. |
| Geographic coverage | Seven global regions and the nested country coverage below. |
| Country profiles | China, India, Germany, France, United Kingdom, United States and Brazil. |
| Competitive coverage | Fuel production, upgrading equipment, project development and gas-network roles; project status kept explicit. |
| Allocation | Known fuel outlets take priority; unidentified grid-fuel sales remain separate. Dedicated digestion excludes landfill-origin gas. Hybrid output follows original biogenic source, with incremental methane metered or mass-balanced and allocated once. |
Source: Future Market Insights, Biomethane Market Report, 2026 to 2036.
Biomethane Market Research Methodology
The assessment combines the market outlook with secondary evidence from government project-status data, network injection records, company reports and public energy analysis. Feedstock, production route and fuel outlet classify upgraded biogenic gas sold as fuel, with each gas value counted once within each breakdown. Known fuel outlets are assigned first; grid sales without an identified use remain separate. Operating quantities are distinguished from nameplate capacity, planned projects and registrations. Raw-biogas use and non-fuel sales are excluded. No new interviews or field surveys were conducted.
Biomethane Market by Segments
Biomethane Market segmented by Feedstock:
- Recovered landfill gas
- Agricultural waste
- Food and municipal biowaste
- Sewage waste
- Energy crops and other biogenic feedstock
Biomethane Market segmented by Production Route:
- Dedicated anaerobic digestion with upgrading
- Landfill gas recovery with upgrading
- Gasification with methanation
- Other biogenic conversion routes
Biomethane Market segmented by Fuel Outlet:
- Transport fuel
- Power generation
- Building and district-heating fuel
- Industrial fuel
- Unallocated grid-fuel outlet
- Other fuel uses
Biomethane Market by Region
- North America
- United States
- Canada
- Latin America
- Brazil
- Mexico
- Argentina
- Chile
- Western Europe
- Germany
- France
- United Kingdom
- Italy
- Spain
- Benelux
- Nordics
- Eastern Europe
- Poland
- Czech Republic
- Romania
- Hungary
- East Asia
- China
- Japan
- South Korea
- Taiwan
- South Asia and Pacific
- India
- Singapore
- Other ASEAN countries
- Australia and New Zealand
- Middle East and Africa
- GCC Countries
- South Africa
- Turkiye
- Israel
Research Sources and Bibliography
- [1] International Energy Agency. Renewables 2025: Biogases. 2025; accessed 31 October 2026.
- [2] Government of India, Press Information Bureau. GOBARdhan: Fuelling Clean Energy and Rural Growth. 6 August 2026.
- [3] European Commission. Biomethane: Key Actions and Production Potential. Accessed 31 October 2026.
- [4] Verbio. Annual Report 2024/2025, operational statistics and segment reporting. 2025.
- [5] GRDF. Retour d'experience sur l'injection de biomethane en 2025. March 2026.
- [6] Ofgem. Green Gas Support Scheme Guidance, version 3.0. 16 October 2026.
- [7] ETW Energietechnik. Biomethane Plant Aschhofen. Accessed 31 October 2026.
- [8] Deutsche Energie-Agentur, dena. Biomethaneinspeisung Deutschland 2025. June 2026; published 6 July 2026.
- [9] RNG Coalition. 2025 Yielded Record-High Annual Facility Growth for RNG. 13 March 2026.
- [10] Agencia Nacional do Petroleo, Gas Natural e Biocombustiveis, ANP. Programa de Incentivo ao Biometano. Accessed 31 October 2026.
- [11] Ofgem. Green Gas Support Scheme and Green Gas Levy. Accessed 31 October 2026.
- [12] International Energy Agency. Outlook for Biogas and Biomethane: Biogas and Biomethane Outlook to 2050. 28 May 2025.
- [13] US Environmental Protection Agency. Renewable Natural Gas. Accessed 31 October 2026.
- [14] Waga Energy. Decatur Hills and Waga Energy Commission a Renewable Natural Gas Production Unit in Indiana. 19 August 2026.
- [15] Deutsche Energie-Agentur, dena. Biogasregister: Automated ERGaR Certificate Transfers and Registry Information. August 2026; accessed 31 October 2026.
- [16] Government of India, Ministry of Petroleum and Natural Gas. Union Minister Launches GOBARdhan Scheme to Accelerate Development of India's Compressed Biogas Sector. 1 October 2026.
- [17] International Energy Agency. Outlook for Biogas and Biomethane: Key Issues Affecting Biogas and Biomethane Projects. 28 May 2025.
- [18] Agencia Nacional do Petroleo, Gas Natural e Biocombustiveis, ANP. ANP abre prazo para envio de contribuicoes sobre estudo de fungibilidade do CGOB. 25 March 2026.
- [19] Agencia Nacional do Petroleo, Gas Natural e Biocombustiveis, ANP. Nota Tecnica no. 82/2026/STM/ANP-RJ, CGOB fungibility and certification. March 2026.
- [20] Agencia Nacional do Petroleo, Gas Natural e Biocombustiveis, ANP. ANP aprova relatorio tecnico sobre fungibilidade do Certificado de Garantia de Origem do Biometano (CGOB). 26 June 2026; updated 29 June 2026.
Table of Content
- Key Takeaways
- Market Size and CAGR
- Top Growth Driver
- Fastest Growing Segment
- Leading Region
- Key Companies
- Emerging Opportunities
- Executive Summary
- Global Market Outlook
- Demand-side Trends
- Supply-side Trends
- Technology Roadmap Analysis
- Analysis and Recommendations
- Analyst Perspective (What is happening? Why now? What should investors know?)
- Key Questions Answered
- How large is the market?
- What is the CAGR?
- What are key trends?
- Which region dominates?
- Who are the leaders?
Read More...
- Market Overview
- Market Coverage / Taxonomy
- Market Definition / Scope / Limitations
- Research Methodology
- Chapter Orientation
- Analytical Lens and Working Hypotheses
- Market Structure, Signals, and Trend Drivers
- Benchmarking and Cross-market Comparability
- Market Sizing, Forecasting, and Opportunity Mapping
- Research Design and Evidence Framework
- Desk Research Programme (Secondary Evidence)
- Expert Input and Fieldwork (Primary Evidence)
- Tooling, Models, and Reference Databases
- Data Engineering and Model Build
- Quality Assurance and Audit Trail
- Market Background
- Market Dynamics (Drivers, Restraints, Opportunity, Trends)
- Scenario Forecast (Optimistic, Likely, Conservative)
- Impact Analysis
- AI Impact
- Sustainability Impact
- Regulatory Impact
- Technology Impact
- Consumer / Buyer Analysis
- Purchase Drivers
- Adoption Barriers
- Buyer Journey
- Opportunity Map Analysis
- Product Life Cycle Analysis
- Supply Chain Analysis
- Investment Feasibility Matrix
- Value Chain Analysis
- PESTLE and Porter's Analysis
- Regulatory Landscape
- Regional Parent Market Outlook
- Production and Consumption Statistics
- Import and Export Statistics
- Global Market Analysis and Forecast, 2021 to 2036
- Historical Market Size Value (USD Billion) Analysis, 2021 to 2025
- Current and Future Market Size Value (USD Billion) Projections, 2026 to 2036
- Y-o-Y Growth Trend Analysis
- Absolute $ Opportunity Analysis
- Global Market Pricing Analysis, 2021 to 2036
- Global Market Analysis and Forecast, By Feedstock, 2021 to 2036
- Introduction / Key Findings
- Historical Market Size Value (USD Billion) Analysis By Feedstock, 2021 to 2025
- Current and Future Market Size Value (USD Billion) Analysis and Forecast By Feedstock, 2026 to 2036
- Recovered landfill gas
- Agricultural waste
- Food and municipal biowaste
- Sewage waste
- Energy crops and other biogenic feedstock
- Y-o-Y Growth Trend Analysis By Feedstock, 2021 to 2025
- Absolute $ Opportunity Analysis By Feedstock, 2026 to 2036
- Global Market Analysis and Forecast, By Production Route, 2021 to 2036
- Introduction / Key Findings
- Historical Market Size Value (USD Billion) Analysis By Production Route, 2021 to 2025
- Current and Future Market Size Value (USD Billion) Analysis and Forecast By Production Route, 2026 to 2036
- Dedicated anaerobic digestion with upgrading
- Landfill gas recovery with upgrading
- Gasification with methanation
- Other biogenic conversion routes
- Y-o-Y Growth Trend Analysis By Production Route, 2021 to 2025
- Absolute $ Opportunity Analysis By Production Route, 2026 to 2036
- Global Market Analysis and Forecast, By Fuel Outlet, 2021 to 2036
- Introduction / Key Findings
- Historical Market Size Value (USD Billion) Analysis By Fuel Outlet, 2021 to 2025
- Current and Future Market Size Value (USD Billion) Analysis and Forecast By Fuel Outlet, 2026 to 2036
- Transport fuel
- Power generation
- Building and district-heating fuel
- Industrial fuel
- Unallocated grid-fuel outlet
- Other fuel uses
- Y-o-Y Growth Trend Analysis By Fuel Outlet, 2021 to 2025
- Absolute $ Opportunity Analysis By Fuel Outlet, 2026 to 2036
- Global Market Analysis and Forecast, By Region, 2021 to 2036
- Introduction
- Historical Market Size Value (USD Billion) Analysis By Region, 2021 to 2025
- Current Market Size Value (USD Billion) Analysis and Forecast By Region, 2026 to 2036
- North America
- Latin America
- Western Europe
- Eastern Europe
- East Asia
- South Asia and Pacific
- Middle East and Africa
- Market Attractiveness Analysis By Region
- North America Market Analysis and Forecast, By Country, 2021 to 2036
- Historical Market Size Value (USD Billion) Trend Analysis By Market Taxonomy, 2021 to 2025
- Market Size Value (USD Billion) Forecast By Market Taxonomy, 2026 to 2036
- By Country
- United States
- Canada
- By Feedstock
- By Production Route
- By Fuel Outlet
- By Country
- Market Attractiveness Analysis
- By Country
- By Feedstock
- By Production Route
- By Fuel Outlet
- Key Takeaways
- Latin America Market Analysis and Forecast, By Country
- Historical Market Size Value (USD Billion) Trend Analysis By Market Taxonomy, 2021 to 2025
- Market Size Value (USD Billion) Forecast By Market Taxonomy, 2026 to 2036
- By Country
- Brazil
- Mexico
- Argentina
- Chile
- By Feedstock
- By Production Route
- By Fuel Outlet
- By Country
- Market Attractiveness Analysis
- By Country
- By Feedstock
- By Production Route
- By Fuel Outlet
- Key Takeaways
- Western Europe Market Analysis and Forecast, By Country
- Historical Market Size Value (USD Billion) Trend Analysis By Market Taxonomy, 2021 to 2025
- Market Size Value (USD Billion) Forecast By Market Taxonomy, 2026 to 2036
- By Country
- Germany
- France
- United Kingdom
- Italy
- Spain
- Benelux
- Nordics
- By Feedstock
- By Production Route
- By Fuel Outlet
- By Country
- Market Attractiveness Analysis
- By Country
- By Feedstock
- By Production Route
- By Fuel Outlet
- Key Takeaways
- Eastern Europe Market Analysis and Forecast, By Country
- Historical Market Size Value (USD Billion) Trend Analysis By Market Taxonomy, 2021 to 2025
- Market Size Value (USD Billion) Forecast By Market Taxonomy, 2026 to 2036
- By Country
- Poland
- Czech Republic
- Romania
- Hungary
- By Feedstock
- By Production Route
- By Fuel Outlet
- By Country
- Market Attractiveness Analysis
- By Country
- By Feedstock
- By Production Route
- By Fuel Outlet
- Key Takeaways
- East Asia Market Analysis and Forecast, By Country
- Historical Market Size Value (USD Billion) Trend Analysis By Market Taxonomy, 2021 to 2025
- Market Size Value (USD Billion) Forecast By Market Taxonomy, 2026 to 2036
- By Country
- China
- Japan
- South Korea
- Taiwan
- By Feedstock
- By Production Route
- By Fuel Outlet
- By Country
- Market Attractiveness Analysis
- By Country
- By Feedstock
- By Production Route
- By Fuel Outlet
- Key Takeaways
- South Asia and Pacific Market Analysis and Forecast, By Country
- Historical Market Size Value (USD Billion) Trend Analysis By Market Taxonomy, 2021 to 2025
- Market Size Value (USD Billion) Forecast By Market Taxonomy, 2026 to 2036
- By Country
- India
- Singapore
- Other ASEAN countries
- Australia and New Zealand
- By Feedstock
- By Production Route
- By Fuel Outlet
- By Country
- Market Attractiveness Analysis
- By Country
- By Feedstock
- By Production Route
- By Fuel Outlet
- Key Takeaways
- Middle East and Africa Market Analysis and Forecast, By Country
- Historical Market Size Value (USD Billion) Trend Analysis By Market Taxonomy, 2021 to 2025
- Market Size Value (USD Billion) Forecast By Market Taxonomy, 2026 to 2036
- By Country
- GCC Countries
- South Africa
- Turkiye
- Israel
- By Feedstock
- By Production Route
- By Fuel Outlet
- By Country
- Market Attractiveness Analysis
- By Country
- By Feedstock
- By Production Route
- By Fuel Outlet
- Key Takeaways
- Key Countries Market Analysis
- United States
- Pricing Analysis
- Market Share Analysis, 2025
- By Feedstock
- By Production Route
- By Fuel Outlet
- Canada
- Pricing Analysis
- Market Share Analysis, 2025
- By Feedstock
- By Production Route
- By Fuel Outlet
- Mexico
- Pricing Analysis
- Market Share Analysis, 2025
- By Feedstock
- By Production Route
- By Fuel Outlet
- Brazil
- Pricing Analysis
- Market Share Analysis, 2025
- By Feedstock
- By Production Route
- By Fuel Outlet
- Chile
- Pricing Analysis
- Market Share Analysis, 2025
- By Feedstock
- By Production Route
- By Fuel Outlet
- Germany
- Pricing Analysis
- Market Share Analysis, 2025
- By Feedstock
- By Production Route
- By Fuel Outlet
- United Kingdom
- Pricing Analysis
- Market Share Analysis, 2025
- By Feedstock
- By Production Route
- By Fuel Outlet
- Italy
- Pricing Analysis
- Market Share Analysis, 2025
- By Feedstock
- By Production Route
- By Fuel Outlet
- Spain
- Pricing Analysis
- Market Share Analysis, 2025
- By Feedstock
- By Production Route
- By Fuel Outlet
- France
- Pricing Analysis
- Market Share Analysis, 2025
- By Feedstock
- By Production Route
- By Fuel Outlet
- India
- Pricing Analysis
- Market Share Analysis, 2025
- By Feedstock
- By Production Route
- By Fuel Outlet
- Australia and New Zealand
- Pricing Analysis
- Market Share Analysis, 2025
- By Feedstock
- By Production Route
- By Fuel Outlet
- China
- Pricing Analysis
- Market Share Analysis, 2025
- By Feedstock
- By Production Route
- By Fuel Outlet
- Japan
- Pricing Analysis
- Market Share Analysis, 2025
- By Feedstock
- By Production Route
- By Fuel Outlet
- South Korea
- Pricing Analysis
- Market Share Analysis, 2025
- By Feedstock
- By Production Route
- By Fuel Outlet
- Poland
- Pricing Analysis
- Market Share Analysis, 2025
- By Feedstock
- By Production Route
- By Fuel Outlet
- Hungary
- Pricing Analysis
- Market Share Analysis, 2025
- By Feedstock
- By Production Route
- By Fuel Outlet
- South Africa
- Pricing Analysis
- Market Share Analysis, 2025
- By Feedstock
- By Production Route
- By Fuel Outlet
- United States
- Market Structure Analysis
- Competition Dashboard
- Competition Benchmarking
- Market Share Analysis of Top Players
- By Regional
- By Feedstock
- By Production Route
- By Fuel Outlet
- Emerging Startups
- Innovation Benchmarking
- Competition Analysis
- Competition Deep Dive
- Verbio
- Overview
- Product Portfolio
- Profitability by Market Segments
- Sales Footprint
- Strategy Overview
- Marketing Strategy
- Product Strategy
- Channel Strategy
- ETW Energietechnik
- Waga Energy
- GRDF
- Verbio
- Case Studies
- Success Stories
- Recent Developments
- Competition Deep Dive
- Assumptions & Acronyms Used
List of Tables
- Table 1: Global Market Value (USD Billion) Forecast by Region, 2021 to 2036
- Table 2: Global Market Value (USD Billion) Forecast by Feedstock, 2021 to 2036
- Table 3: Global Market Value (USD Billion) Forecast by Production Route, 2021 to 2036
- Table 4: Global Market Value (USD Billion) Forecast by Fuel Outlet, 2021 to 2036
- Table 5: North America Market Value (USD Billion) Forecast by Country, 2021 to 2036
- Table 6: North America Market Value (USD Billion) Forecast by Feedstock, 2021 to 2036
- Table 7: North America Market Value (USD Billion) Forecast by Production Route, 2021 to 2036
- Table 8: North America Market Value (USD Billion) Forecast by Fuel Outlet, 2021 to 2036
- Table 9: Latin America Market Value (USD Billion) Forecast by Country, 2021 to 2036
- Table 10: Latin America Market Value (USD Billion) Forecast by Feedstock, 2021 to 2036
- Table 11: Latin America Market Value (USD Billion) Forecast by Production Route, 2021 to 2036
- Table 12: Latin America Market Value (USD Billion) Forecast by Fuel Outlet, 2021 to 2036
- Table 13: Western Europe Market Value (USD Billion) Forecast by Country, 2021 to 2036
- Table 14: Western Europe Market Value (USD Billion) Forecast by Feedstock, 2021 to 2036
- Table 15: Western Europe Market Value (USD Billion) Forecast by Production Route, 2021 to 2036
- Table 16: Western Europe Market Value (USD Billion) Forecast by Fuel Outlet, 2021 to 2036
- Table 17: Eastern Europe Market Value (USD Billion) Forecast by Country, 2021 to 2036
- Table 18: Eastern Europe Market Value (USD Billion) Forecast by Feedstock, 2021 to 2036
- Table 19: Eastern Europe Market Value (USD Billion) Forecast by Production Route, 2021 to 2036
- Table 20: Eastern Europe Market Value (USD Billion) Forecast by Fuel Outlet, 2021 to 2036
- Table 21: East Asia Market Value (USD Billion) Forecast by Country, 2021 to 2036
- Table 22: East Asia Market Value (USD Billion) Forecast by Feedstock, 2021 to 2036
- Table 23: East Asia Market Value (USD Billion) Forecast by Production Route, 2021 to 2036
- Table 24: East Asia Market Value (USD Billion) Forecast by Fuel Outlet, 2021 to 2036
- Table 25: South Asia and Pacific Market Value (USD Billion) Forecast by Country, 2021 to 2036
- Table 26: South Asia and Pacific Market Value (USD Billion) Forecast by Feedstock, 2021 to 2036
- Table 27: South Asia and Pacific Market Value (USD Billion) Forecast by Production Route, 2021 to 2036
- Table 28: South Asia and Pacific Market Value (USD Billion) Forecast by Fuel Outlet, 2021 to 2036
- Table 29: Middle East and Africa Market Value (USD Billion) Forecast by Country, 2021 to 2036
- Table 30: Middle East and Africa Market Value (USD Billion) Forecast by Feedstock, 2021 to 2036
- Table 31: Middle East and Africa Market Value (USD Billion) Forecast by Production Route, 2021 to 2036
- Table 32: Middle East and Africa Market Value (USD Billion) Forecast by Fuel Outlet, 2021 to 2036
List of Figures
- Figure 1: Global Market Pricing Analysis
- Figure 2: Global Market Value (USD Billion) Forecast 2021-2036
- Figure 3: Global Market Value Share and BPS Analysis by Feedstock, 2026 and 2036
- Figure 4: Global Market Y-o-Y Growth Comparison by Feedstock, 2026-2036
- Figure 5: Global Market Attractiveness Analysis by Feedstock
- Figure 6: Global Market Value Share and BPS Analysis by Production Route, 2026 and 2036
- Figure 7: Global Market Y-o-Y Growth Comparison by Production Route, 2026-2036
- Figure 8: Global Market Attractiveness Analysis by Production Route
- Figure 9: Global Market Value Share and BPS Analysis by Fuel Outlet, 2026 and 2036
- Figure 10: Global Market Y-o-Y Growth Comparison by Fuel Outlet, 2026-2036
- Figure 11: Global Market Attractiveness Analysis by Fuel Outlet
- Figure 12: Global Market Value (USD Billion) Share and BPS Analysis by Region, 2026 and 2036
- Figure 13: Global Market Y-o-Y Growth Comparison by Region, 2026-2036
- Figure 14: Global Market Attractiveness Analysis by Region
- Figure 15: North America Market Incremental Dollar Opportunity, 2026-2036
- Figure 16: Latin America Market Incremental Dollar Opportunity, 2026-2036
- Figure 17: Western Europe Market Incremental Dollar Opportunity, 2026-2036
- Figure 18: Eastern Europe Market Incremental Dollar Opportunity, 2026-2036
- Figure 19: East Asia Market Incremental Dollar Opportunity, 2026-2036
- Figure 20: South Asia and Pacific Market Incremental Dollar Opportunity, 2026-2036
- Figure 21: Middle East and Africa Market Incremental Dollar Opportunity, 2026-2036
- Figure 22: North America Market Value Share and BPS Analysis by Country, 2026 and 2036
- Figure 23: North America Market Value Share and BPS Analysis by Feedstock, 2026 and 2036
- Figure 24: North America Market Y-o-Y Growth Comparison by Feedstock, 2026-2036
- Figure 25: North America Market Attractiveness Analysis by Feedstock
- Figure 26: North America Market Value Share and BPS Analysis by Production Route, 2026 and 2036
- Figure 27: North America Market Y-o-Y Growth Comparison by Production Route, 2026-2036
- Figure 28: North America Market Attractiveness Analysis by Production Route
- Figure 29: North America Market Value Share and BPS Analysis by Fuel Outlet, 2026 and 2036
- Figure 30: North America Market Y-o-Y Growth Comparison by Fuel Outlet, 2026-2036
- Figure 31: North America Market Attractiveness Analysis by Fuel Outlet
- Figure 32: Latin America Market Value Share and BPS Analysis by Country, 2026 and 2036
- Figure 33: Latin America Market Value Share and BPS Analysis by Feedstock, 2026 and 2036
- Figure 34: Latin America Market Y-o-Y Growth Comparison by Feedstock, 2026-2036
- Figure 35: Latin America Market Attractiveness Analysis by Feedstock
- Figure 36: Latin America Market Value Share and BPS Analysis by Production Route, 2026 and 2036
- Figure 37: Latin America Market Y-o-Y Growth Comparison by Production Route, 2026-2036
- Figure 38: Latin America Market Attractiveness Analysis by Production Route
- Figure 39: Latin America Market Value Share and BPS Analysis by Fuel Outlet, 2026 and 2036
- Figure 40: Latin America Market Y-o-Y Growth Comparison by Fuel Outlet, 2026-2036
- Figure 41: Latin America Market Attractiveness Analysis by Fuel Outlet
- Figure 42: Western Europe Market Value Share and BPS Analysis by Country, 2026 and 2036
- Figure 43: Western Europe Market Value Share and BPS Analysis by Feedstock, 2026 and 2036
- Figure 44: Western Europe Market Y-o-Y Growth Comparison by Feedstock, 2026-2036
- Figure 45: Western Europe Market Attractiveness Analysis by Feedstock
- Figure 46: Western Europe Market Value Share and BPS Analysis by Production Route, 2026 and 2036
- Figure 47: Western Europe Market Y-o-Y Growth Comparison by Production Route, 2026-2036
- Figure 48: Western Europe Market Attractiveness Analysis by Production Route
- Figure 49: Western Europe Market Value Share and BPS Analysis by Fuel Outlet, 2026 and 2036
- Figure 50: Western Europe Market Y-o-Y Growth Comparison by Fuel Outlet, 2026-2036
- Figure 51: Western Europe Market Attractiveness Analysis by Fuel Outlet
- Figure 52: Eastern Europe Market Value Share and BPS Analysis by Country, 2026 and 2036
- Figure 53: Eastern Europe Market Value Share and BPS Analysis by Feedstock, 2026 and 2036
- Figure 54: Eastern Europe Market Y-o-Y Growth Comparison by Feedstock, 2026-2036
- Figure 55: Eastern Europe Market Attractiveness Analysis by Feedstock
- Figure 56: Eastern Europe Market Value Share and BPS Analysis by Production Route, 2026 and 2036
- Figure 57: Eastern Europe Market Y-o-Y Growth Comparison by Production Route, 2026-2036
- Figure 58: Eastern Europe Market Attractiveness Analysis by Production Route
- Figure 59: Eastern Europe Market Value Share and BPS Analysis by Fuel Outlet, 2026 and 2036
- Figure 60: Eastern Europe Market Y-o-Y Growth Comparison by Fuel Outlet, 2026-2036
- Figure 61: Eastern Europe Market Attractiveness Analysis by Fuel Outlet
- Figure 62: East Asia Market Value Share and BPS Analysis by Country, 2026 and 2036
- Figure 63: East Asia Market Value Share and BPS Analysis by Feedstock, 2026 and 2036
- Figure 64: East Asia Market Y-o-Y Growth Comparison by Feedstock, 2026-2036
- Figure 65: East Asia Market Attractiveness Analysis by Feedstock
- Figure 66: East Asia Market Value Share and BPS Analysis by Production Route, 2026 and 2036
- Figure 67: East Asia Market Y-o-Y Growth Comparison by Production Route, 2026-2036
- Figure 68: East Asia Market Attractiveness Analysis by Production Route
- Figure 69: East Asia Market Value Share and BPS Analysis by Fuel Outlet, 2026 and 2036
- Figure 70: East Asia Market Y-o-Y Growth Comparison by Fuel Outlet, 2026-2036
- Figure 71: East Asia Market Attractiveness Analysis by Fuel Outlet
- Figure 72: South Asia and Pacific Market Value Share and BPS Analysis by Country, 2026 and 2036
- Figure 73: South Asia and Pacific Market Value Share and BPS Analysis by Feedstock, 2026 and 2036
- Figure 74: South Asia and Pacific Market Y-o-Y Growth Comparison by Feedstock, 2026-2036
- Figure 75: South Asia and Pacific Market Attractiveness Analysis by Feedstock
- Figure 76: South Asia and Pacific Market Value Share and BPS Analysis by Production Route, 2026 and 2036
- Figure 77: South Asia and Pacific Market Y-o-Y Growth Comparison by Production Route, 2026-2036
- Figure 78: South Asia and Pacific Market Attractiveness Analysis by Production Route
- Figure 79: South Asia and Pacific Market Value Share and BPS Analysis by Fuel Outlet, 2026 and 2036
- Figure 80: South Asia and Pacific Market Y-o-Y Growth Comparison by Fuel Outlet, 2026-2036
- Figure 81: South Asia and Pacific Market Attractiveness Analysis by Fuel Outlet
- Figure 82: Middle East and Africa Market Value Share and BPS Analysis by Country, 2026 and 2036
- Figure 83: Middle East and Africa Market Value Share and BPS Analysis by Feedstock, 2026 and 2036
- Figure 84: Middle East and Africa Market Y-o-Y Growth Comparison by Feedstock, 2026-2036
- Figure 85: Middle East and Africa Market Attractiveness Analysis by Feedstock
- Figure 86: Middle East and Africa Market Value Share and BPS Analysis by Production Route, 2026 and 2036
- Figure 87: Middle East and Africa Market Y-o-Y Growth Comparison by Production Route, 2026-2036
- Figure 88: Middle East and Africa Market Attractiveness Analysis by Production Route
- Figure 89: Middle East and Africa Market Value Share and BPS Analysis by Fuel Outlet, 2026 and 2036
- Figure 90: Middle East and Africa Market Y-o-Y Growth Comparison by Fuel Outlet, 2026-2036
- Figure 91: Middle East and Africa Market Attractiveness Analysis by Fuel Outlet
- Figure 92: Global Market - Tier Structure Analysis
- Figure 93: Global Market - Company Share Analysis
Frequently Asked Questions
What is the Biomethane Market forecast?
FMI's outlook places the market at USD 16.60 billion in 2026, compared with USD 15.4 billion in 2025, and USD 35.14 billion by 2036, at a 7.8% CAGR.
Which production route leads the Biomethane Market?
Dedicated anaerobic digestion with upgrading holds 56.7% by production route in FMI's 2026 assessment.
Which feedstock and fuel outlet lead the Biomethane Market?
Recovered landfill gas holds 41.3% by feedstock and transport fuel holds 47.5% by fuel outlet in FMI's 2026 assessment. Known outlets are assigned first; unidentified grid-fuel sales remain separate.
Which profiled country grows fastest?
China has the highest forecast rate among the seven profiled countries, at a 10.5% CAGR from 2026 to 2036.
Does a registered CBG plant already deliver gas?
Registration and commissioning are different project stages. India's 6 August 2026 account records 1,908 registered plants and 217 commissioned plants. [2]
Preview the report firsthand - request a free sample
Get SampleGet the brochure for pricing and purchase details.
Get PDF
